Below are the monthly updates from the most current February 2024 fuel price data (GasBuddy.com) and December 2023 electricity and natural gas price data (US Energy Information Administration). To view additional data and analysis related to the California economy visit our website at www.centerforjobs.org/ca.
California’s average energy rankings showed continued deterioration in the residential sector, while fuels and commercial electricity rates remained the highest among the contiguous states and DC. With no relief in sight, California’s energy policies are taking the state’s economy into a government-driven experiment that runs counter to its previous experience with economic growth. Nearly 8 decades of modern development economic theory have emphasized the role played by affordable and reliable energy supplies. Economies that have had this development asset—including, in the past, California to an extent nearly unequaled in the other states—progressed and produced multiple pathways for personal economic advancement. Those that still struggle to provide this critical infrastructure remain behind.
At least until recently, the economic fallout from California’s energy policies has been masked by the regulatory hands-off policies that enabled the high-tech industry to flourish in this state. The outsized contributions of this one industry to state GDP, personal income, and state revenues countered the relatively slower growth in other regions and parts of the state economy as they have faced the steadily rising bite of policy-driven costs. Rather than struggle with these same cost factors, high-tech instead moved its energy-intensive operations out of California to lower-cost energy locations, including server farms and cryptomining to other states and associated manufacturing to other countries such as coal-dependent China. The recent shift in high-tech growth trends, and more critically for the state budget, the related changes to income and tax revenues, now leave the state more dependent on those economic components affected the most by these rising costs.
The state’s energy policies were adopted during a period of transformations coming from the high-tech boom that proponents used to bolster their claims that the lessons of the past no longer applied. Those high regulations were not only consistent with the high economic growth the state was experiencing but in fact could generate even more. With high-tech going through yet another phase in its evolution, the state may now face the reality of having to move forward without the economic benefits that previously masked the consequences of its policy decisions.
Inflation Rises
California CPI
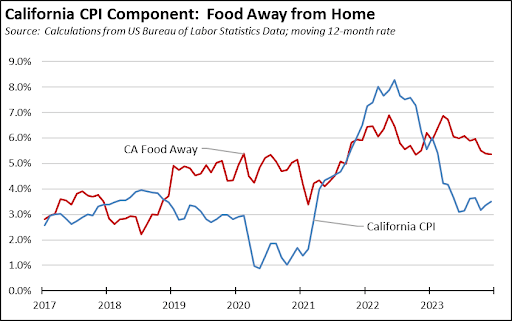
For the 12 months ending December, the California CPI rose 3.5%, up from 3.4% in November. In the same period, the US CPI rose 3.4% from 3.1% in November.
Price increases, however, vary by consumption expenditure. Using the same formula applied by Department of Finance in calculating the California CPI, Food Away from Home (restaurants and take out) continues to exhibit much higher price increases as business costs continue to rise especially for energy and labor. While some restaurants have begun to price in the costs of the state’s new minimum wage—both in the case of fast-food chains directly affected by this increase along with other restaurants that compete for the same labor pool—this associated food inflation is likely to move even higher in the months ahead.
California vs. Rest of US Diesel Price
Above Other States
(CA Average)
The February average price per gallon of diesel in California rose 7 cents from January to $5.39. The California premium above the average for the US other than California ($3.96) eased to $1.43, a 36.2% difference.
price
In February, California had the highest diesel price among the contiguous states and DC.
Range Between Highest and Lowest Prices by Region
above Other States
(Los Angeles
Region)
The cost premium above the US (other than California) average price for regular gasoline ranged from $1.34 in the Central Valley Region (average February price of $4.49), to $1.66 in Los Angeles Region (average February price of $4.81).
Highest/Lowest Fuel Prices by Legislative District:
California Residential Electricity Price
Rest of US
California average Residential Price for the 12 months ended December 2023 was 28.84 cents/kWh, 89.7% higher than the US average of 15.20 cents/kWh for all states other than California. California’s residential prices rose to the 3rd highest among the contiguous states and DC.
California Residential Electricity Bill
For the 12 months ended December 2023, the average annual Residential electricity bill in California was $1,707, or 71.7% higher ($713) than the comparable bill in 2010 (the year the AB 32 implementation began with the Early Action items). In this same period, the average US (less CA) electricity bill for all the other states grew only 20.4% ($279).
In 2010, California had the 9th lowest residential electricity bill among the contiguous states and DC. In the latest data, it rose to the 17th highest.
Residential bills, however, vary widely by region. Transforming the 2022 data recently released by the Energy Commission, estimated annual household usage is as much as 82% higher in the interior regions compared to the milder climate coastal areas, and substantially higher when comparing across counties.
Average Price in
Other States
For the 12 months ended December 2023, California’s higher electricity prices translated into Residential ratepayers paying $11.3 billion more than the average ratepayers elsewhere in the US using the same amount of energy.
California Commercial Electricity Price
Rest of US
California average Commercial Price for the 12 months ended December 2023 was 23.95 cents/kWh, 103.5% higher than the US average of 11.77 cents/kWh for all states other than California. California’s commercial prices were the highest among the contiguous states and DC.
California Industrial Electricity Price
Rest of US
California average Industrial Price for the 12 months ended December 2023 was 18.91 cents/kWh, 146.9% higher than the US average of 7.66 cents/kWh for all states other than California. California’s industrial prices were the 2nd highest among the contiguous states and DC.
Average Price in
Other States
For the 12 months ended December 2023, California’s higher electricity prices translated into Commercial & Industrial ratepayers paying $18.4 billion more than ratepayers elsewhere in the US using the same amount of energy. Compared to the lowest rate states, Commercial & Industrial ratepayers paid $23.6 billion more.
California Natural Gas Prices
Average prices ($ per thousand cubic feet; 12-month moving average) for the 12 months ended December 2023 and changes from the previous 12-month period for each end user: