Download California Green Jobs – 2018 Report
Download Executive Summary
Download Sidebar Electric Vehicles
Download Sidebar Prop. 39
Download Sidebar Recycling
Download Sidebar Solar Panels
Download Methodology
Introduction & Summary
The concept of green jobs has increasingly been used as a tool to justify environmental policies more broadly, and the state’s expanding program of climate change regulation specifically. In so doing, both proponents and the agencies now rely heavily on these—often unsubstantiated—job claims as purported indications that regulations will proceed cost-free or at worst under costs that are absorbable and balanced by a presumed increase in jobs.
The current path the state has chosen to a low-carbon economy, however, will not be painless. Consumers and employers already face growing costs from energy, fuels, housing, and commuting as a result of growing body of regulations. Combined with the evolving two-tier nature of the state’s economy, these costs also have considerably different effects on the different regions and on the income divides within each one.
As these regulations embrace more of the economic and daily living activity within the state, these costs have the potential to grow still larger. The foundational statutes behind the state program (AB 32) acknowledged this situation, mandating that the agencies adopt policies that are “cost effective” and seek ways to reach the climate goals at the lowest overall cost. But instead of allotting effort to analysis of cost effectiveness—in part driven by the ambitious time schedule to reach the goals—the concept of green jobs is used to argue that regulations will be cost free if not an economic benefit overall. As stated by Harvard economist Robert Stavins (2008) in the early stages of the AB 32 program:
Given that the debate about whether to implement AB 32 is over, the CARB should shift its attention away from defending its position that AB 32’s implementation will save Californians money – a position based on flawed analysis and inconsistent with decades of economic analysis on this important challenge. Instead, it should focus on analyzing how it can design policies that minimize the cost of meeting AB 32’s target, assessing the economic risks associated with implementing AB 32 and how best to reduce those risks, as well as evaluating the distributional and competitiveness impacts of AB 32’s implementation and how best to mitigate those impacts.
This current report builds on prior Center analyses of green job claims (2015, 2016) by providing additional background on three basic questions:
- What Is a Green Job? Reviews the current range of green/clean energy job definitions, estimates, and distributions across job type and industry. Based on this information, develops a preliminary estimate of California green jobs for use in the subsequent study phases.
- What Is the Economic Significance of Green Jobs? Assesses green jobs in terms of current claims of their significance to the California economy, including case study summaries of individual green job industries.
- What Is the Cost of Green Jobs? Contains initial assessments of the cost of key green job components for use in the subsequent study phases.
As indicated, this report is the first phase of a broader Center analysis of this issue. The initial estimates contained in this document—adjusted as necessary as the result of any comments we receive from outside reviewers—will form the basis for the next two steps: (1) a survey of California employers that will be used to refine the estimates and (2) an analysis of the net employment effects on California’s economy, an element that generally is missing from the current estimates developed by the various advocacy groups. The resulting analytical structure will then be used by the Center to develop periodic updates on this issue.
In approaching this project, the goal is to develop a more consistent and transparent base of information of this topic and thereby provide more of a basis for consideration of job creations and job impacts in discussions on California’s current policy trajectory. In so doing, this effort is intended to bring more information to the table on a topic that to date has been treated more in a manner best summarized by a similar recent review on this issue:
Exacerbating the situation is the fact that the most disruptive innovations arise from short-lived start-ups whose survival in the search for capital and market share depends, in part, on hyperbole that drives valuation. The ecosystem of disruptive innovation – where everyone and everything claims it will disrupt exponentially – is noisy, making it hard to assess which ideas will survive. As in much of the Fourth Industrial Revolution, the business model for this democratic, decentralized mode of innovation tends to yield a large-scale churn in ideas and a few “blockbuster” success stories. Success is typically equated with prescience when luck often plays the bigger role. Parts of the media exacerbate these problems of finding signal in all the noise, often reporting as truth what the new class of billionaires says without scrutiny.
World Economic Forum (2018), p.4
What Is a Green Job?
Definitions of Green Jobs have changed as the focus of regulations has changed. The concept of green jobs creation began with the start of the modern environmental movement, often cited as a beneficial byproduct as new regulations were adopted. Quantification efforts arrived later particularly as this concept has been used in tandem with various policy initiatives, notably green jobs from fiscal stimulus during the recent recession and more currently associated with climate change efforts. Green job definitions, however have changed as the focus of those policies has shifted, moving from a more generalized notion to an increasing measure of “clean energy” that now includes various components such as nuclear, natural gas, and hydroelectric that previously would have been excluded if not banned under the prior definitions. Consequently, it is challenging to compare the various estimates over time let alone reach definitive conclusions on whether such jobs are growing or even whether they constitute structural and presumably positive economy change.
Reports quantifying green jobs rely heavily on including indirect job contributions. Except for a few of the early efforts, the bulk of green job quantification reports, including the most recent and most often cited and including some components within the prior agency estimates as well, do not measure green jobs as a distinct and evolving industry, but instead are more attempts to measure what employment results when employers, consumers, and government spend money. In this respect, any job that has been touched directly or indirectly by “green” money in turn becomes reclassified as green. Consideration of indirect jobs is important, but this is a measure of the economic effect of green jobs, whether they produce a broader, more robust, or more resilient effect within the economy compared to more traditional job and consumer effects stemming from the cost of the policies that underlie the green jobs creation.
Reports quantifying green jobs rely heavily on reclassifying long-standing jobs. All the prior quantification reports incorporated some of level of reclassification in order to achieve their reported numbers. Long-standing jobs such as park workers, environmental regulators, garbage workers, and water and sewage treatment are included in the totals. Some of the more recent green/clean energy job estimates also include large components from activities such as public transit and from technologies such as hydroelectric, nuclear, and natural gas that are specifically excluded under various elements of California’s climate change program. This aspect is addressed in the estimates prepared for this project, with separate numbers that can be used to assess the importance of this factor in the prior estimates.
Reports quantifying green jobs rely heavily on part time and temporary jobs. By incorporating indirect jobs to augment the final tallies, most of the prior quantification reports include large elements from temporary, largely construction and services jobs that may last a matter of weeks or for several months. Few of the reports provide distributions that make this allocation clear, but in the ones that do, this temporary component exceeds more than half of the final amount. This aspect will be explicitly addressed in the subsequent phase of this project, and clearly identified as such. In addition, none of the job estimates are calculated as full time equivalent. This reflects to some extent the nature of even the underlying agency data, but most of the quantification reports classify a job as “green” if a worker spends at least 50% of their time on the covered green activities, and in some cases as little as 25%. The prior estimates from Employment Development Department (EDD; 2010) are one of the few to provide data to show the importance of this treatment. As measured by workers spending at least 50% of their time, EDD estimated 263,000 green jobs in the state. Measured by the 25% standard, the total was nearly two-thirds higher at 432,840—the more frequently reported number.
What Is the Economic Significance of Green Jobs?
Prior quantification reports show green/clean energy jobs are only 1% to 2% of total nonfarm jobs. While 500,000 green jobs (3.0% of nonfarm jobs) is the most frequently cited number for California—with this number used in various policy and political statements going back to at least 2007 and continuing through 2018—estimates of the direct jobs are considerably lower. Prior estimates of total direct green jobs range from 1.2% to 1.4% of nonfarm jobs, while estimates of clean energy jobs range from 1.0% in a report done for Air Resources Board (Environmental Business International, 2011) to the equivalent of about 2% in some of the more recent advocacy reports that contain much higher shares of part time jobs.
Growth in green/clean energy jobs does not demonstrate the resiliency of California’s economy under its high regulation model. Several of the green/clean energy job quantification reports show high growth from their measured totals in recent years, often accompanied by claims that this growth demonstrates that the state’s economy can produce superior jobs performance even under and in fact as a result of high regulation. These numbers, however, do not demonstrate sustainable resiliency, but instead reflect the fact that large numbers of construction jobs will be created when government requires a large number of generation plants to be built in a short time, that consumers will buy more of a product if government heavily subsidizes the cost, and that the associated green/clean energy jobs will decline just as quickly when the construction is complete and when the subsidies threaten to go away.
- Higher jobs growth overall for California since the recovery began in 2010 instead has come from a different source—the Bay Area high tech industries that are among some of the least regulated in the country. The Bay Area with 19% of the population accounted for 30% of the jobs recovery since 2010, and 39% of the net jobs growth compared to pre-recession highs in 2007.
- Real GDP in the Bay Area grew at an average annual rate of 4.7% since 2010, producing 44% of the total net growth in California through the end of 2016. The rest of California—largely reliant on industries more directly affected by the state’s high regulatory and tax conditions—grew only half as fast at 2.4%.
- As measured by real GDP, the Bay Area economy in 2016 was 28% larger than it was in 2007—taking into account both recovery and expansion growth—while the rest of the state was only 11% larger, or about the same as the 10% expansion experienced by all states other than California.
Green/clean energy jobs do not ensure continued jobs growth as emissions continue to be reduced. Even picking just the most generous estimates, green/clean energy jobs accounted at most for an apparent 6% – 8% of total new jobs from 2010 to 2016, and as little as 2% if only direct jobs are considered or if the combined direct/indirect numbers are adjusted for their high component of temporary and part time factors. Moreover, these jobs—as calculated by the methods used in these prior reports—are likely to decline, as already shown by a 14,000 job loss in the latest Solar Foundation estimates, and as currently planned renewable generation capacity winds down in California and the related construction jobs instead move to other states including Texas—the generally acknowledged contra-example of California’s high regulation/high tax economic model.
The emission reductions California has achieved to date are not associated with creating green/clean energy jobs, but instead largely come from other sources.
- A major component of the emissions reduced to date have not come from jobs growth but from jobs loss. Air Resources Board documents put the total emissions reduced by job losses during the recession at about one-third of the total required to meet the 2020 target. Other estimates put the recession-related reductions at as much as half.
- The most recent, partial emissions data shows 16.4 MMTCOe net reduction from sources required to file under the Mandatory Reporting Regulation. Of this amount, the primary reductions came from: 9.7 MMTCOe from imported electricity that produced little or no clean energy jobs in the state, 7.1 MMTCOe from in-state production of electricity primarily as 38 TWh of natural gas generation were largely replaced by a 30.3 TWh increase in conventional hydroelectric generation due to better weather, and 2.1 MMTCOe from oil and gas production as production levels and the associated high wage, blue collar jobs continued to drop.
- California’s emission reductions under its high regulatory model also show little difference from performance achieved elsewhere in the nation. In the latest California data, total climate change emissions in 2015 were 2.2% above their 1990 level. In the latest national data, total climate change emissions in 2016 were 2.4% above their 1990 level.
Prior green/clean energy job quantification reports do not demonstrate that these jobs will be a sustainable source of jobs as the state continues its current policies. As indicated, these jobs continue to be too few in number, too dependent on temporary construction and related service jobs levels, and too limited in the range of wage levels offered to provide more than a small component of the state’s total job needs in the future. In addition, a review of four cases—electric vehicles, solar energy, recycling, and Prop. 39 energy efficiency retrofits—where the state has targeted specific industries for green/clean jobs expansion illustrates the limited returns that are possible unless and until the state also addresses the broader competitive factors limiting their expansion:
- As with its economy overall, California remains competitive for green/clean energy jobs in the higher wage, knowledge components, the mixed wage sales and service components, and the shorter term, mixed wage installation and construction jobs. As shown through the history of the case examples, a broader range incorporating wage levels supporting middle class households has been missing or provided solely through the shorter term construction components. Even when such jobs if not the entire market began in the state such as for electric vehicles and solar panels, the more fundamental, unaddressed competitive factors have instead seen the state’s green policies generate these related jobs over time in other states and other countries.
At a time when the US as a whole is nearing achievement of its long-held energy dependence goals, California’s policies combined with the failure to match its green/clean energy promises with the competitiveness reforms essential to creating them here means this state is going in the opposite direction, becoming more reliant on energy components and related goods manufactured increasingly overseas.
- Many green/clean energy jobs remain reliant on continued subsidies, either through mandates or direct payments. Even in the case of the recycling programs that have existed since the 1980s, the promised technology breakthroughs and economies of scale still have not been realized. Job levels remain subject to the continued flow of subsidies—in some cases sensitive to momentary or even potential shifts in their availability.
- Subsidies are no substitute for the fundamental competitive operating factors required to generate the full wage range of job opportunities in the state. While state policies may serve to launch an industry, employers will still need to operate at profit levels allowing their continuance and growth, and they face many of the same competitive challenges employers within the much larger traditional industry base already face. The case examples illustrate the failures that occur when policy promises for a green jobs role in fulfilling a portion of the state’s future jobs growth do not deal with these constraints as well. By failing to address these competitive factors, the broader range of the job benefits from state policies has followed two courses: green jobs for those activities that have no choice but to be in the state and greener pasture jobs where operating costs have driven the location decision.
- The promises of green/clean energy jobs when state policies are first considered demonstrate a poor record in matching the jobs that are actually produced. Even in the Prop. 39 case where tracking of actual jobs created was statutorily mandated, the difficulties of doing this accounting forced the state to fall back on modeling estimates instead. And even accepting those estimates as valid, the program produced only one-fifth to one-quarter of the green jobs promised at its inception, and only one-twentieth based on the first three years of actual jobs data. The continued reliance of the agencies on estimates produced by advocacy groups promoting the subsidies rather than an independent analysis that looks at the trade-offs involved risks producing further examples of promises not matching results.
Preliminary California Estimates
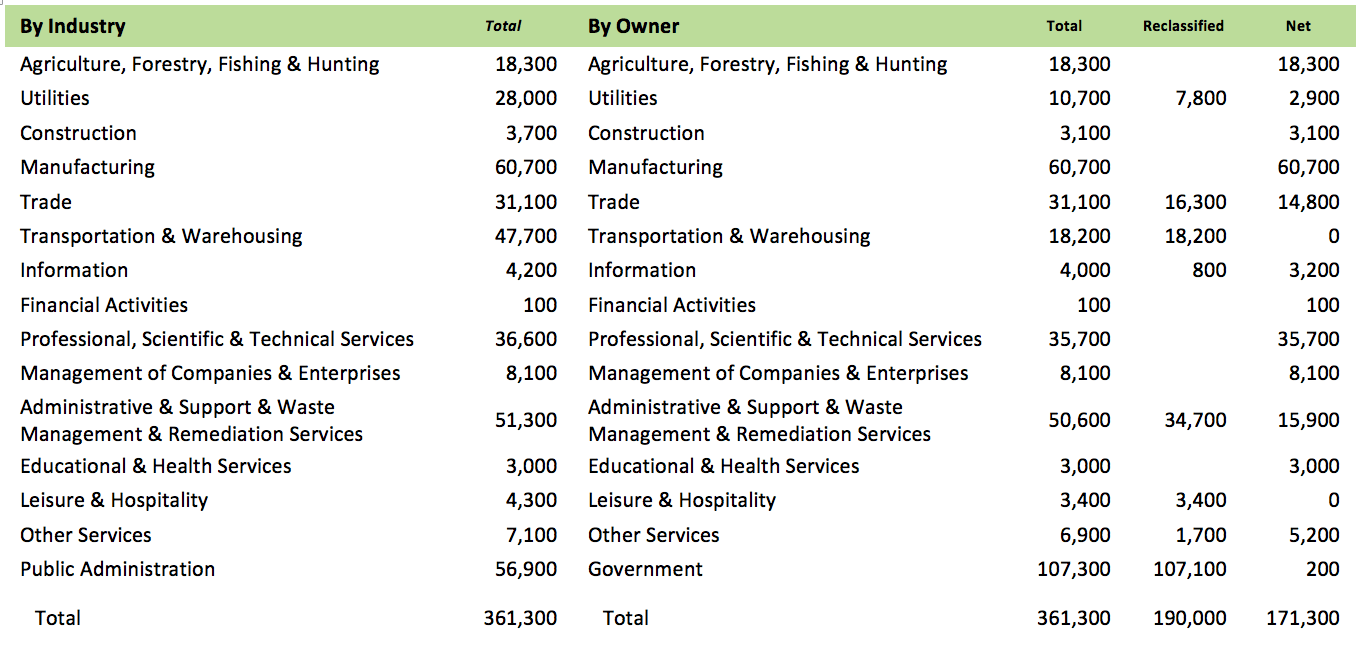
Based on preliminary estimates, there were 171,300 green/clean energy direct jobs in California in 2016, a total of 361,300 if existing government and other jobs are reclassified as green/clean energy as well. Based on the data, data sources, and methodologies—especially that used by US Bureau of Labor Statistics—contained in the prior quantification reports, a preliminary estimate by industry was developed and applied to the most recent complete Quarterly Census of Employment & Wages for California in 2016. In the table below, jobs are shown by industry, including both private and government jobs, in the first set of columns. The second set shows the estimated jobs by owner, with Government including all public jobs regardless of industry. The table also breaks out this second set to indicate which jobs represent essentially new industry components that have evolved in recent years (Net jobs) vs. those that substantially existed prior to the current state policy structure (Reclassified) such as jobs in public transit, solid waste, and other utilities.
Preliminary Estimate, California Green/Clean Energy Direct Jobs, 2016
To put these results into context:
- This direct job estimate is generally in line with the prior, comparable estimates. The combined level of 361,300 direct jobs represents 2.2% of total jobs in 2016.
- As indicated, reclassifying jobs as “green” remains a major component of the overall numbers, in this instance comprising 53% of the total. The net direct jobs that can be more clearly connected to current state policies represents only 1.0% of total jobs in 2016.
- Government jobs also remain a major determinant of overall green job levels, accounting for 30% of the total. Private green jobs at 254,000 in 2016 represent only 1.8% of all private jobs. Netting out the reclassified portion puts the figure at 1.2%.
Next steps will estimate the effect of green/clean energy job costs on net jobs levels. The primary purpose of this project is to produce a more current and transparent estimate of green jobs in the California economy. This report summarizes the background and steps used to create the preliminary estimate. This estimate will then be used as the base for the project’s subsequent steps: (1) validation and additional calibration of the estimate through an employer survey and (2) a more complete assessment of the jobs stemming from the underlying state policies through a net impact comparison of green jobs created by those policies vs. reduction in other jobs as a result of the costs of those policies.
What Is the Cost of Green Jobs?
Construction, compliance, energy, and subsidy costs will be used to assess the net job effects from the state’s policies. Without exception, the current green/clean energy job quantification reports only consider one side of the jobs equation. While relying on indirect jobs to augment their totals, none assess the indirect job losses associated with the costs of complying with the associated state policies credited with creating the green/clean energy jobs. Preliminary estimates of the main cost components that will be analyzed in the next steps of this project are:
- Clean energy construction and installation. The primary source of the jobs contained in the quantification reports is the 147 generation plants that finished or were under construction in 2016, along with 20 that were retired. Using the available cost factors, total estimated costs for the 147 was $11.8 billion, although not all this amount was expended in 2016. Related ongoing operations levels will be incorporated along with these one-time costs. Based on building permit data, photovoltaic installations accounted for another $2.0 billion in 2016.
- Electricity bills. California has long had electricity rates substantially above the average for the other states, but this difference has accelerated markedly since 2011 as the cost of renewables generation has been incorporated into the rate base. In 2016, the change in this cost difference produced higher electricity costs of $6.6 billion, distributed as $2.2 billion paid by residential users, $3.0 billion by commercial, and $1.3 billion by industrial. These costs had a greater relative impact on the lower income interior regions, which show electricity usage 50% to 60% above the higher income coastal areas.
- Fuel costs. While most cost estimates generally consider only the production cost differences stemming from the state’s regulations, the full impact on consumers and employers (public and private) stems both from this component and the continued isolation of the state’s fuel markets caused by those regulations that have produced periodic volatility in California prices. As measured by difference in average California and US prices (net of taxes), consideration of both factors shows additional costs of $7.5 billion in 2016: $4.5 billion to households and $3.0 billion to employers. Looking only at the production cost component, total costs are $4.7 billion of the total amount. As with electricity but not to the same extent currently, these costs are also borne to a somewhat larger degree by the interior regions compared to the higher income coastal areas.
- Compliance costs. In 2016, regulated facilities spent a total of $2.6 billion in the four cap and trade allowance auctions, of which $0.9 billion was paid for state allowances and $1.7 billion was paid to investor owned and publicly owned utilities. The portion attributable to in-state refineries is incorporated into the additional fuel payments discussed above, while portions paid by other industries would be a separate entry. In addition to these proceeds, the covered facilities spent additional, unknown amounts to reduce emissions—through process changes and controls or through shifting operations outside the state—and development of offset projects.
Cap and Trade revenues were allocated to an estimated $1.4 billion of programs in the state budget, with some overlap with the subsidy payments below.
The primary fees tacked onto consumer purchases to support the state’s recycling jobs totaled $1.5 billion in 2016, with a portion of the amount for containers paid in redemptions. In addition, households and employers also supported these activities through rising recycling fees on their periodic local garbage and utility bills for which there is no immediate estimate.
- Subsidy costs. In addition to the elements already included above, the direct subsidy costs that can be currently estimated are: $636.5 million for federal energy efficiency tax credit (solar tax credit is not available); state solar incentive payments at $53.0 million; Clean Vehicle Rebate Project payments at $101.3 million; associated ZEV subsidy from manufacturer sales of ZEV and CAFE credits at $150 – 200 million.
Several related costs are not included. The cost elements cover the primary job-creating policies that can be quantified. In so doing, however, there are a number of potential and actual costs that are not included, due to the difficulty of developing a cost estimate, lack of data, or the more qualitative nature of their impact.