A review of Current Estimates
The policy interest in Green Jobs is not new to California. For at least 4 decades, the growing body of regulation in our state continues to be justified in part for its potential to spark technology innovations and entrepreneurship that in turn lead to creation of new industries to offset in whole or in part the cost of those rules on both consumers and businesses. The concept behind this focus is that through broader adoption of California rules, economies of scale eventually will be achieved and thereby lower overall costs for all. This policy concept runs through California’s current climate change and energy policies just as it did earlier in the 1970s when the state first attempted to regulate its way to a broader reliance on alternative energies.
This growing policy emphasis on green jobs as the economic future of the state has led several groups to develop estimates of green jobs created to date and in some instances track their growth as well. This brief review summarizes several of these estimates, including their potential application in assessing current policy proposals as well as being an indicator of this policy focus to date.
California Employment Development Department
EDD conducted its Green Economy Survey beginning in May 2009 in collaboration with the Labor and Workforce Development Agency. The data was collected based on a survey of 51,000 businesses. The data covered private wage and salary jobs for companies with at least 25% of their workforce engaged in any of the following activities:
- Generating and storing renewable energy;
- Recycling existing materials;
- Energy efficient product manufacturing, distribution, construction, installation and maintenance;
- Education, compliance, and awareness;
- Natural and sustainable product manufacturing.
The study looked at total wage and salary jobs and was an effort to measure the total number of green jobs within the economy as opposed to the total number of green firms.
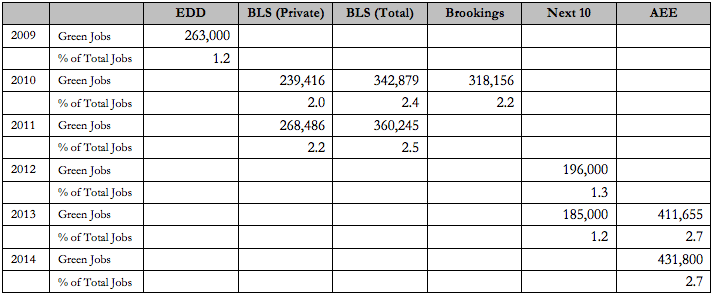
The study concluded that for the period May 2009 – January 2010, 7.9% of California businesses employed workers to produce green products or supply green services. A total of 263,000 workers spent 50% or more of their time on green activities, and 433,000 doing so at least part time.
A companion study also looked at whether green firms were growing at differential rates from non-green firms. The conclusion was that there was no discernable difference in the likelihood a business would grow faster from providing green goods and services:
The size and industry sector of the firm were the strongest predictors of net job gains during the study period. The results also showed no discernible difference in the likelihood that a green or non-green firm would experience a net job gain.
US Bureau of Labor Statistics
BLS developed estimates of employment related to the provision of green goods and services from a list of 325 detailed potential industries (6-digit NAICS). Data is available for 2010 and 2011 for both total (private and government) and private wage and salary jobs. This survey was eliminated as a cost-savings move following release of the 2011 numbers.
BLS Green Goods & Services Jobs
| 2010 | 2011 | |
| Private | 239,416 | 268,486 |
| Total | 342,879 | 360,245 |
Brookings Institution
Through their Sizing the Clean Economy project, Brookings Institution developed an establishment-based data base of firms providing green goods and services. Green definitions are largely consistent with the BLS. Rather than surveys, establishments were identified and employment tracked through the Dun & Bradstreet data.
While earlier versions of the web site provided county-level data for 2003 – 2010, the current information is limited to the 2010 results. Data is for total (private and government) wage and salary jobs. California is shown with a total of 318,156 clean economy jobs in 2010.
Next 10
Next 10 is an organization founded by Noel Perry to focus “on innovation and the intersection between the economy, the environment, and quality of life issues for all Californians.” Their Green Innovation Index has produced annual estimates of clean economy jobs based on the Brookings Institution methodology, and therefore largely consistent with the BLS estimates.
The Next 10 website generally provides graphs rather than data on the multi-year estimates, but the various annual reports available on this site provide annual totals. Data is for total (private and government) wage and salary jobs. The annual reports show California with a total of 196,000 jobs in 2013 and 185,000 in 2014.
Advanced Energy Economy
AEE has released one of the more recent estimates. AEE is an organization co-founded by Tom Steyer to make “the global energy system more secure, clean, and affordable.”
The AEE estimates were derived from a survey of 2000 advanced energy companies. Survey participants were identified from a list of NAICS industries potentially related to “renewable energy, energy efficiency, advanced fuel and advanced transportation segments.” The survey results were then extrapolated to estimate California’s advanced energy employment in 411,655 in 2013 and 431,800 in 2014 with 40,000 establishments. The report methodology is unclear as to whether government jobs are included in the estimates or whether the estimate is based solely on private jobs.
The AEE estimate is an outlier among the other green jobs results. This could be for a number of reasons:
- The AEE estimates includes “renewable, nuclear, and natural gas electricity generation,” in other words, California’s utility industry. Just 4 firms engaged in these technologies—PG&E, Edison International, Sempra, and Bechtel—alone represent 137,000 jobs or nearly a third of the report’s total. Also note that while the AEE estimate is now being used in conjunction with the state’s climate change and energy program, nuclear, natural gas, and some renewable (big hydro) jobs covered in the estimates are not eligible technologies under AB 32.
- Unlike all the other estimates, the AEE numbers include both direct and indirect jobs. Every other estimate is based on direct green goods and services jobs. The AEE estimates includes “supporting services such as consulting, finance, tax, and legal services related to advanced energy” and “producing, manufacturing, distributing, selling, or implementing components, goods or services related to alternative fuels and vehicles” In doing so, the report estimates assume these indirect jobs would have no market for their products in the absence of advanced energy.
- The AEE approach is based more heavily on surveys than some of the other studies. For example, the AEE report indicates the solar industry is the largest source of jobs, with a total of 73,000. Yet, BLS occupational data shows a total of 1,510 solar photovoltaic installers in California in May 2013. While not every employee of a solar firm is within this occupation, the scale suggests something lower.
Observations
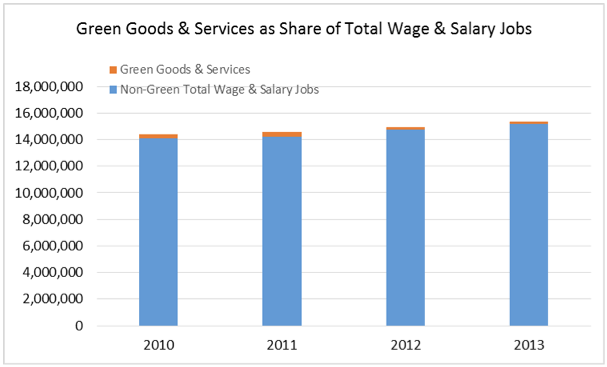
Even in the Broadest Definitions, Green Jobs Constitute a Small Portion of Total Jobs
The following table summarizes the data from above, showing the job estimate and the portion of total jobs each estimate represents (either percentage of total wage and salary jobs or portion of private jobs, as indicated above).

In general, most estimates peg green jobs at around 2% of the state’s total. And while green jobs will continue to contribute to resolving the state’s job creation challenges, they are not at a scale where they will do it alone. Policies addressing the competitiveness of the other 98% of the state’s jobs are needed as well.

All of the Estimates Rely on Reclassification of Traditional Jobs
All of the estimates shown above rely in part on redefining many traditional jobs as “green” jobs. This shift includes reclassification of public transit jobs and waste management and treatment (recycling is generally treated as a separate category). Like the AEE numbers, most estimates also include nuclear and hydro, which for the most part (some small hydro is the exception) are not eligible under AB 32. Most estimates also include government regulatory positions creating the regulations leading to the green jobs in the first place. As an indication of the importance of this factor, 34% of the Brookings estimates are based on the reclassification of these categories as green.
Other government positions fall under this category as well, including traditional positions for resource management. In all, 25-30% of the BLS total estimates are government rather than public jobs.
Many Green Jobs Continue to Rely on Subsidies
In addition to the government jobs within these estimates that rely on direct support from taxes and fees, many of the green jobs covered in these estimates continue to rely on subsidies draft from general public revenues or cost increases on many products such as electricity or cars. While some green products are economic in their own right—for example, recycling of aluminum and fiber for paper production—and still some others rely on market pricing based on green branding, many of the jobs identified in these estimates continue to rely on subsidies and regulatory fiats. Examples from these studies include:
- Most of the estimates show solar installation as the largest segment, yet a recent related study by Solar Foundation illustrates how much of this employment remains dependent on subsidies from the general taxpaying public. This survey indicates that should the 30% federal investment tax credit expire as scheduled at the end of 2016, “62% of installation firms and 60% of project developers expecting to shed workers.”
- The AEE study makes the observation that: “Perhaps surprisingly, relatively few firms (3%) reported that their customer base is outside of the United States, while 77% of firms reported that their customers are predominantly within California.” This result suggests rather than creating a new competitive industry, many green jobs companies within the state remain dependent on the specific regulatory structure created here.
These Estimates Only Represent Jobs Created by Regulation, Not Lost
Most green job estimates have been prepared in defense of various regulatory programs, but account only for jobs created as the regulations have been put into place. These estimates do not address the added costs on traditional job sectors to purchase the green goods and services when required under regulation, nor do they address jobs lost in this process.
While the regulatory approval process has been improved since the adoption of the SB 617 major regulations requirements, detailed consideration of the economic tradeoffs often remains lacking.
As an example, the economic impact analysis prepared for the state’s Green Chemistry regulations indicates job impacts cannot be assessed quantitatively, suggests there may be some job losses, but that the best the state can do is assess what goes wrong after the fact:
There are scenarios under which these regulations could cause unintended consequences that affect California producer profitability, worker employment prospects and the prices that California consumers pay for products they need on a daily basis.
. . . For establishments that shut down in California and reopen elsewhere, the DTSC could construct a mechanism to conduct an “exit interview” to learn about why the establishment made this decision.
