Key Highlights for Policy Makers:
- Unemployment Rate Down for April 2014
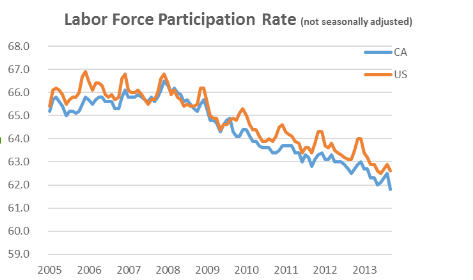
- Labor Force Participation Rate at Lowest Point in 38 Years
- Middle Class Jobs Still Behind
- Two-Tiered Economic Recovery Persists
Unemployment Rate Down for April 2014
Last week, the California Employment Development Department (EDD) reported the seasonally adjusted labor force statistics for April 2014 (California preliminary). The results show continued positive improvements in total employment in line with the national numbers, with the unemployment rate of 7.3% (not seasonally adjusted) the lowest it has been since June 2008. California’s unemployment rate remains 23% higher than the national rate, and is the 4th highest among the states, behind Michigan (7.3%), Nevada (7.3%), and Rhode Island (7.8%). While employment has increased and unemployed decreased, the labor force has remained virtually unchanged.
Change shown below is from April 2014 (seasonally adjusted):
The related not seasonally adjusted numbers (California preliminary), with the change from April 2013:
Labor Force Participation Rate at Lowest Point in 38 Years
The debate over growing income disparity in California1 has tended to focus on policies to address the results of this trend rather than the underlying economic changes that have led to this situation. Although California has significantly increased its pace of job creation over the past two years, the types and nature of the jobs created have contributed to this two-tier recovery. Other data in the latest unemployment report highlight three of these key underlying factors.
Middle Class Jobs Still Behind
Jobs growth (not seasonally adjusted) continued its positive trend over the past 12 months for most industries except Manufacturing, and Finance and Insurance.
2014 – Apr 2013 Change Apr
2014 – 2007 ave
However, jobs growth continues to be concentrated in the higher wage (Professional, Scientific and Technical Services) and lower
wage (Accommodation and Food Service) industries. About 12 percent of Total Nonfarm growth comes from Individual & Family Services, the industry containing the IHSS (In Home Supportive Services) employment numbers added by EDD in their March 2014 revision. Even with improvement in Construction, that middle class job sector remains 234,400 below the 2007 average of 892,600. Other industries still significantly below their 2007 pre-recession level are Manufacturing, Retail Trade, Information, Finance and Insurance, Real Estate and Rental and Leasing, and Government. Overall, Total Nonfarm jobs are now 15,600 above the 2007 pre-recession average.
In particular, income disparities not taking into account government transfer payments and changes in tax policy.
Labor Force Participation Rate at a 38-Year Low. California’s Labor Force Participation Rate (not seasonally adjusted) in April 2014 was 61.8%, the lowest rate since April 1976. While the significant drop from March 2014 suggests there are also statistical or sampling issues in play, this milestone is a stark reminder that California’s participation rate remains below the US average (62.6%), and like the US rate is currently on a decline.

This sustained decline in the labor force participation rate has been a statistical factor behind the improving unemployment numbers, but also reflects the perception of many potential job seekers on the opportunities available through the current economic mix. On a real life level, the number of employed—particularly in a high cost state like California—can quickly shift a household or family income between middle income and low income levels.
Part-Time Employed Remains High. While the percentage of employed who work part-time has continued to slowly decline to 18.0% in April 2014 (12-month moving average), the comparable number for California has remained at 20.6% for the past quarter, reflecting the fact that this factor remained level at a somewhat higher rate throughout 2013 as well. The number of workers employed part-time for economic reasons also remains higher in California—7.2% vs. 5.2% for the US in April 2014.
Two-Tier Economy Continues
Unemployment rates and employment (all data is not seasonally adjusted) continue to vary widely across the state. However, unemployment rates dropped in all regions:
