Highlights for policy makers:
- Unemployment Rate Declines to 6.3%; Total Employment Climbs 42,600
- Labor Force Participation Rate Remains at 62.3%, Matching Previous Low in 1976
- Nonfarm Jobs Increase 29,500
- 6 Industries Remain Below 2007 Pre-Recession Job Levels
- 10 Counties Remain in Double-Digit Unemployment, Down from 15 in March
- Two-Tier Economy Persists; Inland Empire Moves Up
Unemployment Rate Declines to 6.3%; Total Employment Climbs 42,600
The Labor Force data for April 2015 (seasonally adjusted; California preliminary) is shown below, along with the change from the prior month:
The related not seasonally adjusted numbers (California preliminary), with the change from April 2014:
California Employment Development Department’s (EDD) latest release shows on a seasonally adjusted basis, total employment grew by 42,600 from March, while the number of unemployed dropped by 25,200. California’s seasonally adjusted unemployment rate declined from 6.5% in March to 6.3% in April. The unadjusted rate decreased from 7.2% in April 2014 to 6.1% in April 2015.
Total US employment grew at a slightly lower rate (seasonally adjusted increase of 166,000), while the number of unemployed remained essentially level (seasonally adjusted decrease of 26,000).
For both California and the US, improvement in the unemployment rate continues to stem primarily from the shift in the status of the unemployed, as they have moved to the employed category or left the workforce. There has been little change in the overall labor force, and as discussed below, California’s labor force participation rate remains at 1976 levels.
California’s seasonally adjusted unemployment rate is 17% higher than the national rate. California’s ranking again improved slightly to be the 11th highest unemployment rate among the states.
Between April 2014 and April 2015, Bureau of Labor Statistics (BLS) data shows the total number of employed in California increased by 464,155 (seasonally adjusted). This increase was the highest among the states, ahead of Texas (224,688) and Florida (166,608).
Adjusted for working population size, California declined slightly to the 18th highest employment increase (15.3 additional employed per 1,000 Civilian Noninstitutional Population (Age 16+)), with Oklahoma (26.2 per 1,000 population), Massachusetts (23.1 per 1,000 population), and Delaware (22.8 per 1,000 population) in the leading slots.
Labor Force Participation Rate Remains at 62.3%, Matching Previous Low in 1976
California’s participation rate (seasonally adjusted) remained unchanged from March at 62.3%, the previous low last experienced in 1976. The comparable US rate improved slightly to 62.8%.
California’s persistently low participation rate is an indication the state still is not producing sufficient jobs at a wage rate sufficient to draw disengaged workers back into the labor force. This decline in the relative number of workers has an immediate effect on total household income, with its attendant effects on the ability of those households to afford California’s high housing, energy, and other costs of living.
Nonfarm Jobs Increase 29,500
EDD reported that between March and April 2015, seasonally adjusted nonfarm payroll jobs increased by 29,500.
Looking at the not seasonally adjusted numbers, the change in nonfarm payroll jobs from March 2015 saw the largest increases in Administrative & Support & Waste Services (13,400), Accommodation & Food Services (12,100), and Government (10,100). Declines were felt in Finance & Insurance (-2,900), Health Care & Social Assistance (-1,800), and Transportation, Warehousing & Utilities (-1,500). Total Farm jobs increased 60,000 for the month.
By total number of new jobs, California had the highest increase in seasonally adjusted Nonfarm jobs among the states from April 2014 to April 2015, at 457,300 or 16.3% of the US total. Texas had the second highest, with 287,000 Nonfarm jobs or 10.2% of the US total.
By percentage increase, California’s job growth rate of 2.9% over the year was the 8th highest among the states, behind Utah (4.0%), Washington (3.6%), Florida (3.6%), Nevada (3.4%) and Oregon (3.4%). The US average was 2.0%.
Adjusting for population, California’s job creation rate of 15.0 new jobs per 1,000 Civilian Noninstitutional Population age 16 and over (the available labor force population base) still exceeded the US average of 11.2. Among the states, California’s population adjusted growth rate was 11th largest.
6 Industries Remain Below 2007 Pre-Recession Job Levels
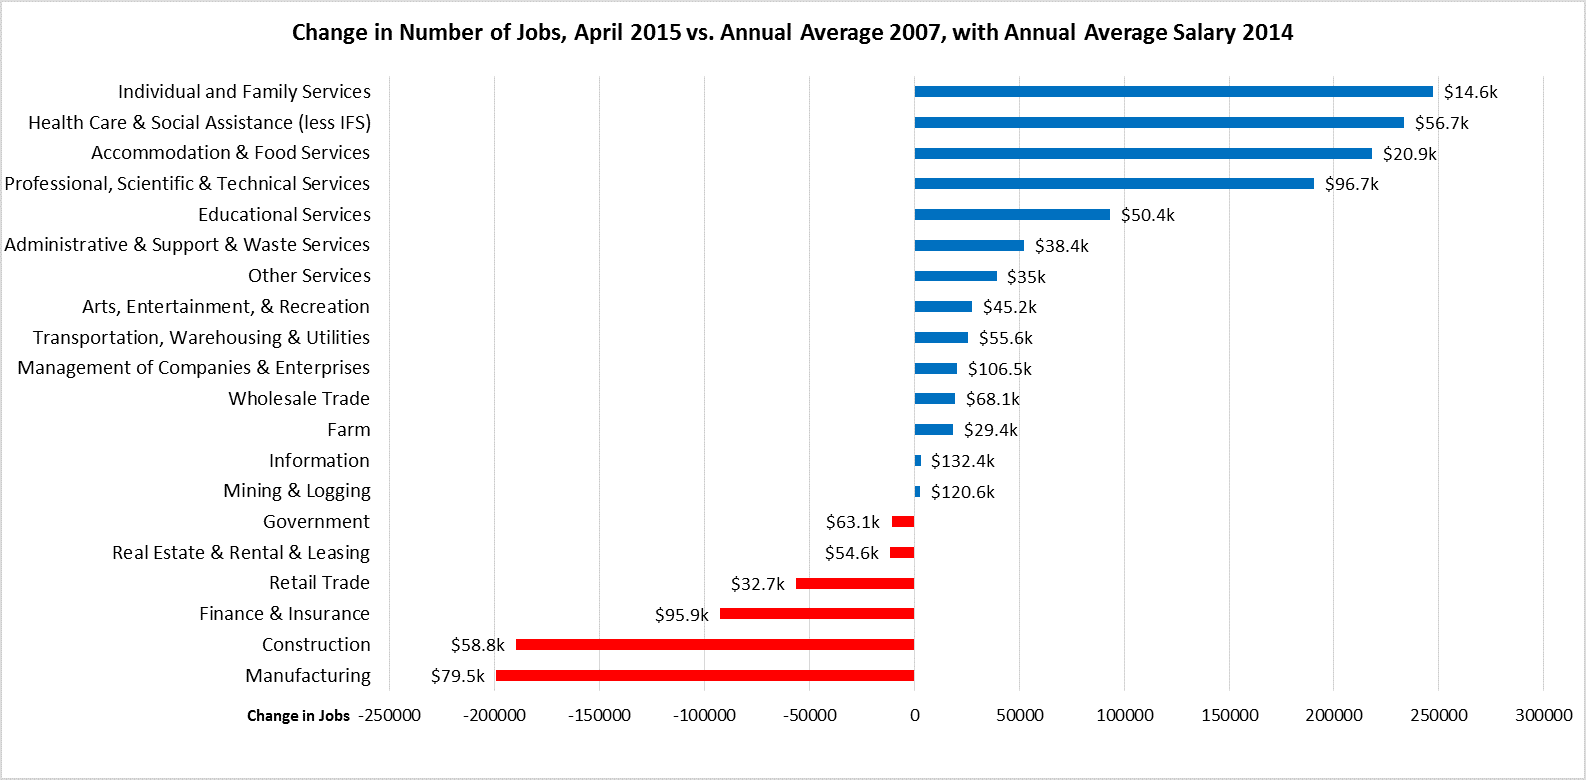
Comparing the number of jobs by industry in April 2015 (not seasonally adjusted), 6 industries remain below the 2007 pre-recession levels. Information moved into slightly positive numbers, as did Farm jobs due to seasonal hiring.
As indicated in the figure above, growth continues to be primarily in the lower wage and higher wage industries, with two of the top three growth industries paying well under $2,000 a month in average wages. The largest gaps remain in the middle class-wage industries of Manufacturing and Construction.
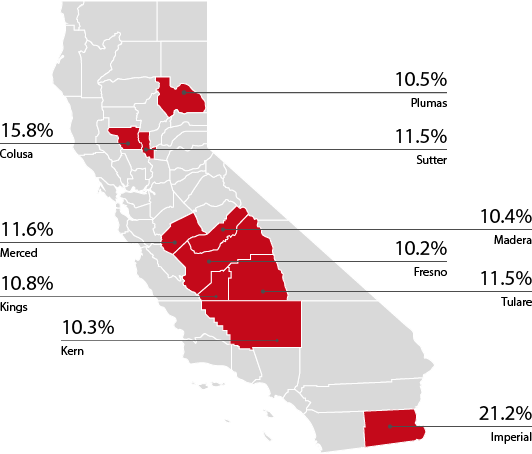
10 Counties Remain in Double-Digit Unemployment, Down from Revised 15 in March
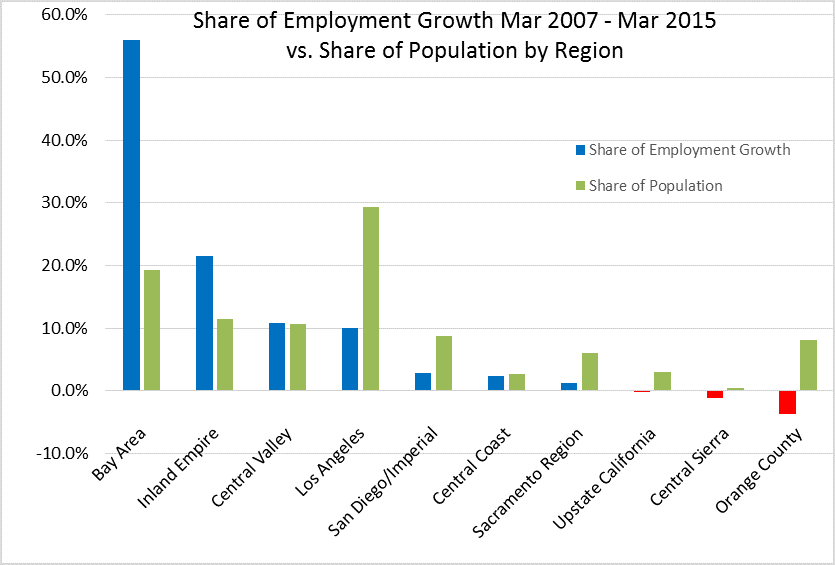
Two-Tier Economy Persists; Inland Empire Moves Up
Unemployment rates (all data is not seasonally adjusted) continue to vary widely across the state, ranging from 4.1% in the Bay Area to more than double at 10.2% in the Central Valley.
The Bay Area continues to dominate employment growth since the recession; with 19% of the state’s population, this region contains 56% of the net employment growth since April 2007. Los Angeles with 29% of the population remains with only 10% of the net employment growth. Inland Empire, however, continues to show stronger employment growth relative to its size, now accounting for 21.5% of net employment growth. Growth in the Inland Empire has been led by jobs in Health Care & Social Assistance (increase of 50,800 jobs since 2007), Accommodation & Food Services (18,200 jobs since 2007), and, as jobs continue to shift from higher-cost Los Angeles, in Transportation, Warehousing & Utilities (22,400 jobs since 2007).
By County:
Ratio of Highest to Lowest Rate: 6.63
By Legislative District:
Ratio of Highest to Lowest Rate: Senate 4.27
Ratio of Highest to Lowest Rate: Assembly 4.33
Note: All data sources, methodologies, and historical data series available at CenterforJobs.org.