Highlights for policy makers:
- Unemployment Rate Eases to 5.3%; Total Employment Rises 32,400
- State Employment Growth Rankings
- Labor Force Participation Rate Unchanged at 62.0%
- Nonfarm Jobs Increase 32,400
- Six Industries Below 2007 Pre-Recession Job Levels
- 8 Counties in Double-Digit Unemployment; 19 are 5% or Less
- Two-Tier Economy Persists
- 8 California MSAs in the 10 Worst Unemployment Rates Nationally
- Cost of Cost of Living Growing Faster in California
- County/Regional Employment by Industry Updates
Unemployment Rate Eases to 5.3%; Total Employment Rises 32,400
The Labor Force data for April 2016 (seasonally adjusted; California preliminary) is shown below, along with the change from the prior month:
| Seasonally Adjusted | California | US | ||
|---|---|---|---|---|
| Apr 2016 | Change from Mar 2016 | Apr 2016 | Change from Mar 2016 | |
| Unemployment Rate | 5.3 | -0.1 | 5.0 | 0.0 |
| Labor Force | 19,084,200 | 0.1% | 158,924,000 | -0.2% |
| Participation Rate | 62.0 | 0.0 | 62.8 | -0.2 |
| Employment | 18,070,900 | 0.2% | 151,004,000 | -0.2% |
| Unemployment | 1,013,400 | -0.7% | 7,920,000 | -0.6% |
The related not seasonally adjusted numbers (California preliminary), with the change from April 2015:
| Not Seasonally Adjusted | California | US | ||
|---|---|---|---|---|
| Apr 2016 | Change from Apr 2015 | Apr 2016 | Change from Apr 2015 | |
| Unemployment Rate | 5.2 | -1.0 | 4.7 | -0.4 |
| Labor Force | 19,015,100 | 0.4% | 158,488,000 | 1.2% |
| Participation Rate | 61.8 | -0.4 | 62.7 | 0.1 |
| Employment | 18,027,700 | 1.4% | 151,075,000 | 1.7% |
| Unemployment | 987,400 | -15.3% | 7,413,000 | -6.9% |
California Employment Development Department’s (EDD) latest release shows on a seasonally adjusted basis, total employment grew by 32,400 from March, while the number of unemployed declined slightly by 7,400. California’s seasonally adjusted unemployment rate continued to decline from 5.4% in March to 5.3% in April. The unadjusted rate decreased from 6.2% in April 2015 to 5.2% in April 2016.
Total US employment saw a seasonally adjusted drop of 316,000, while the number of unemployed decreased by 46,000. The US unemployment rate held at 5.0%.
State Employment Growth Rankings
| Rank | Number of Employed | Percentage Change | Population Adjusted (employment growth per 1,000 civilian noninstitutional population) |
|---|---|---|---|
| 1 | CA 355,079 | OR 6.0% | OR 34.5 |
| 2 | TX 255,615 | TN 4.7% | DE 27.2 |
| 3 | FL 252,883 | DE 4.6% | TN 26.3 |
| 4 | MI 170,330 | AR 4.5% | AR 24.5 |
| 5 | NY 170,280 | AZ 4.3% | AZ 23.9 |
| 6 | NC 141,785 | MI 3.8% | CO 21.8 |
| 7 | TN 135,771 | SC 3.4% | MI 21.7 |
| 8 | AZ 125,555 | CO 3.4% | DC 21.6 |
| 9 | GA 123,374 | DC 3.3% | SC 19.0 |
| 10 | IL 116,552 | MS 3.2% | IN 18.5 |
| 11 | OR 110,712 | NC 3.2% | NC 18.2 |
| 12 | NJ 101,797 | IN 3.1% | MO 18.0 |
| 13 | PA 100,715 | MO 2.9% | HI 16.9 |
| 14 | OH 97,570 | HI 2.8% | MS 16.6 |
| 15 | IN 94,456 | FL 2.8% | GA 15.9 |
| 16 | CO 91,957 | GA 2.8% | FL 15.6 |
| 17 | WA 86,328 | WA 2.6% | WA 15.4 |
| 18 | MO 85,362 | NJ 2.4% | NJ 14.4 |
| 19 | SC 72,447 | ID 2.3% | UT 14.2 |
| 20 | WI 61,183 | UT 2.2% | ID 14.0 |
| 21 | MN 57,786 | WI 2.1% | MN 13.5 |
| 22 | AR 56,173 | NV 2.1% | WI 13.4 |
| 23 | MD 53,266 | TX 2.1% | TX 12.5 |
| 24 | MA 40,419 | CA 2.0% | NV 12.2 |
| 25 | MS 37,915 | MN 2.0% | CA 11.7 |
| 26 | AL 35,935 | IL 1.9% | IL 11.6 |
| US 2,495,000 | US 1.7% | US 9.9 |
Between April 2015 and April 2016, Bureau of Labor Statistics (BLS) data shows the total number of employed in California increased by 355,079 (seasonally adjusted), or 14.2% of the total net employment gains in this period for the US. Measured by percentage change in employment over the year, California was 24th highest. Adjusted for population, California ranked 25th. While California remains the leading state when measured by total change in employment, the recent data revisions continue to show a marked drop when ranked by percentage change or change relative to population.
Labor Force Participation Rate Unchanged at 62.0%
California’s participation rate (seasonally adjusted) remained unchanged from March 2016 at 62.0%. The comparable US rate dropped 0.2% to 62.8%.
California’s seasonally adjusted labor force participation rate continues to remain below the previous lows recorded in 1976. The revised labor force data shows the participation rate has remained essentially level at this low point since August 2015, alternating between 61.9% and 62.0% during this period.
Nonfarm Jobs Increase 32,400
EDD reported that between March and April 2016, seasonally adjusted nonfarm payroll jobs increased by 32,400. The March job gains were revised upwards to 5,200 from the preliminary estimate of 4,200.
Looking at the not seasonally adjusted numbers, hiring saw increases in all but 3 industries. The change in total payroll jobs from March 2016 saw the largest increases in Farm (56,000) as seasonal hiring increased, Accommodation & Food Services (17,800), and Construction (16,500). Declines were in Information (-500), Healthcare & Social Services (-1,900), and its sub-industry Individual & Family Services (-5,000).
| Not Seasonally Adjusted Payroll Jobs | Mar 2016 | Apr 2016 | Change Apr 2016 – Mar 2016 | Change Apr 2016 – Apr 2015 |
|---|---|---|---|---|
| Total Farm | 368,700 | 424,700 | 56,000 | -900 |
| Mining & Logging | 24,700 | 25,200 | 500 | -4,300 |
| Construction | 740,000 | 756,500 | 16,500 | 50,400 |
| Manufacturing | 1,276,800 | 1,277,900 | 1,100 | -3,900 |
| Wholesale Trade | 733,500 | 735,400 | 1,900 | 19,400 |
| Retail Trade | 1,660,500 | 1,664,500 | 4,000 | 36,100 |
| Transportation, Warehousing & Utilities | 556,100 | 557,100 | 1,000 | 17,100 |
| Information | 494,500 | 494,000 | -500 | 14,000 |
| Finance & Insurance | 527,400 | 527,900 | 500 | 4,900 |
| Real Estate & Rental & Leasing | 274,500 | 279,100 | 4,600 | 9,800 |
| Professional, Scientific & Technical Services | 1,237,700 | 1,247,700 | 10,000 | 44,100 |
| Management of Companies & Enterprises | 233,500 | 234,400 | 900 | 5,400 |
| Administrative & Support & Waste Services | 1,053,400 | 1,064,300 | 10,900 | 33,100 |
| Educational Services | 374,400 | 377,800 | 3,400 | 18,600 |
| Health Care & Social Assistance | 2,166,000 | 2,164,100 | -1,900 | 75,000 |
| Individual & Family Services | 590,900 | 585,900 | -5,000 | 22,100 |
| Arts, Entertainment, & Recreation | 292,900 | 301,200 | 8,300 | 15,700 |
| Accommodation & Food Service | 1,567,100 | 1,584,900 | 17,800 | 55,200 |
| Other Services | 547,900 | 552,200 | 4,300 | 7,600 |
| Government | 2,538,900 | 2,546,600 | 7,700 | 54,200 |
| Total Nonfarm | 16,299,800 | 16,390,800 | 91,000 | 452,400 |
| Total Wage & Salary | 16,668,500 | 16,815,500 | 147,000 | 451,500 |
By total number of new jobs, California had the highest increase in seasonally adjusted nonfarm jobs among the states from April 2014 to April 2015, at 450,200 or 16.7% of the US net increase. By percentage growth in jobs, California was 10th highest, and by population adjusted jobs growth, 12th highest.
| Rank | Number of Jobs | Employment Growth (%) | Population Adjusted (job growth per 1,000 civilian noninstitutional population) |
|---|---|---|---|
| 1 | CA 450,200 | ID 3.8% | DE 22.0 |
| 2 | FL 254,500 | DE 3.7% | UT 21.5 |
| 3 | TX 189,600 | OR 3.5% | DC 21.0 |
| 4 | GA 140,800 | UT 3.4% | ID 20.4 |
| 5 | NY 133,500 | WA 3.3% | OR 19.1 |
| 6 | WA 104,900 | GA 3.3% | WA 18.4 |
| 7 | MI 104,500 | FL 3.2% | GA 17.9 |
| 8 | NC 95,600 | AZ 3.1% | TN 16.1 |
| 9 | TN 83,800 | TN 2.9% | CO 15.7 |
| 10 | VA 83,400 | CA 2.8% | FL 15.4 |
| 11 | AZ 81,400 | CO 2.7% | AZ 15.2 |
| 12 | MA 73,500 | SC 2.7% | CA 14.6 |
| 13 | OH 71,900 | NV 2.6% | NV 14.4 |
| 14 | CO 67,700 | MI 2.5% | SC 13.8 |
| 15 | IL 67,500 | NC 2.3% | MA 13.3 |
| 16 | NJ 63,900 | VA 2.2% | MI 13.2 |
| 17 | OR 62,300 | MA 2.1% | VA 12.7 |
| 18 | MD 55,900 | MD 2.1% | NC 12.1 |
| 19 | PA 55,000 | AR 2.1% | MD 11.8 |
| 20 | SC 53,200 | HI 2.0% | VT 11.6 |
| US 2,692,000 | US 1.9% | US 10.6 |
Six Industries Below 2007 Pre-Recession Job Levels
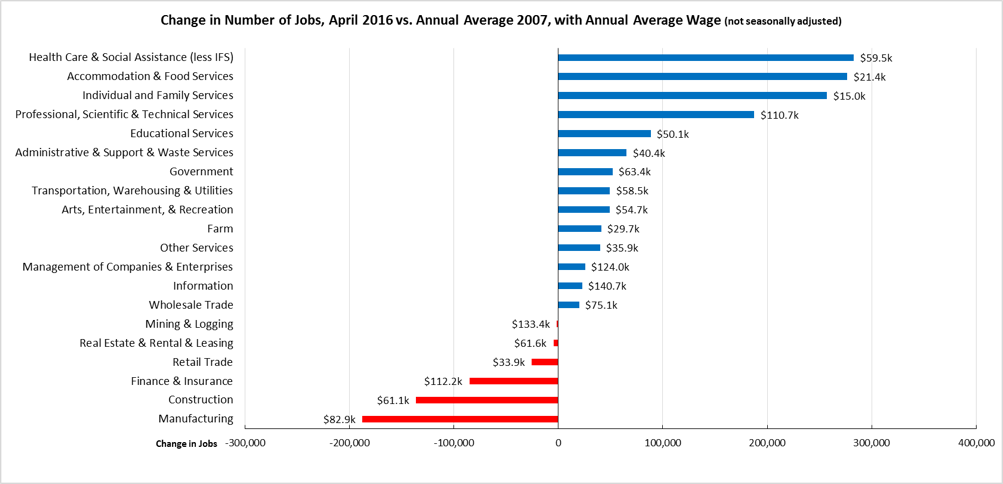
Comparing the number of jobs by industry in April 2016 (not seasonally adjusted), six industries showed employment below the 2007 pre-recession levels as Farm hiring moved into its seasonal increase. In the highest gain industries, Health Care & Social Assistance (less Individual & Family Services) remained the leading industry, followed by the two lowest wage industries in 2nd and 3rd place. The highest wage blue collar industry—Mining & Logging—remained in negative territory as oil prices remained low.
8 Counties in Double-Digit Unemployment, 19 are 5% or Less


Two-Tier Economy Persists
Unemployment rates (all data is not seasonally adjusted) continue to vary widely across the state, ranging from 3.8% in the Bay Area to more than double at 9.8% in the Central Valley.
| Not Seasonally Adjusted | Unemployment Rate (%) April 2016 |
|---|---|
| California | 5.2 |
| Bay Area | 3.8 |
| Orange County | 3.9 |
| Los Angeles | 4.7 |
| Sacramento Region | 5.1 |
| San Diego/Imperial | 5.3 |
| Inland Empire | 5.6 |
| Central Sierra | 5.9 |
| Central Coast | 6.6 |
| Upstate California | 7.2 |
| Central Valley | 9.8 |
By Legislative District:
| Lowest 10 Unemployment Rates | |||||
|---|---|---|---|---|---|
| CD 12 (Pelosi – D) | 2.9 | SD 13 (Hill – D) | 2.8 | AD 22 (Mullin – D) | 2.7 |
| CD 18 (Eshoo – D) | 3.1 | SD 11 (Leno – D) | 3.2 | AD 16 (Baker – R) | 2.7 |
| CD 45 (Walters – R) | 3.1 | SD 37 (Moorlach – R) | 3.3 | AD 24 (Gordon – D) | 2.9 |
| CD 14 (Speier – D) | 3.2 | SD 26 (Allen – D) | 3.4 | AD 28 (Low – D) | 3.0 |
| CD 52 (Peters – D) | 3.3 | SD 39 (Block – D) | 3.6 | AD 17 (Chiu – D) | 3.2 |
| CD 33 (Lieu – D) | 3.3 | SD 36 (Bates – R) | 3.7 | AD 19 (Ting – D) | 3.2 |
| CD 17 (Honda – D) | 3.3 | SD 25 (Liu – D) | 3.8 | AD 66 (Hadley – R) | 3.2 |
| CD 27 (Chu – D) | 3.5 | SD 15 (Beall – D) | 3.8 | AD 74 (Harper – R) | 3.2 |
| CD 48 (Rohrabacher – R) | 3.7 | SD 07 (Glazer – D) | 3.9 | AD 77 (Maienschein – R) | 3.3 |
| CD 39 (Royce – R) | 3.8 | SD 32 (Mendoza – D) | 3.9 | AD 73 (Brough – R) | 3.3 |
| Highest 10 Unemployment Rates | |||||
|---|---|---|---|---|---|
| CD 03 (Garamendi – D) | 6.6 | SD 21 (Runner – R) | 5.6 | AD 12 (Olsen – R) | 7.5 |
| CD 01 (LaMalfa – R) | 6.6 | SD 31 (Roth – D) | 5.7 | AD 03 (Gallagher – R) | 8.0 |
| CD 20 (Farr – D) | 7.4 | SD 20 (Leyva – D) | 5.8 | AD 23 (Patterson – R) | 8.6 |
| CD 09 (McNerney – D) | 7.6 | SD 04 (Nielsen – R) | 6.6 | AD 34 (Grove – R) | 8.7 |
| CD 10 (Denham – R) | 8.4 | SD 05 (Galgiani – D) | 8.1 | AD 13 (Eggman – D) | 8.7 |
| CD 23 (McCarthy – R) | 9.0 | SD 08 (Berryhill – R) | 8.1 | AD 26 (Mathis – R) | 10.6 |
| CD 22 (Nunes – R) | 9.1 | SD 40 (Hueso – D) | 8.8 | AD 31 (Arambula – D) | 11.0 |
| CD 51 (Vargas – D) | 10.3 | SD 16 (Fuller – R) | 8.8 | AD 21 (Gray – D) | 11.1 |
| CD 16 (Costa – D) | 11.0 | SD 12 (Cannella – R) | 9.6 | AD 56 (Garcia – D) | 11.7 |
| CD 21 (Valadao – R) | 11.8 | SD 14 (Vidak – R) | 12.5 | AD 32 (Salas – D) | 12.5 |
8 California MSAs in the 10 Worst Unemployment Rates Nationally
While employment continues to improve in parts of the state, other portions of California continue to experience some of the worst unemployment rates in the nation. Of the 10 Metropolitan Statistical Areas (MSAs) with the worst unemployment rates nationally, 8 are in California. Of the 20 worst, 12 are in California.
| US Rank | MSA | Mar 2016 Unemployment Rate |
|---|---|---|
| 368 | Vineland-Bridgeton, NJ Metropolitan Statistical Area | 8.1 |
| 369 | Danville, IL Metropolitan Statistical Area | 8.4 |
| 370 | Santa Cruz-Watsonville, CA Metropolitan Statistical Area | 8.8 |
| 370 | Stockton-Lodi, CA Metropolitan Statistical Area | 8.8 |
| 370 | Wheeling, WV-OH Metropolitan Statistical Area | 8.8 |
| 373 | Beckley, WV Metropolitan Statistical Area | 8.9 |
| 374 | Yakima, WA Metropolitan Statistical Area | 9.1 |
| 375 | Weirton-Steubenville, WV-OH Metropolitan Statistical Area | 9.2 |
| 376 | Modesto, CA Metropolitan Statistical Area | 9.6 |
| 377 | Madera, CA Metropolitan Statistical Area | 10.5 |
| 377 | Salinas, CA Metropolitan Statistical Area | 10.5 |
| 379 | Fresno, CA Metropolitan Statistical Area | 10.6 |
| 380 | Yuba City, CA Metropolitan Statistical Area | 11.0 |
| 381 | Hanford-Corcoran, CA Metropolitan Statistical Area | 11.4 |
| 382 | Bakersfield, CA Metropolitan Statistical Area | 11.6 |
| 383 | Visalia-Porterville, CA Metropolitan Statistical Area | 12.4 |
| 384 | Merced, CA Metropolitan Statistical Area | 12.5 |
| 385 | Ocean City, NJ Metropolitan Statistical Area | 13.3 |
| 386 | Yuma, AZ Metropolitan Statistical Area | 13.8 |
| 387 | El Centro, CA Metropolitan Statistical Area | 18.6 |
Cost of Living Growing Faster in California
As measured by the consumer price index (CPI-U, all urban consumers, not seasonally adjusted), the cost of living has been rising faster in California over the past year than in the US as whole. The chart below compares the two rates, measured as the running 12 month percentage change.
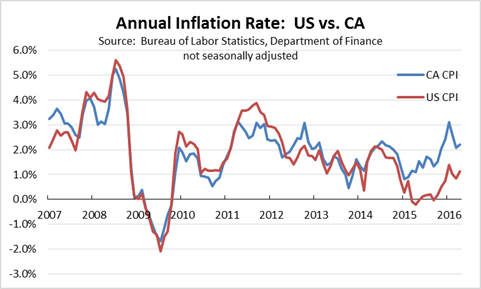
The higher costs in California have been led by fuel & utilities, apparel, medical care, recreation, shelter (rent and homeowners’ rent equivalent), and food & beverages. Changes below the US average have been experienced in other goods & services, transportation, and education & communications.
The California CPI is not directly measured by the US Bureau of Labor Statistics. Instead, it is a composite measure formed by combining the data for Los Angeles-Riverside-Orange County and San Francisco-Oakland-San Jose MSAs using a formula developed by California Department of Industrial Relations.
County/Regional Employment by Industry Updates
The Data Tool now has the 2015 Q3 updates for employment and wages by industry for the state, counties, and regions.
Note: All data sources, methodologies, and historical data series available at CenterforJobs.org.