Download April 2019 Jobs Report
Highlights for policy makers:
- Unemployment Unchanged at 4.3%; Employment Down 49,400
- Labor Force Participation Rate Dips to 62.6%
- Labor Force by Age
- Employment Growth Ranking—California Dips to 2nd
- Nonfarm Jobs Up 46,000 for Month; California Remains Ranked #2 for 12-month Gain
- Jobs Change by Industry
- Structural Shifts in State’s Economy
- Unemployment Rates by Region
- Unemployment Rates by Legislative District
- Employment Growth by Region
- MSAs with the Worst Unemployment Rates
- Chart of the Month: California Needs 180,000 New Housing Units Each Year Just to Keep Up with Population Growth — They’re Being Built in Texas
Unemployment Unchanged at 4.3%; Employment Down 49,400
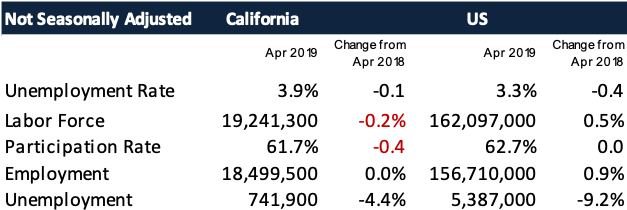
EDD reported total employment (seasonally adjusted; April preliminary) was down 49,400 from the revised March numbers, while the number of unemployed dipped 2,900. Unemployment rate rose to 4.3%. The unadjusted rate was down 0.1 point from the year earlier to 3.9%.
California had the 10th highest unemployment rate.
Total US employment saw a seasonally adjusted drop of 103,000, with the number of unemployed dropping 387,000. The unemployment rate improved to 3.6%, the lowest monthly rate since 1966.
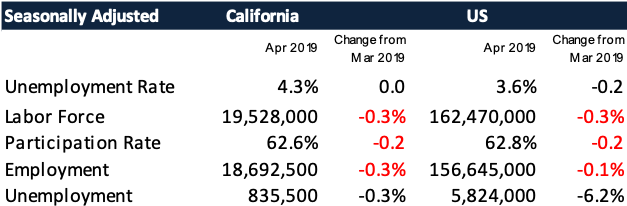
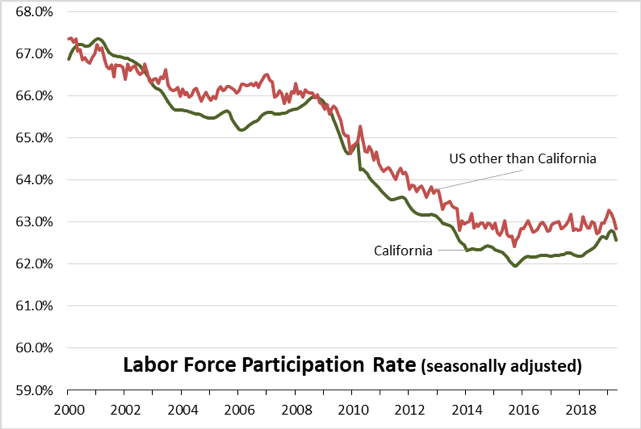
Labor Force Participation Rate Dips to 62.6%
After 18 months of gradual improvement, California’s seasonally adjusted labor force participation rate dipped to 62.6%. Nationally, the participation rate dipped by the same amount to 62.8%. Although the gap has narrowed, the state continues to experience lower than average participation rates in spite of having a relatively younger population than the rest of the US.
For the 12 months ending April 2019, the seasonally adjusted data shows the California labor force grew 1.1% compared to the rest of the US at 0.5%.
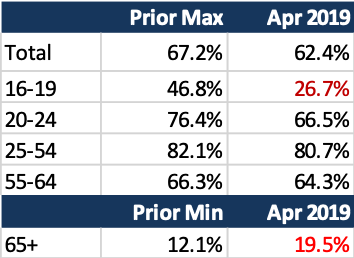
Labor Force by Age
Labor force participation by age (12-month running average) grew for all groups except seniors and youth. The continued low rates for youth and young adults in particular have implications for life-time earnings potential due to the delay in acquiring essential workplace skills. While more people are working past age 65, these gains do not offset the sharp drops in the youngest groups and softness in the prime working age groups.
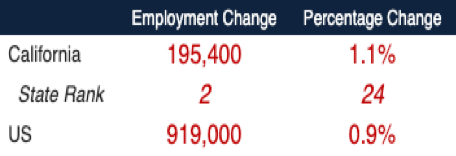
Employment Growth Ranking—California Dips to 2nd
Over the 12 months ending in April, the total number of persons employed (seasonally adjusted) grew by 195,400. California dipped to 2nd place behind Texas, which saw an additional 246,700 persons employed over this period.
Based on percentage growth, California had a 1.1% expansion in employment, above the average for the rest of the US at 0.9%. Ranked among the states, California’s growth rate dropped to 24th place, while Arizona continued to lead at 3.0%.
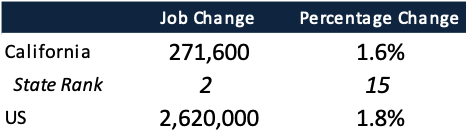
Nonfarm Jobs Up 46,000 for Month; California Remains Ranked #2 for 12-month Gain
Nonfarm jobs (seasonally adjusted) were up 46,000 from March. March’s gains were revised to 28,500 from the previously reported 20,900.
For the 12 months ending April, total jobs growth was 271,600, keeping the state in 2nd place behind Texas which gained 294,200 jobs in this period, with Florida at third with 260,100.
On a percentage basis, California edged up to 15th among the states, with a 12-month jobs growth rate of 1.6% vs. the US average of 1.8%.
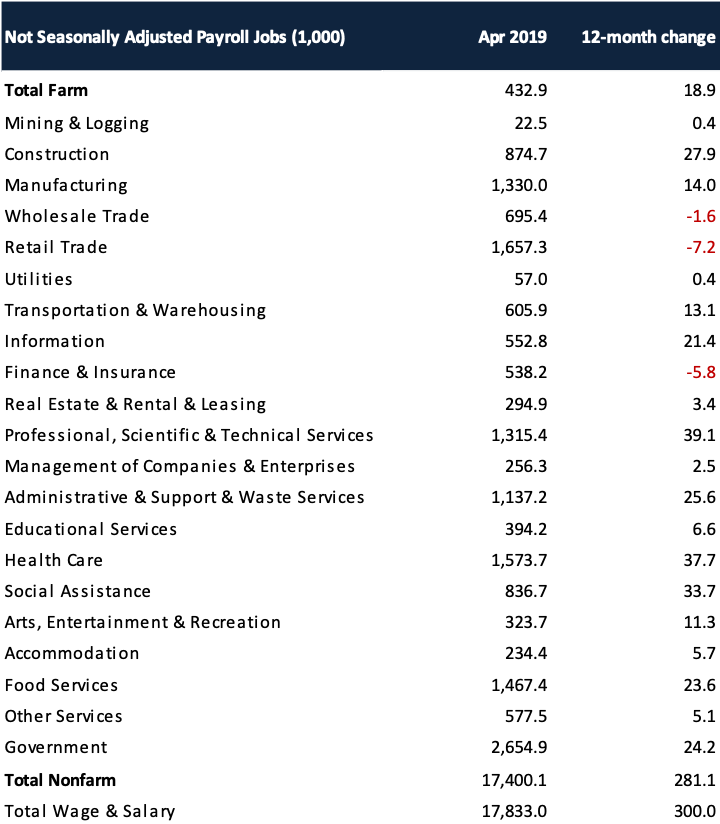
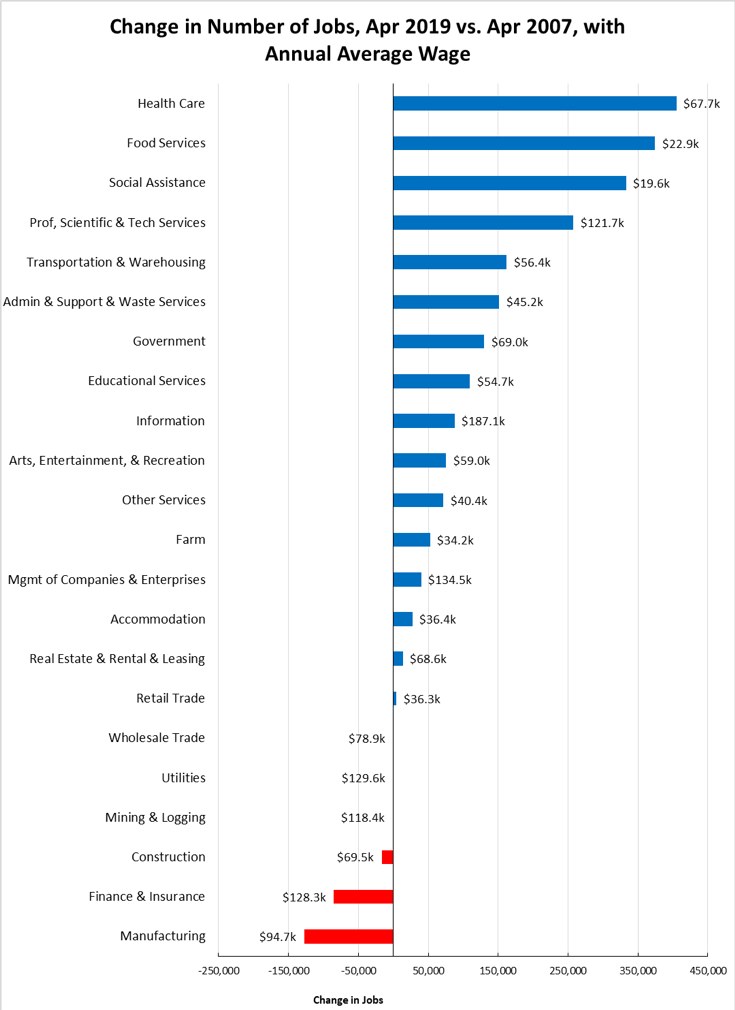
Jobs Change by Industry
In the unadjusted numbers that allow a more detailed look at industry shifts, hiring saw increases in all but 3 industries over the year.
Gains in payroll jobs were led by Professional, Scientific & Technical Services ($121.7k average annual wages), Health Care ($67.7k), and Social Assistance ($19.6k).
Declines were led by Retail Trade ($36.3k), Finance & Insurance ($128.3k), and Wholesale Trade ($78.9k).
All wage data is from the most current 4-quarter average from the Quarterly Census of Employment & Wages.
Structural Shifts in State’s Economy
Comparing current job numbers to the pre-recession levels in 2007 illustrates the structural shift in the state’s economy, with the primary jobs growth occurring in the higher and lower wage industries.
Jobs growth within the traditional middle class wage—especially blue collar industries such as Manufacturing, Construction, and Mining & Logging—continues to lag with the heavily blue collar Utilities beginning to show shrinkage as well. After stronger gains during the recovery, both Wholesale and Retail Trade have shown weakness in recent months, reflecting competitive pressures from nontraditional channels as well as greater use of technology in response to growing costs for labor, energy, rent, and regulation. Finance & Insurance also continues to lose ground.
Construction has gained in the past year as activity has picked up. While improving, construction jobs remain 45,100 below the 2007 peak and 91,600 (9%) below the pre-recession high in 2006. Over half (vs. 2007) to one-third (2006) of these gaps are due to reduced activity in Residential Building Construction.
Unemployment Rates by Region
| California | 3.9 |
| Bay Area | 2.5 |
| Orange County | 2.6 |
| Sacramento | 3.5 |
| San Diego/Imperial | 3.5 |
| Inland Empire | 3.7 |
| Los Angeles | 3.9 |
| Central Sierra | 4.0 |
| Central Coast | 5.4 |
| Upstate California | 5.7 |
| Central Valley | 7.7 |
Unemployment Rates by Legislative District
| Lowest 10 Unemployment Rates | |||||
|---|---|---|---|---|---|
| CD12 (Pelosi-D) | 1.9 | SD13 (Hill-D) | 1.8 | AD22 (Mullin-D) | 1.7 |
| CD18 (Eshoo-D) | 2.0 | SD11 (Wiener-D) | 2.1 | AD16 (Bauer-Kahan-D) | 1.8 |
| CD14 (Speier-D) | 2.1 | SD36 (Bates-R) | 2.3 | AD24 (Berman-D) | 1.9 |
| CD17 (Khanna-D) | 2.2 | SD37 (Moorlach-R) | 2.3 | AD28 (Low-D) | 2.0 |
| CD15 (Swalwell-D) | 2.2 | SD39 (Atkins-D) | 2.4 | AD17 (Chiu-D) | 2.0 |
| CD52 (Peters-D) | 2.3 | SD10 (Wieckowski-D) | 2.4 | AD25 (Chu-D) | 2.2 |
| CD49 (Levin-D) | 2.3 | SD15 (Beall-D) | 2.5 | AD19 (Ting-D) | 2.2 |
| CD45 (Porter-D) | 2.4 | SD07 (Glazer-D) | 2.5 | AD78 (Gloria-D) | 2.2 |
| CD48 (Rouda-D) | 2.4 | SD34 (Umberg-D) | 2.8 | AD73 (Brough-R) | 2.3 |
| CD19 (Lofgren-D) | 2.7 | SD38 (Jones-R) | 2.9 | AD74 (Petrie-Norris-D) | 2.3 |
| Highest 10 Unemployment Rates | |||||
|---|---|---|---|---|---|
| CD01 (LaMalfa-R) | 5.1 | SD21 (Wilk-R) | 4.5 | AD64 (Gipson-D) | 5.5 |
| CD09 (McNerney-D) | 5.4 | SD30 (Mitchell-D) | 4.8 | AD03 (Gallagher-R) | 6.3 |
| CD44 (Barragan-D) | 5.5 | SD04 (Nielsen-R) | 4.9 | AD23 (Patterson-R) | 6.4 |
| CD10 (Harder-D) | 5.9 | SD35 (Bradford-D) | 5.0 | AD13 (Eggman-D) | 6.6 |
| CD20 (Panetta-D) | 6.3 | SD05 (Galgiani-D) | 5.8 | AD34 (Fong-R) | 6.8 |
| CD51 (Vargas-D) | 7.3 | SD08 (Borgeas-R) | 5.9 | AD56 (Garcia-D) | 8.3 |
| CD23 (McCarthy-R) | 7.3 | SD40 (Hueso-D) | 6.2 | AD21 (Gray-D) | 8.4 |
| CD22 (Nunes-R) | 7.4 | SD16 (Grove-R) | 6.9 | AD31 (Arambula-D) | 9.2 |
| CD16 (Costa-D) | 9.0 | SD12 (M.Caballero-D) | 7.8 | AD26 (Mathis-R) | 9.6 |
| CD21 (Cox-D) | 9.7 | SD14 (Hurtado-D) | 10.7 | AD32 (Salas-D) | 9.9 |
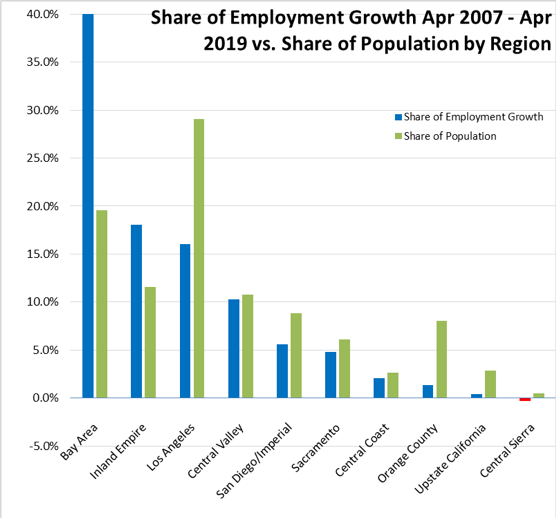
Employment Growth by Region
Containing 19.6% of the state’s population, the Bay Area has accounted for 41.6% of net employment growth compared to pre-recession levels. Los Angeles Region, with 29.1% of the population, accounted for only 16.1% of net employment gains, while Inland Empire continues to occupy the number 2 slot.
MSAs with the Worst Unemployment Rates
Of the 20 Metropolitan Statistical Areas (MSAs) with the worst unemployment rates in March 2018, 12 are in California, including El Centro MSA (Imperial County) with the highest unemployment rate in the country and Visalia-Porterville MSA (Tulare County) tied with Yuma, AZ for second worst.
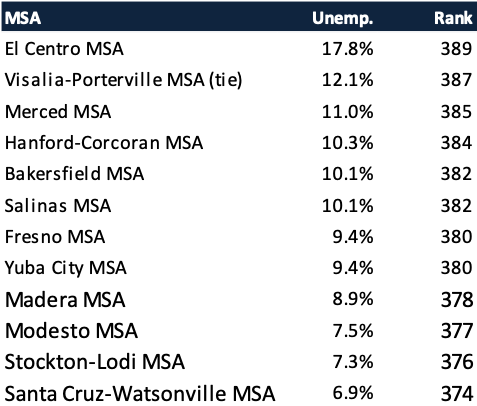
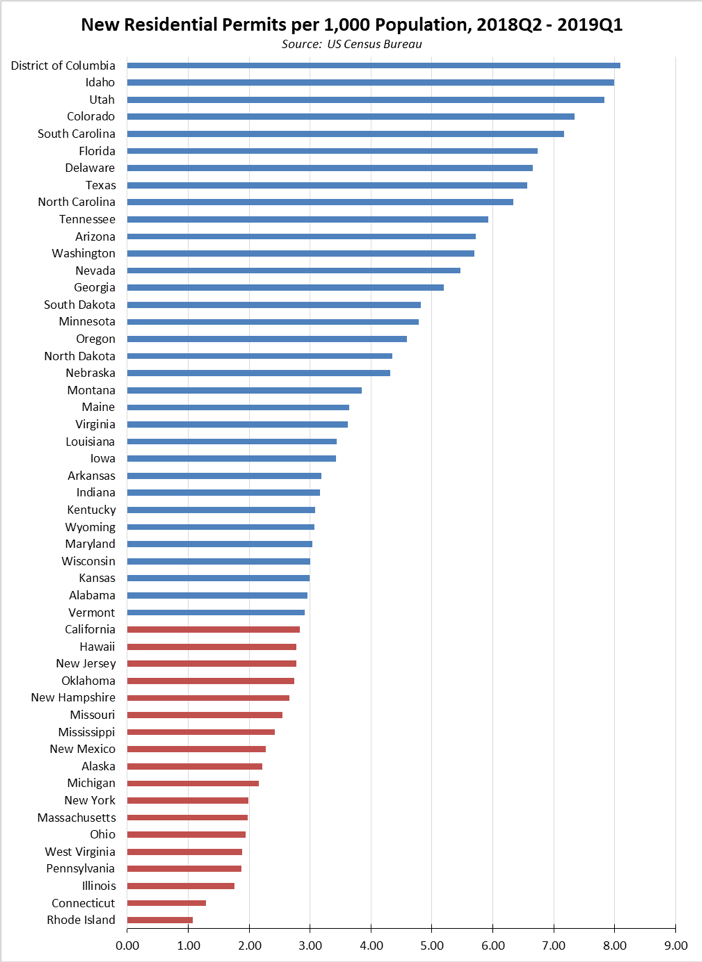
Chart of the Month: California Needs 180,000 New Housing Units Each Year Just to Keep Up with Population Growth — They’re Being Built in Texas
Based on the housing plans developed by the Department of Housing & Community Development, California since 2015 has needed 180,000 new housing units each year just to keep up with population growth. Prior to 2015, 200,000 new units a year were needed. These levels are what was needed simply to keep the housing supply from getting worse and does not begin to enable the state’s supply to recover from construction shortfalls in every year save one since 1990. This continue lag in supply additions relative to growing population demand has been the primary factor producing the state’s rising costs for housing.
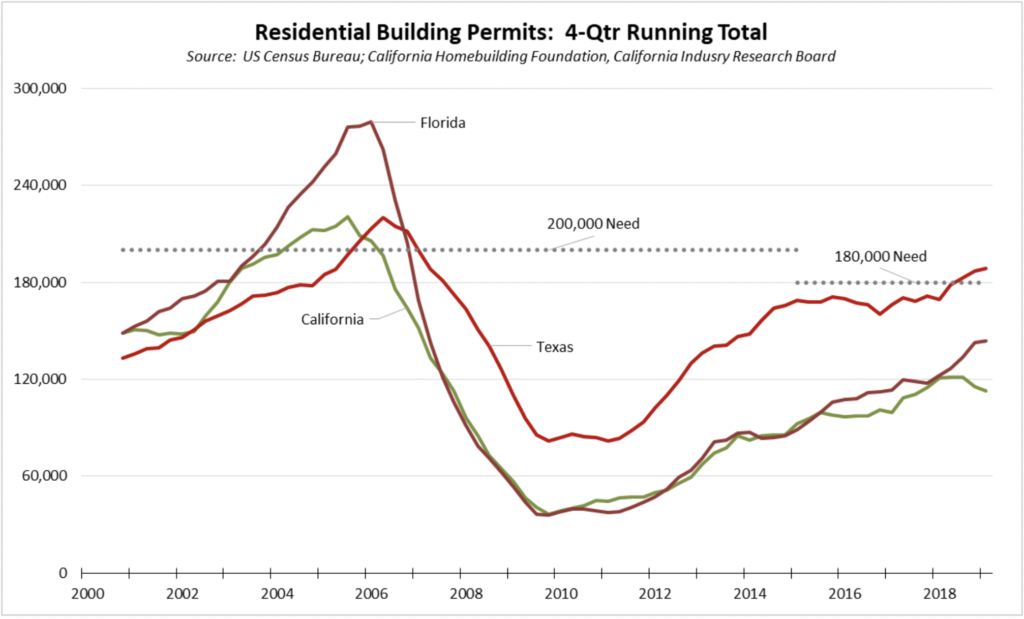
As measured by building permits for single and multi-family units, California continues to fall well below this goal, with only 112,584 units total over the past 4 quarters according to data from California Homebuilding Foundation, Industry Research Board. And rather than going up, the annual number based on a running 4-quarter total has dropped in the last two quarters.
In Texas—with only 72% of California’s population—the 180,000 threshold has been reached in each of the last 3 quarters and missed by only 1,500 units in the quarter just prior.
Florida—only 54% California’s size—largely kept pace with the state, but since 2015 has pulled ahead in expanding the supply of homes.
In fact, adjusted for population—in this case, the number of new housing permits per 1,000 population—33 states including the District of Columbia surpassed California in the last 4 quarters, with a dozen building housing at more than twice California’s rate.