Highlights for policy makers:
- COVID-19 and the State Economy: Most Recent Data
- Unemployment Rate Likely in Mid-20s; Employment Drops by 2.4 Million
- Labor Force Participation Rate Down at 59.5%
- Employment Growth Ranking
- Nonfarm Jobs Fall 2.3 Million
- Jobs Change by Industry
- Unemployment Rates by Region (not seasonally adjusted)
- Unemployment Rates by Legislative District (not seasonally adjusted)
- How Far Back Has the Economy in Each County Been Pushed?
- MSAs with the Worst Unemployment Rates
COVID-19 and the State Economy: Most Recent Data
The April numbers begin to reflect the extent of damage to the state’s economy stemming from the emergency social distancing measures. The May numbers scheduled for release June 19 will help fill this picture out, while the extent of recovery made possible by the current partial reopenings will not be known until later this this summer.
Recession Tracking. As a base indicator tool to summarize these changes as they occur, the following chart contains the most recent employment estimates by industry along with the 12-month change taken from the revised data for the same month in the prior year. The data used is the unadjusted numbers to show actual job levels held by Californians rather than the statistical levels from the seasonally adjusted data, and to enable use of the average wage and hours worked numbers where available from this series. The 2019 data will continue to be used for the pre-COVID base comparison. Month-to-month changes will still be instructive to indicate which industries and areas are being the most affected, but the year over year comparison allows seasonal factors to be taken into account. Within this chart, note that “employment” is the number of persons age 16 and over working, including wage & salary jobs, self-employment, and non-paid family workers in the civilian workforce. “Jobs” are the number of wage & salary jobs, with individual workers holding one or more of these jobs.
As indicated below, job numbers were below the 2019 levels in all but 3 industries, with the greatest contraction in Leisure & Hospitality where jobs were almost cut in half.
Where the information is available, average hourly earnings rose in all industries. These numbers do not represent wage growth but instead reflect the fact that layoffs generally affected lower wage workers more heavily. The averages went up because the lower wages were cut more proportionally. These jobs are more likely to require customer contact or a physical presence at a work location, and even where telework is possible, the high litigation risks under California’s labor laws make this work option less likely. Higher wage jobs have been more amenable to retention through telework and other work options, both from the standpoint of work characteristics and the state’s regulations.
Average weekly hours also began to soften, especially for Construction and, compounding the severe jobs losses, for Leisure & Hospitality as well.
The monthly numbers also indicate another effect. For quite some time, the household (labor force) and establishment (wage and salary jobs) surveys have shown diverging numbers. While there are possible technical issues involved in how the surveys are done, this difference has reflected the high level of persons who need more than one job to cope with the high cost of living in the state as well as a high degree of self-employment captured more by the employment and less by the wage and salary data. The April numbers, however, show the two surveys have converged in their estimates. This outcome may reflect some degree of resiliency as multiple job holders retain at least one in the current period, but it also suggests an added destructive element coming from last year’s AB 5 as self-employment has been forced by regulation into wage and salary but not necessarily on a one-for-one basis.
Source: US Bureau of Labor Statistics
Current Indicators. While the labor force and job numbers provide data about a month in arrears, WARN Act data provides an early if somewhat imperfect indicator of job reductions more in current time. The California and Federal WARN Acts require employers to give a 60-day notice prior to a facility closure or mass layoff. While the Governor has paused the associated penalties for not meeting the requirements, the requirements themselves remain in place. As a result, these notices are a better indicator of the geographic distribution of layoffs rather than the current actual number. In May (reporting as of May 20), the number of affected employees was at 113,393 compared to an average of around 7,000 in 2019. Most notices continue to cover temporary layoffs and closures, with only about 8% indicating the layoffs are permanent. This pattern continues to suggest an accelerated recovery is still possible if the right economic conditions exist.
Another current indicator is weekly initial claims for Unemployment Insurance (UI). Although easing substantially from the early spikes in March, California claims remain well above historic levels particularly when incorporating claims under the new Pandemic Unemployment Assistance (PUA) program for the self-employed. For the weeks of March 21 through May 16, total initial claims under both programs totaled 4,994,874. These are initial claims, and do not account for persons who have filed more than once, workers who secured a job after filing, and claims that were rejected in the process. However, putting these factors aside, that number encompasses 27% of the April labor force, and more likely reflects the actual unemployment rate level when taking into account the technical issues with the current employment numbers, as discussed below.
Two-Tier Recession. As highlighted by the Center over the past several years, recovery from the Great Recession produced a growing Two-Tier economy within the state. The high operating cost burden from the state’s regulation, tax, and fee structures limited the extent and types of jobs created within the traditional sectors of the economy. Technology companies, particularly those in the Bay Area, who were less affected by these structures or who pursued business models that avoided them altogether consequently generated an outsized contribution to jobs, wage, and incomes growth in this period. With the exception of the blue-collar jobs center around trade and logistics, jobs and income growth outside the Bay Area was instead dominated by population-serving and tourism related businesses and jobs created directly or supported by government funding.
As reflected in the April numbers, this pattern is being repeated in the current downturn. Lower wage jobs particularly in the population-serving services and in the travel and tourism businesses are showing the greatest job and income losses. Higher wage jobs that are afforded greater flexibility under the state’s restrictive labor laws have proved more amenable to retention under workplace options such as telework made even more possible in large part by the state’s technology industries.
The state’s above average economic performance during the last recovery that ended abruptly in March relied heavily on the Bay Area jobs less affected by the state’s high regulation and high tax model. The rest of the state did little better than the rest of the country when viewed by some measures, and did worse when measured by indicators such as unemployment, share of part-time jobs, and labor force participation. Moreover, the state did far worse when measured by the ability of households to keep up with the growing costs of living produced by those regulatory and tax policies.
The April numbers show the two-tier pattern is repeating but with a disproportionate impact on the lower wage jobs. Additional factors coming into play suggests the state is at risk of it becoming intensified:
- The outsized performance of the Bay Area technology industries did more than boost the state’s overall economic numbers during the last recovery. With just under 20% of the state’s population, this region also produced around 40% of total personal income tax revenues—the determinant of the health of the state budget and consequently schools and many local programs as well. The ability of the state to rise beyond the current series of multi-year projected deficits is dependent on the Bay Area returning to its prior growth curve as quickly as possible. However, Facebook has already announced it intends to make telework a permanent feature of its work model. Others may follow. To the extent these actions result in worker dispersion to areas with more reasonable costs of living, the current state and many local revenue models become unsustainable.
- Prior to the current economic conditions, many jobs especially lower-wage jobs were facing the prospect of automation. These pressures will continue as the cost of employing workers especially for smaller firms continues to rise including from minimum wage increases—both directly and through wage compaction pressures—along with the compliance costs and litigation risks associated with differences in California labor law compared to other states. A COVID-19 economic environment will contribute additional pressures in this regard to the extent that social distancing measures remain in place even if modified or in the event of an upsurge in cases later in the year. A recent analysis by McKinsey estimated that 37% of private jobs in California are vulnerable as a result of physical distancing policies. And many of these are found in the lower wage jobs that led the last recovery in much of the state. Based on their analysis in Southern California counties, about two-thirds of vulnerable jobs pay less than $40,000 a year, while only 9% fall in the $70,000 and above range.
- The same McKinsey analysis estimates that based on Southern California numbers, nearly 40% of vulnerable private jobs are in small firms with fewer than 100 workers. These small employers operate from a base of fewer resources even in normal economic times, but many will be starting off again from fundamentally zero cash flow and low operating capital balances. California’s higher compliance, tax, fee, and litigation costs will continue to divert scarce resources that in other states can instead be devoted to labor costs as they re-engage. The risks of business failure will remain high, and many will be looking for any cost savings in order to survive the year.
The pace of the recovery of course is critical to the overall well-being of households. Recovery is not just about jobs but the income those jobs provide to enable households to return to some semblance of normal life. The type of jobs in the forthcoming recovery is also critical to their ability to keep pace with the growing costs of living as the state maintains its commitment to expanding regulations and taxes even under the current economic crisis.
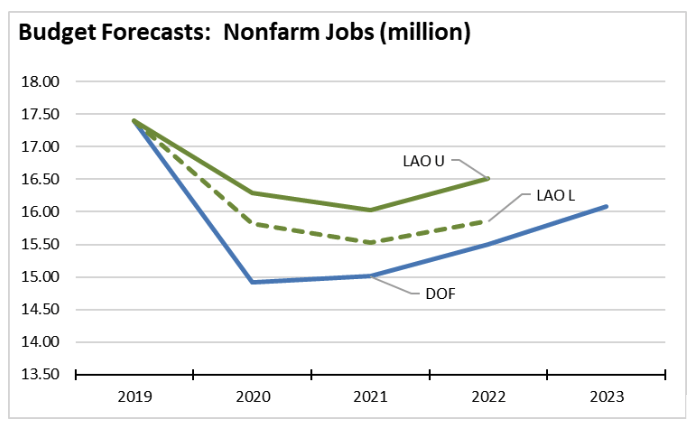
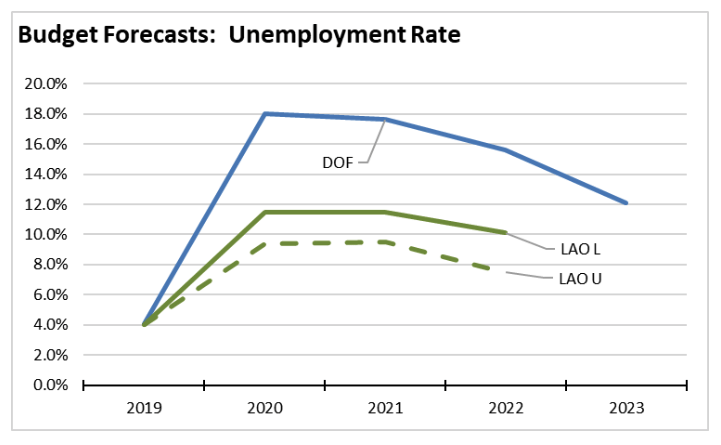
Budget Implications. The pace of the recovery also has a pronounced effect on likely budget deficits and the provision of basic services such as education, health care, and public safety. This point is illustrated in the different economic recovery projections behind the recent Budget May Revise (DOF) and the two economic scenarios in LAO’s Spring Fiscal Outlook (“U-shaped” recovery and a slower “L-shaped” recovery). All three projections envision general fund deficits, but the size of the deficits and the scale of the problems that must be resolved vary widely depending on how quickly the economy recovers.
As shown in the charts, all three projection scenarios do not expect full economic recovery in the state until 2024 or beyond. But the depth of the economic fall off and the pace of recovery in the intervening years has significant effects on the projected deficits in each scenario. While expenditure levels also differ substantially between the May Revise and LAO estimates, the May Revise more pessimistic assumptions result in a deficit estimate of $54 billion that must be covered by cuts, new taxes, and assumed federal funds. The mid-range LAO L-shaped recovery pegs the deficit at $31 billion, and under the accelerated U-shaped recovery at $18 billion. Moreover, the LAO scenarios assume Prop. 98 expenditures at about $56 billion, while the May Revise reduces it to $44.9 billion.
These differing projections clearly show the connection between the health of the state’s economy and the level of public revenues required for essential public services. The fact that all three scenarios also expect substantial deficits in the following years due to a delayed recovery in 2024 or beyond makes this point even clearer.
As a policy document, the May Revise does not address actions that could be taken to accelerate the recovery and thus to put the current deficit closer to the LAO numbers or begin to tackle the expected ongoing problems. Some of this stems from the current uncertainty and timing for the budget process, and further actions are expected to be proposed through the Governor’s Task Force. In other respects, however, the May Revise is a “business in California as usual” document, with state agencies continuing to promulgate new regulations that will raise costs on employers and consumers even as they struggle along with the state budget through the upcoming period.
In other areas, the May Revise also includes proposals to increase the cost barriers to jobs recovery:
- The scheduled January increase in the minimum wage is maintained “despite meeting the criteria for job losses and sales tax revenue declines that would allow the minimum wage increases to be paused for a year.” As indicated in the January Proposed Budget, the cost of covering minimum wage costs—primarily for In-Home Supportive Service (IHSS) workers—was $1.1 billion ($523.8 million General Fund) as a result of the scheduled increases in both January 2019 and January 2020. The May Revise includes a trigger cut to reduce IHSS service hours by 7% if federal funds are not provided to cover this state policy.
The proposed trigger cut illustrates the potential effect on private workers. While wage rates would rise, the 7% cut in service hours would keep worker incomes unchanged. Someone working 40 hours a week under the current $13 an hour rate would be making $475 a week (after employment taxes but before income tax withholding). At the scheduled $14 an hour but with a 7% cut in hours they would be making the same, but an any hours reduction above that point their incomes would be less. The difference arises because costs to employers rise by more than the $1 rate—an additional 8.65% for employer-paid employment taxes, additional amounts for increased benefits, and in many cases added labor costs to avoid wage compaction. The May Revise covers these additional costs by cuts to other program administrative costs including a freeze on county costs. The difference for private employers, however, is that these cuts and more have already been made during the shutdown, and there is no federal assistance in the wings to cover the added wage costs. Their likely recourse is to cut hours or positions and further add to the recovery delay. And as indicated in the McKinsey analysis cited above, small businesses least able to afford these costs are the primary employers of these workers.
- The May Revise also proposes $22 million of otherwise scarce budget resources to enforcement of last year’s AB 5. While households and employers will continue to have these work options to provide flexibility as they adjust to conditions in the recovery, California instead will be devoting resources to ensure they are eliminated.
These are policy choices, but they have implications to the likely length of the upcoming recovery period. And as recovery is delayed, the economic and budget consequences discussed above become more likely.
For workers, delayed recovery likely also means extended unemployment as was the case during the shallow recovery from the Great Recession. Elevated unemployment and more critically a large pool of workers only marginally attached to the labor served as a dampening force on wage growth throughout this period, with wages rising substantially only after participation rates began to increase back to previous levels. At 62.6% in February this year, California’s labor force participation rate never recovered to the pre-recession, 2007 levels, indicating there was still considerable room for further expansion in the state’s economy prior to the current dramatic downturn.
Extended unemployment also has implications to potential wage levels and lifetime earnings for workers. A shorter, stronger recovery in the state will minimize these effects from delaying workforce entry for young and other new workers. Analysis of the effects of extended unemployment during the prior recession indicated that workers who were able to at least maintain part-time work were able to shift quickly to full time work and secure wages at the average or median level. Workers who were out of or only marginally attached to the labor force instead generally found jobs at lower wage rates as the recovery progressed.
Unemployment Rate Likely in Mid-20s; Employment Drops by 2.4 Million
EDD reported total employment (seasonally adjusted; April preliminary) dropped 2,432,900 from the revised March numbers, while the number of unemployed rose by 1,833,200. The reported unemployment rate jumped to 15.5%. The unadjusted rate was up 12.3 points from the year earlier to 16.1%.
California had the 10th highest unemployment rate among the states.
Total US employment saw a seasonally adjusted loss of 22,369,000, with the number of unemployed rising by 15,938,000. The reported unemployment rate rose to 14.7%.
Figure Sources: California Employment Development Department; US Bureau of Labor Statistics
As discussed in the Friday summary, the reported unemployment numbers substantially understate the current economic situation:
- Both the household (used for labor force estimates) and establishment (jobs) surveys are done during the week of the 12th in each month. As indicated in the Unemployment Insurance (UI) initial claims data, layoffs continued at a strong pace in the second half of the month as well.
- The current conditions are also causing significant technical issues in the surveys. While the April response rate continued to be lower, BLS indicated it was sufficiently high enough to provide results with acceptable statistical validity.
- Misclassification is a far larger issue. First, there was an elevated number of workers indicating they were “employed, but not at work.” BLS analysis indicates most, however, should have been designated as “unemployed on temporary layoff.” Although not incorporated into the reported numbers, a correction for this factor would have raised the national unemployment rate (not seasonally adjusted) by 4.8%. While one month of data from the Current Population Survey (CPS) does not provide sufficient responses for a statistically valid result for California, it can give an indication of the scale of the effect. Using analysis similar to the BLS approach, correct classification would have raised the California unemployment rate by another 6-7 percent.
Second, persons who do not have a job, are on layoff, but that expect to be recalled to their job are not counted as unemployed or in the labor force because they are not actively looking for work. The CPS instead counts them as persons who are not in the labor force, but who still want a job. BLS estimates this misclassification if corrected would have raised the national unemployment rate by another 4.4%. Again with the same caveats on using one month of data, the same factor for California would have raised the state rate by 5% if the net increase over 2019 was used (to account for the relatively higher state level over time) to 9% if the full level is used as in the BLS analysis.
Labor Force Participation Rate Down at 59.5%
California’s seasonally adjusted labor force participation rate was down at 59.5%. Nationally, the participation rate dropped to 60.2%. The numbers, however, are affected by the same survey factors as discussed above.
For the 12 months ending April 2019, the seasonally adjusted data shows the California labor force was down 773,900 workers (-4.0% loss) compared to the rest of the US loss of 5,291,100 (-3.7%).
Employment Growth Ranking
The total number of persons employed (seasonally adjusted) over the 12 months ending in April plunged by 2,852,700. California had the lowest level in terms of absolute employment loss over the year.
Adjusted to account for differences in the size of each state economy, California over the year showed a 15.4% contraction, below the average for the rest of the US with a loss of 15.8%. Ranked among the states, California’s loss rate was the 39th highest.
Figure Source: US Bureau of Labor Statistics
Nonfarm Jobs Fall 2.3 Million
Nonfarm jobs (seasonally adjusted) fell 2,344,700 as March’s seasonally adjusted losses were revised to 210,500 from the previously reported 89,200. The large revision to the March numbers was primarily the result of adjustments to the seasonal adjustment formulas, which normally are done annually in February but were required due to the size of the current losses.
The April numbers largely account for the 12-month loss of 2,324,000 nonfarm jobs, the most of any state. Adjusting for population size, California was 20th among the states, with a 12-month jobs loss rate of -13.4% compared to the rest of the US at -12.9%.
Figure Sources: California Employment Development Department; US Bureau of Labor Statistics
Jobs Change by Industry
In the unadjusted numbers that allow a more detailed look at industry shifts, all but 3 industries posted job losses over the 12-month period. Utilities as an essential service and Information and Finance & Insurance with a high incidence of telework opportunities remained positive although largely unchanged.
Industries showing the greatest contractions were those generally requiring customer contact or a physical presence at a work location. These were led by lower wage Accommodation, Food Services, Other Services, and Farm but also included the middle-class wage level Arts, Entertainment & Recreation. A second grouping of generally higher wage blue/white collar industries requiring less than a college degree showed high but less severe contractions: Construction, Administrative & Support & Waste Services, and Manufacturing but also Retail Trade which showed employment losses offset somewhat by online sales and deliveries. The higher wage industries experienced far smaller losses due to their ability to maintain employment through telework and other options, both due to the nature of these jobs and restrictions under California’s labor laws that apply primarily to lower wage workers. Social Assistance, composed primarily of In-Home Supportive Services workers who perform their duties in the home under any circumstances, were the exception.
| Not Seasonally Adjusted Payroll Jobs (1,000) | Apr 2020 | 12-month change | Nonfarm Growth Rank | % 12-month Change | Avg. Annual Wage |
|---|---|---|---|---|---|
| Total Farm | 314.3 | -94.8 | -23.2% | $35.5k | |
| Mining & Logging | 21.5 | -0.4 | 4 | -1.8% | $119.5k |
| Construction | 744.9 | -126.0 | 14 | -14.5% | $72.5k |
| Manufacturing | 1,180.5 | -137.1 | 16 | -10.4% | $97.1k |
| Wholesale Trade | 630.8 | -63.2 | 10 | -9.1% | $80.4k |
| Retail Trade | 1,351.0 | -282.7 | 20 | -17.3% | $37.7k |
| Utilities | 57.0 | 1.2 | 3 | 2.2% | $137.0k |
| Transportation & Warehousing | 593.7 | -28.3 | 7 | -4.5% | $62.0k |
| Information | 549.0 | 3.0 | 2 | 0.5% | $188.7k |
| Finance & Insurance | 539.2 | 3.7 | 1 | 0.7% | $133.0k |
| Real Estate & Rental & Leasing | 278.6 | -20.9 | 6 | -7.0% | $71.2k |
| Professional, Scientific & Technical Services | 1,268.6 | -59.8 | 9 | -4.5% | $126.8k |
| Management of Companies & Enterprises | 238.2 | -18.3 | 5 | -7.1% | $135.1k |
| Administrative & Support & Waste Services | 959.8 | -157.9 | 18 | -14.1% | $47.3k |
| Educational Services | 366.8 | -30.9 | 8 | -7.8% | $56.0k |
| Health Care | 1,434.0 | -136.3 | 15 | -5.7% | $69.6k |
| Social Assistance | 762.1 | -69.2 | 11 | -8.3% | $20.9k |
| Arts, Entertainment & Recreation | 177.3 | -151.6 | 17 | -46.1% | $60.0k |
| Accommodation | 130.3 | -104.5 | 13 | -44.5% | $39.7k |
| Food Services | 791.0 | -677.6 | 21 | -46.1% | $24.1k |
| Other Services | 412.4 | -163.1 | 19 | -28.3% | $41.9k |
| Government | 2,573.9 | -71.6 | 12 | -2.7% | $72.0k |
| Total Nonfarm | 15,060.6 | -2,291.5 | -13.2% | ||
| Total Wage & Salary | 15,374.9 | -2,386.3 | -13.4% | ||
Figure Source: California Employment Development Department; Wages based on most recent Quarterly Census of Employment & Wages
Unemployment Rates by Region (not seasonally adjusted)
Regions with jobs providing greater telework options—both due to the nature of the jobs and under the state’s regulations—including the Bay Area, Orange County, and Sacramento saw somewhat lower unemployment rates. Regions with higher concentrations of blue collar and lower wage jobs including the Central Valley and Los Angeles had much higher rates.
| wdt_ID | Region | Unemployment Rates |
|---|---|---|
| 1 | California | 16.1 |
| 2 | Bay Area | 13.1 |
| 6 | Orange County | 13.8 |
| 10 | Sacramento | 14.2 |
| 14 | Inland Empire | 14.4 |
| 18 | Upstate California | 15.5 |
| 22 | San Diego/Imperial | 15.6 |
| 26 | Central Sierra | 15.9 |
| 30 | Central Coast | 17.7 |
| 34 | Central Valley | 17.8 |
| 38 | Los Angeles | 19.6 |
Figure Source: California Employment Development Department
Unemployment Rates by Legislative District (not seasonally adjusted)
Lowest
| wdt_ID | Congressional District | Unemployment Rate |
|---|---|---|
| 1 | CD18 (Eshoo-D) | 10.0 |
| 2 | CD17 (Khanna-D) | 11.3 |
| 3 | CD12 (Pelosi-D) | 11.9 |
| 4 | CD49 (Levin-D) | 11.9 |
| 5 | CD14 (Speier-D) | 12.6 |
| 6 | CD52 (Peters-D) | 12.2 |
| 7 | CD15 (Swalwell-D) | 12.0 |
| 9 | CD48 (Rouda-D) | 12.8 |
| 10 | CD31 (Aguilar-D) | 13.0 |
| 12 | CD45 (Porter-D) | 13.1 |
| wdt_ID | Senate District | Unemployment Rate |
|---|---|---|
| 1 | SD13 (Hill-D) | 10.4 |
| 2 | SD36 (Bates-R) | 12.1 |
| 3 | SD10 (Wieckowski-D) | 12.2 |
| 4 | SD15 (Beall-D) | 12.5 |
| 5 | SD11 (Wiener-D) | 12.9 |
| 6 | SD39 (Atkins-D) | 12.5 |
| 7 | SD07 (Glazer-D) | 13.4 |
| 8 | SD37 (Moorlach-R) | 13.0 |
| 9 | SD01 (Dahle-R) | 13.8 |
| 10 | SD23 (Morrell-R) | 13.9 |
| wdt_ID | Assembly District | Unemployment Rate |
|---|---|---|
| 1 | AD16 (Bauer-Kahan-D) | 9.9 |
| 2 | AD28 (Low-D) | 10.1 |
| 3 | AD24 (Berman-D) | 10.4 |
| 4 | AD25 (Chu-D) | 11.2 |
| 5 | AD22 (Mullin-D) | 10.5 |
| 6 | AD77 (Maienschein-R) | 12.2 |
| 7 | AD73 (Brough-R) | 11.9 |
| 8 | AD06 (Kiley-R) | 12.1 |
| 9 | AD78 (Gloria-D) | 11.8 |
| 10 | AD75 (Waldron-R) | 12.2 |
Highest
| wdt_ID | Congressional District | Unemployment Rate |
|---|---|---|
| 1 | CD28 (Schiff-D) | 20.3 |
| 2 | CD32 (Napolitano-D) | 20.3 |
| 3 | CD37 (Bass-D) | 20.5 |
| 4 | CD21 (Cox-D) | 20.5 |
| 5 | CD34 (Gomez-D) | 21.8 |
| 6 | CD43 (Waters-D) | 21.5 |
| 7 | CD29 (Cardenas-D) | 21.2 |
| 9 | CD40 (Roybal-Allard-D) | 23.5 |
| 10 | CD51 (Vargas-D) | 23.8 |
| 12 | CD44 (Barragan-D) | 26.1 |
| wdt_ID | Congressional District | Unemployment Rate |
|---|---|---|
| 1 | SD22 (Rubio-D) | 18.7 |
| 2 | SD12 (Caballero-D) | 19.0 |
| 3 | SD21 (Wilk-R) | 20.3 |
| 4 | SD18 (Hertzberg-D) | 21.3 |
| 5 | SD24 (Durazo-D) | 22.3 |
| 6 | SD14 (Hurtado-D) | 22.1 |
| 7 | SD40 (Hueso-D) | 22.0 |
| 9 | SD33 (Gonzalez-D) | 22.8 |
| 10 | SD30 (Mitchell-D) | 22.8 |
| 12 | SD35 (Bradford-D) | 23.1 |
| wdt_ID | Congressional District | Unemployment Rate |
|---|---|---|
| 1 | AD62 (Burke-D) | 21.0 |
| 2 | AD32 (Salas-D) | 21.2 |
| 3 | AD56 (Garcia-D) | 21.3 |
| 4 | AD80 (Gonzalez-D) | 21.9 |
| 5 | AD63 (Rendon-D) | 24.5 |
| 6 | AD36 (Lackey-R) | 23.4 |
| 7 | AD46 (Nazarian-D) | 23.2 |
| 9 | AD51 (Carrillo-D) | 24.9 |
| 10 | AD64 (Gipson-D) | 25.2 |
| 12 | AD59 (Jones-Sawyer-D) | 25.9 |
How Far Back Has the Economy in Each County Been Pushed?
As an indication of the severity of the current economic downturn, the following chart illustrates how much economic ground each county has lost using employment levels as the measure. Based on annual averages, the chart below indicates the last year each county saw the April employment numbers. Because the current series only goes back to 1990 for most counties, several of the entries indicate “Before 1990.” Los Angeles County, which is the exception, last saw the April 2020 employment levels in the first half of 1986.
| wdt_ID | County | Last Year Employment Equal to or Less Than April |
|---|---|---|
| 1 | Alameda County | 2009 |
| 2 | Alpine County | 2010 |
| 3 | Amador County | 1999 |
| 4 | Butte County | 1999 |
| 5 | Calaveras County | 2013 |
| 6 | Colusa County | 2017 |
| 7 | Contra Costa County | 1998 |
| 8 | Del Norte County | 1993 |
| 9 | El Dorado County | 1998 |
| 10 | Fresno County | 2014 |
| County | Last Year Employment Equal to or Less Than April |
MSAs with the Worst Unemployment Rates
Of the 20 Metropolitan Statistical Areas (MSAs) with the worst unemployment rates in March 2019, 12 are in California. The unemployment rates and rankings shown below are from March when enforced closures were just beginning. The April numbers will provide a more complete picture.
| wdt_ID | MSA | Unemp. | Rank |
|---|---|---|---|
| 1 | El Centro MSA | 20.5 | 389 |
| 2 | Visalia-Porterville MSA | 14.5 | 387 |
| 3 | Merced MSA | 12.9 | 386 |
| 4 | Hanford-Corcoran MSA | 12.3 | 385 |
| 5 | Bakersfield MSA | 12.0 | 384 |
| 6 | Salinas MSA | 11.8 | 383 |
| 7 | Fresno MSA | 10.8 | 381 |
| 8 | Madera MSA | 10.5 | 380 |
| 9 | Yuba City MSA | 10.0 | 379 |
| 10 | Modesto MSA | 8.3 | 376 |
| 11 | Stockton-Lodi MSA | 8.3 | 376 |
| 12 | Santa Cruz-Watsonville MSA | 7.9 | 375 |
Figure Source: US Bureau of Labor Statistics, March 2020 data