Highlights for policy makers:
- COVID-19 and the State Economy
- Employment Up Only 0.2%
- Labor Force Participation Rate Up 0.1 Point
- Nonfarm Jobs: 1.412 Million Below Recovery
- Jobs Change by Industry
- Employment Recovery by Region
- Unemployment Rates by Legislative Districts
- Unemployment Rates by Region
- MSAs with the Worst Unemployment Rates
COVID-19 and the State Economy
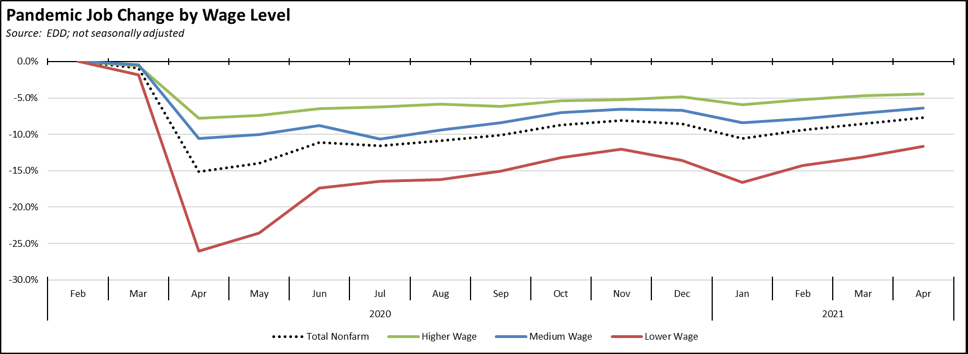
The April numbers are the first to be done during a period when most counties had moved out of the strictest, Tier 1 restrictions. Not surprisingly, as businesses were allowed to move towards more relaxed operating conditions, the job numbers came in higher than previous months. Gains in employment, however, remain subdued.
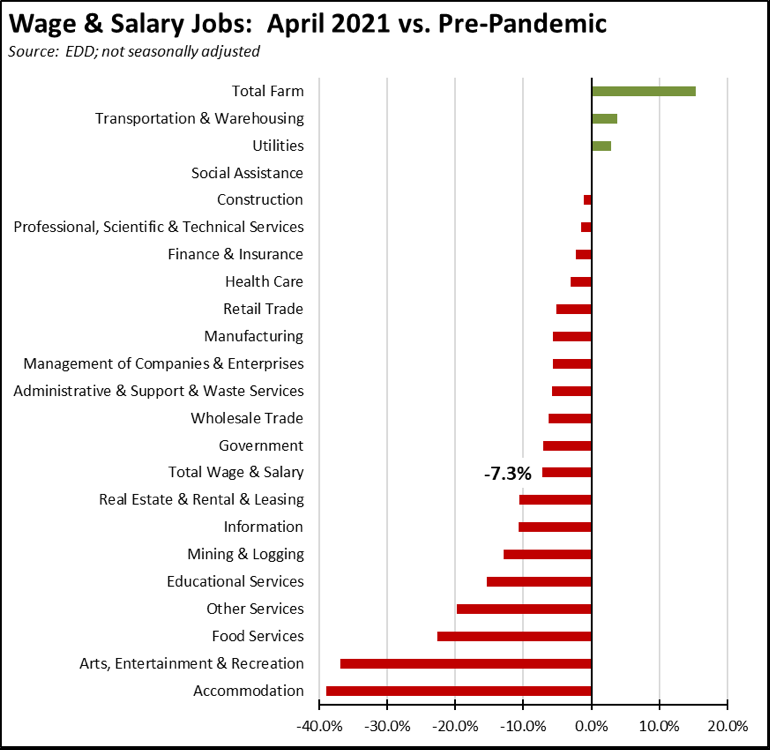
Job recovery was seen across all three wage levels. While the lower wage industries again experienced somewhat higher movement, their overall recovery status remains the lowest. The higher wage industries continued to exceed the previous recovery peak reached prior to the state’s renewed stay-at-home orders at the end of last year, while the other three categories rose above those peaks for the first time and regained the economic ground that was lost in December.
In the chart, higher wage jobs are those industries with average annual wages above $100,000; medium wage is $50,000 to $100,000; and lower wage is below $50,000. Job data is drawn from the industry classifications, unadjusted job numbers, and wage levels used in the regular report section below on Nonfarm Jobs.
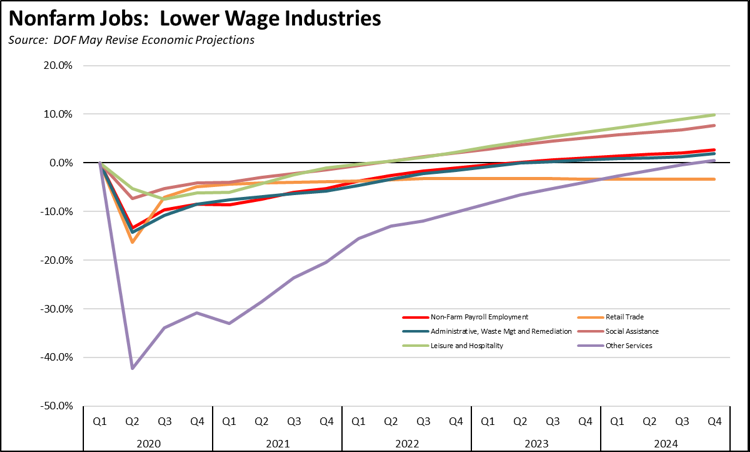
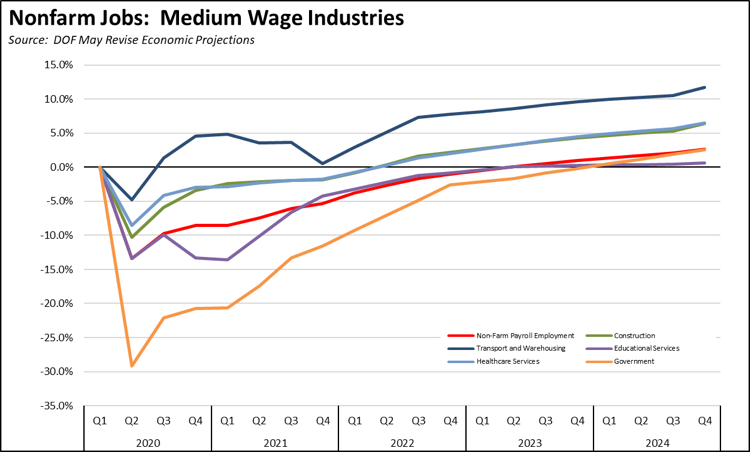
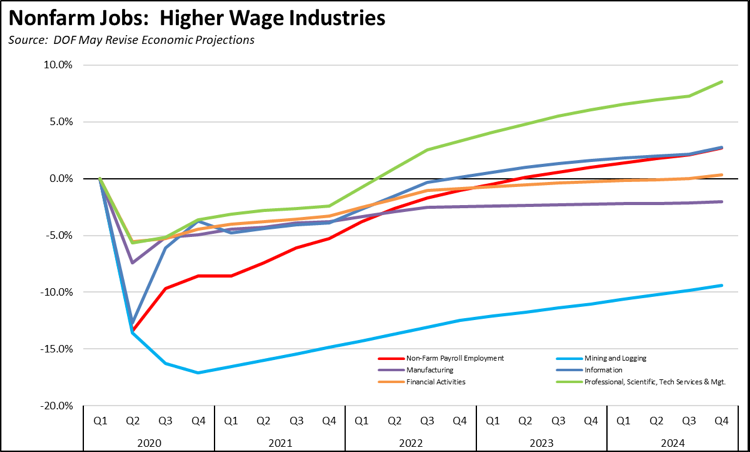
Projected Recovery
In their latest economic projections for the May Budget Revise, Department of Finance expects continued disparate recovery across the different industry groupings. Overall, nonfarm jobs are not expected to exceed the pre-pandemic February 2020 levels until the second quarter of 2023. Lower wage Other Services and higher wage Financial Services are shown reaching recovery later towards the end of 2024, while lower wage Retail Trade and higher wage Manufacturing and Mining & Logging are not expected to return to the February 2020 job levels during the forecast period in part due to acceleration of labor-replacing automation and other changes induced by the state’s closure strategy and in the case of Mining & Logging, increasing regulatory restrictions on those high-wage blue collar jobs.
From the state budget standpoint, the pattern of jobs recovery is just as important as the total. Due to the extremely progressive nature of the state’s tax system, the higher wage jobs pay the bulk of the state’s tax revenues. Delays in the lower wage and medium wage jobs generally have a greater effect on the state’s ongoing costs especially for social services.
Combined with the increasing long-term unemployment discussed later in this report, these trends if realized are likely to have the effect of repeating if not intensifying the effects on income equality experienced during the prolonged recovery following the Great Recession beginning in 2008. State policies, however, continue to focus more on increasing the cost of employing workers especially the lower wage workers—including the failure of the May Revise to address the pending employment tax increases stemming from the growing Unemployment Insurance Fund debt—rather than steps to accelerate recovery beyond what is currently projected. For example, nearly a third of the state’s restaurants are reported to have closed due to the pandemic period rules and the way in which they were rolled out, and full recovery is anticipated to take several years beyond the timeframe in the Finance projections.
CaliFormer Businesses: Update
In their recent population update, Department of Finance estimates that the state shrank by 182,100 (0.5%) people in 2021, the first decline in the state’s history. The estimates, however, have yet to incorporate the 2020 Census results, and will be updated later this year once that data becomes available.
Population change was not even across the state, with Los Angeles showing the greatest loss, and three interior regions showing gains.
Some of the more recent survey data suggest population growth will continue to be constrained as more Californians move out of the state in a search for lower costs of living. The most recent analysis using Postal Service change of address data, from the Bay Area Council Economic Institute, indicates there were 650,000 moves out of the state in 2020, up by 15% over prior years, and a net out migration of 211,000, more than double the results from 2018. Note that these are moves and not the number of people. Assuming the California average household size of 2.95, those numbers translate into net loss of 622,000 persons or roughly an amount equal to our previous estimates based on vehicle registration data. It should also be noted these were moves undertaken during the difficult conditions of the pandemic. The outcomes as the economy opens up remain to be seen.
The Bay Area Council’s most recent survey, however, suggests the direction of that future trend. The number indicating they strongly or somewhat agreed with the statement that they are likely to move out of the Bay Area in the next few years was at 47%, not much different from the same number in 2018 (46%). Destinations were substantially changed. In 2021, only 12% indicated a leaning towards moving elsewhere in California (24% in 2018), compared to 50% indicating elsewhere in the US (61% in 2018) and a rise in the number indicating “anywhere out of state/more affordable/other” at 34% (27% in 2018). Out of the country came in at 8% (6%), and don’t know at 17% (15%). The total exceeds 100% as multiple answers were possible. Reasons for moving showed the greatest change in “too many taxes,” “government/budget,” and “crime/safety” which combined went from 16% in 2018 to 37% in 2021. The more general “cost of living” went from 45% to 36%.
Another factor affecting state population in the coming years is likely the movement of retirees to lower cost states as the last of the baby boomers reaches retirement age, as noted by Wells Fargo Senior Economist Mark Vitner. As one tracking indicator of this trend, the following chart shows the share of public employee retirees living out of state, using data obtained from both CalPERS and CalSTRS.
In both systems, the share of recipients moving out of the state generally dropped during the Great Recession years. As housing prices recovered and it became possible again to move without taking a loss on selling their homes, movement out of state again began increasing in 2017 and 2018. For CalSTRS, moves out of state began rising at the beginning of the Great Recession, but then dropped in 2014 in conjunction with a larger than normal rise in retirees.
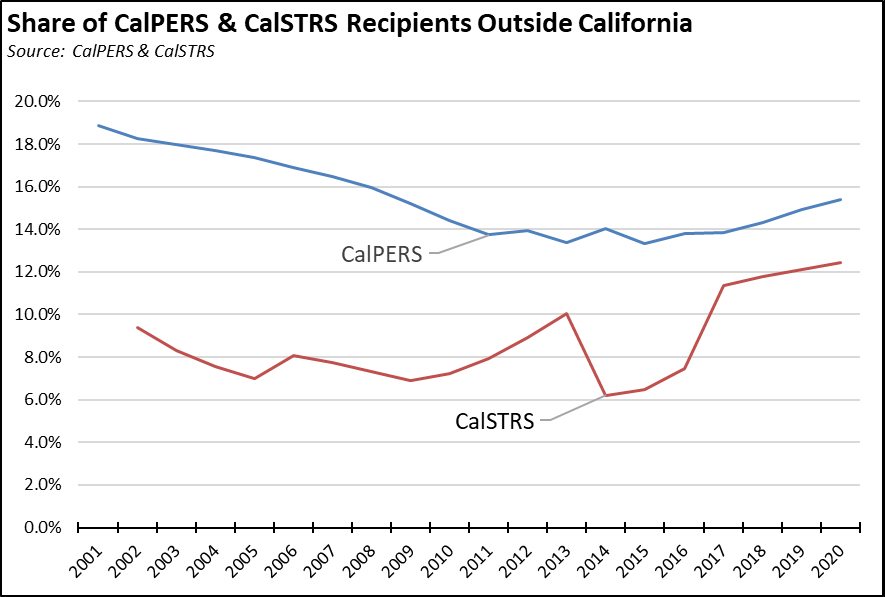
Note that there is some shift in the data base. Most years shown are based on payments made in December each year. The most recent response from CalPERS instead provided the totals for June in 2018-2020.
The preferred destinations for recipients under both systems largely tracks those of the CaliFormer businesses moving out of state.
Additional CaliFormer companies identified since our last monthly report are as follows. These companies include those that have announced: (1) moving their headquarters or full operations out of state, (2) moving business units out of state (generally back office operations where the employees do not have to be in a more costly California location to do their jobs), (3) California companies that expanded out of state, and (4) companies turning to permanent telework options, leaving it to their employees to decide where to work and live.
CaliFormers Update
| wdt_ID | Companies | From | To | Reason | Source | Year |
|---|---|---|---|---|---|---|
| 2 | Brightseed | San Francisco | North Carolina | Expansion | Read More | 2022 |
| 3 | ePost Global | Rancho Dominguez | Florida | Expansion | Read More | 2022 |
| 4 | LG Energy Solution | Torrance | Arizona | $1.4 billion battery manufacturing plant | Read More | 2022 |
| 5 | Lucid Motors | Newark | Arizona | Manufacturing expansion | Read More | 2022 |
| 6 | Salesforce | San Francisco | Atlanta | Shift of executive suite posts | Read More | 2022 |
| 7 | Sana Biotechnologies | Fremont | Washington | Manufacturing relocation | Read More | 2022 |
| 8 | Seed&Spark | Los Angeles | Atlanta | HQ move | Read More | 2022 |
| 9 | Sila Nanotechnologies | Alameda | Washington | Manufacturing expansion | Read More | 2022 |
| 10 | Smithfield Foods | Vernon | various | Close manufacturing and 1,800 jobs | Read More | 2022 |
| 11 | Trinity Financial Services | Newport | Florida | HQ move | Read More | 2022 |
| Companies | From | To | Reason | Source | Year |
Additional high income taxpayers moving out of the state include the following:
Employment Up Only 0.2%
EDD reported that employment (seasonally adjusted; April preliminary) grew 36,800 from the revised February numbers, while the number of unemployed dropped 3,200.
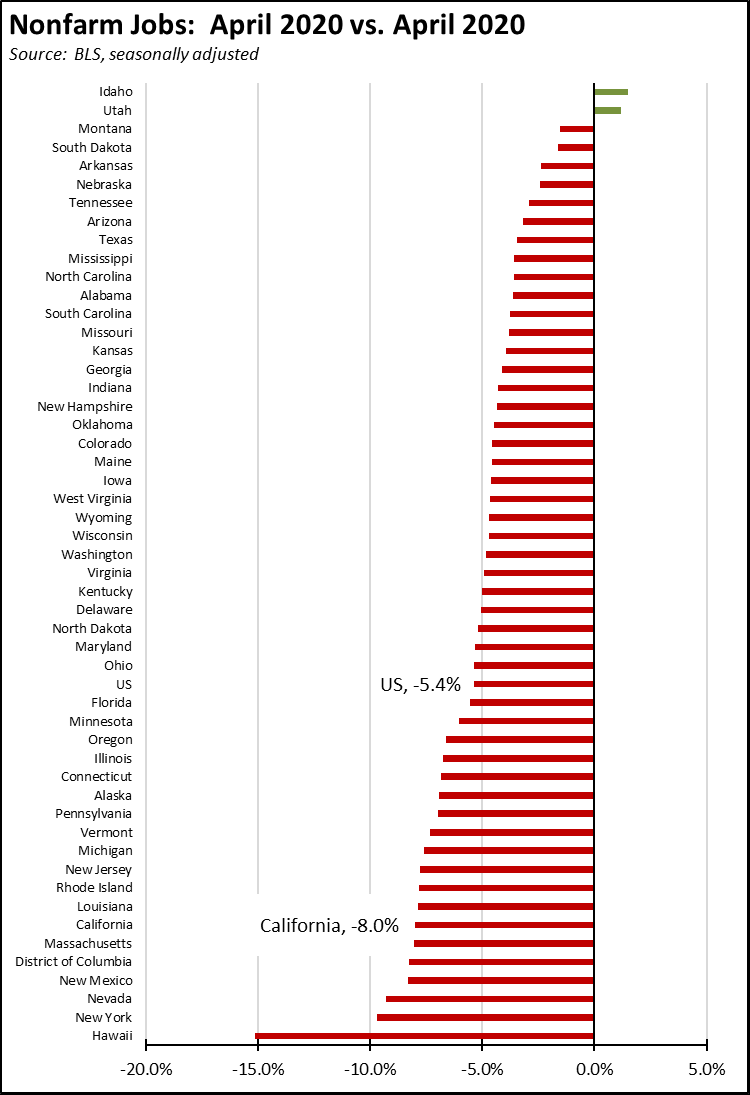
The reported unemployment rate was unchanged at 8.3%. California edged down to the 2nd worst unemployment rate in the country, behind only tourism-dependent Hawaii.
Total US employment gained 328,000, while the number of unemployed rose by 102,000. The reported unemployment rate increased 0.1 point to 6.1%.
Figure Sources: California Employment Development Department; US Bureau of Labor Statistics
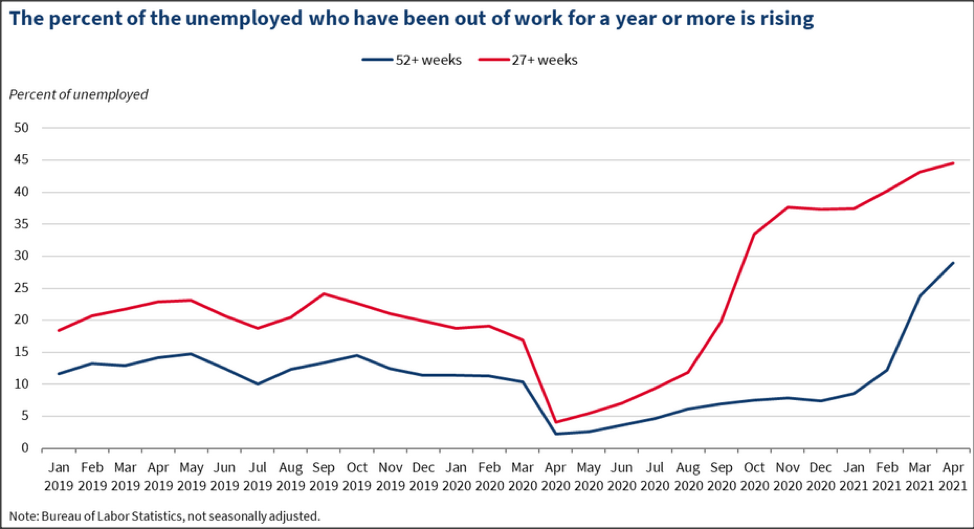
As noted by the Council of Economic Advisors in their review of the national numbers, long-term unemployment has risen rapidly in the last few months, particularly for those unemployed for more than a year. As jobs have remained closed particularly in states such as California and as the level of enhanced unemployment and other benefits in this period have made it possible for workers to remain unemployed, the numbers have risen. As noted in the Council’s report, 29% of the unemployed on an unadjusted basis have been out of work for more than a year. The maximum reached the much longer Great Recession was 33%. As taken from the report:
Labor Force Participation Rate Up 0.1 Point
The labor force participation rate rose 0.1 percentage point to 61.0%, while the US number rose slightly higher to 61.7%. The rate remains well below the pre-pandemic level of 62.5%, which in turn was down substantially from prior years. Taking into account the participation rate, California cannot be said to have fully recovered prior to the pandemic shutdowns. The additional workers leaving the labor force in pandemic period puts that goal further off.
Nonfarm Jobs: 1.412 Million Below Recovery
Nonfarm wage and salary jobs rose 101,800 (seasonally adjusted) in April, while the gains in March were revised to 132,400 from the previously reported 119,600. Nonfarm jobs nationally were up 266,000.
While job gains were strong over the past two months, California remains behind all but 5 states and DC in returning to the pre-pandemic job levels. Compared to the February 2020 numbers (seasonally adjusted) just prior to the current crisis and not accounting for population changes, nonfarm wage and salary jobs in California dropped to 1.412 million short of recovery.
Jobs Change by Industry
Using the unadjusted numbers that allow a more detailed look at industry shifts, all but two industries—reflecting the fact that most public schools remain closed or partially closed—showed positive jobs growth since the depth of the economic downturn last April. Industries showing the greatest—although not necessarily full—recovery were those hit hardest by the state restrictions: Food Services, Retail Trade, Construction.
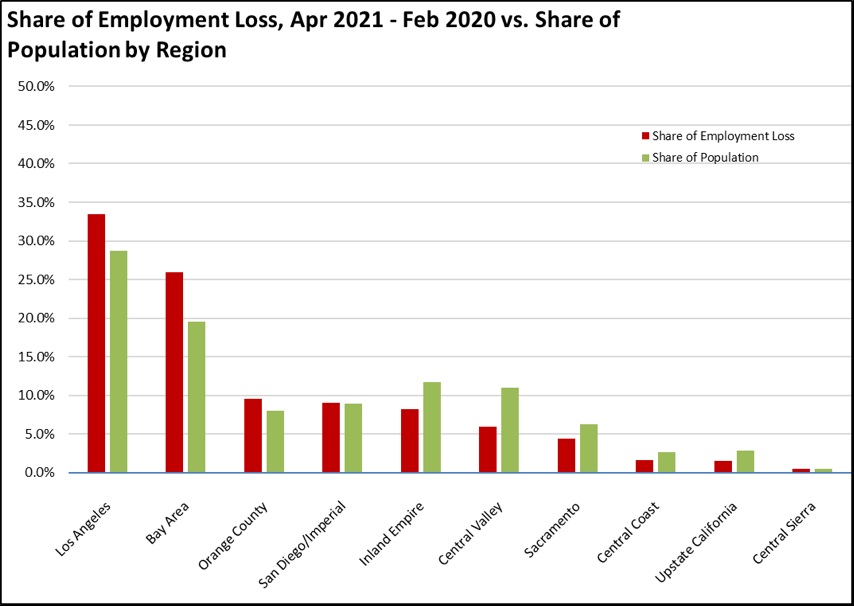
Employment Recovery by Region
All regions continued to show lower employment compared to pre-pandemic February 2020, with Los Angeles and Bay Area still showing the relatively highest losses.
Unemployment Rates by Legislative Districts
The highest and lowest estimated unemployment rates in April are shown below. The legislative district estimates have been updated to reflect both EDD’s revisions to the unemployment data and the most current factors from the American Community Survey.
Lowest
| wdt_ID | Congressional District | Unemployment Rate |
|---|---|---|
| 2 | CD18 (Eshoo-D) | 3.8 |
| 3 | CD17 (Khanna-D) | 4.6 |
| 4 | CD15 (Swalwell-D) | 5.0 |
| 5 | CD14 (Speier-D) | 5.0 |
| 6 | CD52 (Peters-D) | 4.9 |
| 7 | CD12 (Pelosi-D) | 4.9 |
| 9 | CD02 (Huffman-D) | 5.1 |
| 10 | CD49 (Levin-D) | 5.2 |
| 12 | CD24 (Carbajal-D) | 5.3 |
| 13 | CD45 (Porter-D) | 5.4 |
| wdt_ID | Senate District | Unemployment Rate |
|---|---|---|
| 2 | SD13 (Hill-D) | 4.2 |
| 3 | SD15 (Beall-D) | 4.8 |
| 4 | SD10 (Wieckowski-D) | 5.1 |
| 5 | SD39 (Atkins-D) | 5.1 |
| 6 | SD36 (Bates-R) | 5.2 |
| 7 | SD01 (Dahle-R) | 5.4 |
| 8 | SD11 (Wiener-D) | 5.2 |
| 9 | SD37 (Moorlach-R) | 5.4 |
| 10 | SD02 (McGuire-D) | 5.4 |
| 11 | SD07 (Glazer-D) | 5.9 |
| wdt_ID | Assembly District | Unemployment Rate |
|---|---|---|
| 2 | AD28 (Low-D) | 3.0 |
| 3 | AD24 (Berman-D) | 3.3 |
| 4 | AD22 (Mullin-D) | 3.3 |
| 5 | AD16 (Bauer-Kahan-D) | 3.6 |
| 6 | AD73 (Brough-R) | 4.0 |
| 7 | AD10 (Levine-D) | 4.0 |
| 8 | AD06 (Kiley-R) | 3.9 |
| 9 | AD25 (Chu-D) | 3.8 |
| 10 | AD17 (Chiu-D) | 3.8 |
| 11 | AD78 (Gloria-D) | 4.1 |
Highest
| wdt_ID | Congressional District | Unemployment Rate |
|---|---|---|
| 2 | CD29 (Cardenas-D) | 7.8 |
| 3 | CD37 (Bass-D) | 7.9 |
| 4 | CD28 (Schiff-D) | 8.0 |
| 5 | CD34 (Gomez-D) | 8.7 |
| 6 | CD16 (Costa-D) | 8.9 |
| 7 | CD32 (Napolitano-D) | 7.9 |
| 9 | CD21 (Cox-D) | 9.5 |
| 10 | CD40 (Roybal-Allard-D) | 9.5 |
| 12 | CD51 (Vargas-D) | 10.6 |
| 13 | CD44 (Barragan-D) | 10.6 |
| wdt_ID | Senate District | Unemployment Rate |
|---|---|---|
| 2 | SD22 (Rubio-D) | 7.1 |
| 3 | SD12 (Caballero-D) | 7.4 |
| 4 | SD21 (Wilk-R) | 8.5 |
| 5 | SD35 (Bradford-D) | 8.8 |
| 6 | SD24 (Durazo-D) | 8.8 |
| 7 | SD18 (Hertzberg-D) | 7.9 |
| 9 | SD30 (Mitchell-D) | 9.0 |
| 10 | SD33 (Gonzalez-D) | 9.1 |
| 12 | SD40 (Hueso-D) | 9.4 |
| 13 | SD14 (Hurtado-D) | 10.4 |
| wdt_ID | Assembly District | Unemployment Rate |
|---|---|---|
| 2 | AD53 (Santiago-D) | 11.4 |
| 3 | AD46 (Nazarian-D) | 12.3 |
| 4 | AD56 (Garcia-D) | 11.9 |
| 5 | AD36 (Lackey-R) | 12.6 |
| 6 | AD32 (Salas-D) | 12.5 |
| 7 | AD31 (Arambula-D) | 11.7 |
| 9 | AD63 (Rendon-D) | 13.6 |
| 10 | AD51 (Carrillo-D) | 13.8 |
| 12 | AD64 (Gipson-D) | 14.2 |
| 13 | AD59 (Jones-Sawyer-D) | 14.4 |
Unemployment Rates by Region
Unemployment rates (not seasonally adjusted) compared to pre-pandemic February 2020 continue to show the Los Angeles region with the worst outcome in the state.
| wdt_ID | Region | Apr - 21 | Feb - 20 |
|---|---|---|---|
| 2 | California | 8.1 | 4.3 |
| 6 | Bay Area | 5.7 | 2.7 |
| 10 | Orange County | 6.2 | 2.8 |
| 14 | Sacramento | 6.6 | 3.7 |
| 18 | Central Sierra | 6.9 | 4.5 |
| 22 | San Diego/Imperial | 7.1 | 3.8 |
| 26 | Central Coast | 7.6 | 7.0 |
| 30 | Inland Empire | 7.6 | 3.9 |
| 34 | Upstate California | 7.6 | 6.3 |
| 38 | Central Valley | 9.9 | 8.4 |
| 39 | Los Angeles | 10.5 | 4.6 |
Figure Source: California Employment Development Department
MSAs with the Worst Unemployment Rates
California had 11 of the MSAs among the 25 regions with the worst unemployment rates in February.
| wdt_ID | MSA | February Unemployment Rate | US Rank out of 389 |
|---|---|---|---|
| 1 | El Centro, CA Metropolitan Statistical Area | 15.7 | 389 |
| 2 | Visalia-Porterville, CA Metropolitan Statistical Area | 11.6 | 385 |
| 3 | Merced, CA Metropolitan Statistical Area | 11.4 | 384 |
| 4 | Bakersfield, CA Metropolitan Statistical Area | 11.1 | 381 |
| 5 | Hanford-Corcoran, CA Metropolitan Statistical Area | 10.5 | 378 |
| 6 | Salinas, CA Metropolitan Statistical Area | 10.4 | 377 |
| 7 | Yuba City, CA Metropolitan Statistical Area | 10.0 | 374 |
| 8 | Fresno, CA Metropolitan Statistical Area | 9.9 | 373 |
| 9 | Los Angeles-Long Beach-Anaheim, CA Metropolitan Statistical Area | 9.8 | 372 |
| 10 | Madera, CA Metropolitan Statistical Area | 9.7 | 370 |
| 11 | Stockton-Lodi, CA Metropolitan Statistical Area | 9.2 | 367 |