Highlights for policy makers:
- COVID-19 and the State Economy
- May Revise Economic Projections
- Inflation and the Recovery
- Recession Risks Before Recovery
- CaliFormer Businesses: Update
- CaliFormers: Population Drops Two Years in a Row
- NonFarm Jobs: 240k Below Pre-Covid Peak
- Job Change by Industry
- Job Openings Remain High
- Employment 386k Below Pre-Covid Level
- Unemployment Insurance Initial Claims Edge Above Pre-Pandemic Average in California
- Labor Force Participation Rate
- Unemployment Rates by Legislative Districts
- Unemployment Rates by Region
- Employment Recovery by Region
- MSAs with the Worst Unemployment Rates
COVID-19 and the State Economy
As discussed in our preliminary analysis, the numbers for April show continued strong employment gains, further increasing the offset to the anemic results for the last quarter of 2021. The nonfarm job numbers in contrast show a weakening trend, with California’s 41,400 increase coming in third behind Texas at 62,800 and Florida at 58,600.
California’s recovery remains slow compared to the other states. With these latest postings, California employment was still 385,800 short of rebuilding to the pre-pandemic level, while 28 other states have already surpassed this milestone. In nonfarm jobs, California was still 239,900 below the pre-pandemic peak, while 14 other states have moved beyond this level. Most of the gains recorded in recent months continue to be from rebuilding the jobs that were closed in the prior series of state orders rather than moving back into the growth mode required to improve economic mobility prospects for a broader range of the population. The state is still struggling to get back to where it was, not to where it should be.
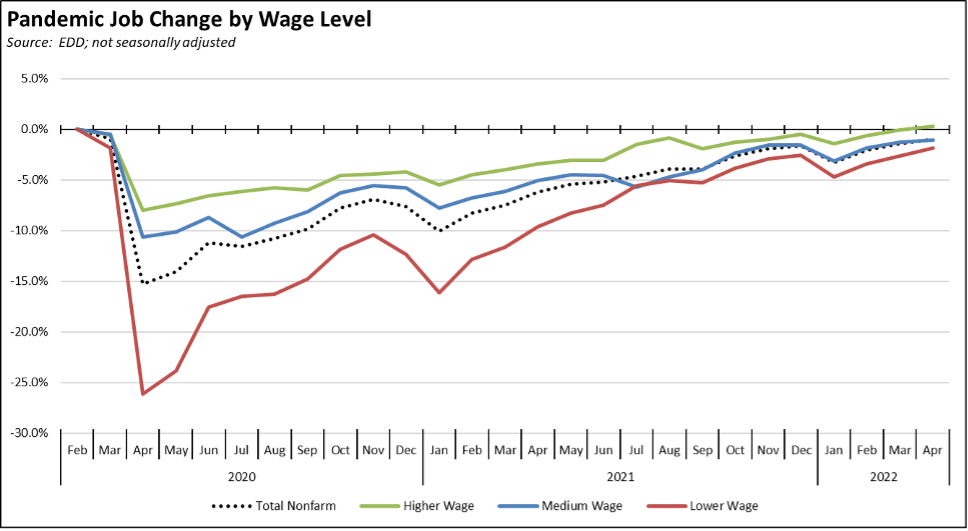
Using the unadjusted numbers to show results by average wage level, the higher wage industries finally moved into positive territory, while the medium wage industries continued to track the overall jobs total. Lower wage industries while improving with seasonal hiring underway, still lagged the most.
The potential for continued job expansion still is there. In the latest data for March, there were 1.28 million unfilled job openings at the end of the month, only slightly off the previous high of 1.29 million in February. Labor shortages, specifically labor with the requisite skills, continue to be a constraint on turning these openings into operating jobs. The current trends, as discussed below, suggest that requisite skill labor will be an increasing barrier to further job additions in the coming months.
May Revise Economic Projections
The expected course of the economy over those coming months is suggested in the economic projections behind the recently released May Revise for the budget. These projections underlie the revenue expectations over the coming years, but they also reflect the state’s economic expectations under current policy.
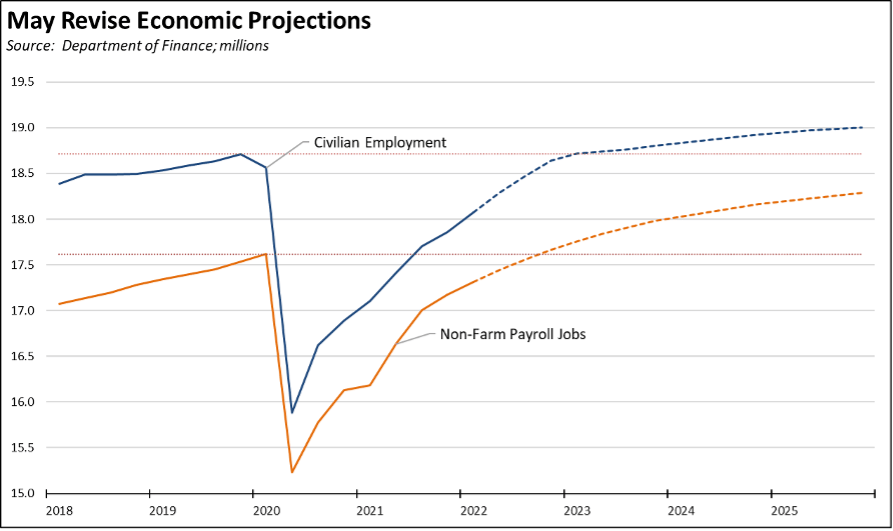
In the Department of Finance analysis, nonfarm jobs are expected to breach the pre-pandemic peak at the end of the year. Employment is expected to do so a quarter later, at the beginning of 2023. The strongest monthly gains contained in the Finance projections will occur prior to those events—continuing to reopen and replace jobs lost to the state-ordered closures.
After those recovery milestones and after the remaining slack in the economy is restored, the projections expect future growth to slow substantially. Nonfarm jobs are projected to go from a monthly average gain of 41,400 in 2022, to 26,100 in 2023 and only 10,700 by 2025. Employment drops more precipitously, going from a monthly average of 65,100 in 2022 to 13,700 in 2023 and only 6,600 in 2025.
Broken out by industry, jobs in Manufacturing, Mining, Wholesale Trade, and Retail Trade are not expected to ever recover to pre-pandemic levels in the forecast period. Measured from the nonfarm jobs recovery point at the end of 2022, net jobs in these and the other blue-collar goods industries (Construction, Transportation & Warehousing) are expected to expand by only 60,500 through the end of 2025.
In the higher and medium wage white collar industries (Information, Financial Activities, Professional, Scientific, Technical Services and Management, Educational Services, Healthcare, and Government), jobs are expected to grow by 281,400, or 45% of total net jobs between 2023 and 2025. On the other end, lower-wage service jobs (Social Assistance, Leisure and Hospitality, Other Services, and Administrative, Waste Management and Remediation) show almost equal projected gains of 280,700, or another 45%.
Put simply, economic projections under current policy are for further economic stratification in the state, growing jobs only at the higher and lower wage levels while restricting through policy choices the key industries that historically provided upward mobility opportunities to bridge the gap in between.
Inflation and the Recovery
The downward revisions in the most recent Finance projections reflect growing uncertainty and economic risks related to a range of factors including inflation, continuing supply chain disruptions now exacerbated by Russia’s war on Ukraine, and labor shortages. Although not reflected in the projections, other risks will arise as state policy continues to drive the economy from one powered primarily from domestic energy supplies, to one that will become heavily reliant on foreign sources highly concentrated within only a few countries and on materials for which global supplies are now projected to run short even before the state completes its intended transition.
The slowing economic growth and the stratified jobs growth shown in the projections, however, are not the economic destiny of the state. They instead are a measure of the outcomes likely to come from the current policy choices being made within the state in the face of these growing challenges. Economic projections are made based on the current and expected policy framework. Other outcomes are possible if those policies change.
As one of the more prominent examples, the May Revise proposed $18.1 billion in direct relief to offset the rising costs currently being fueled by inflation. Those proposals in turn raised questions about whether this approach instead of helping households would add a further push to inflation itself.
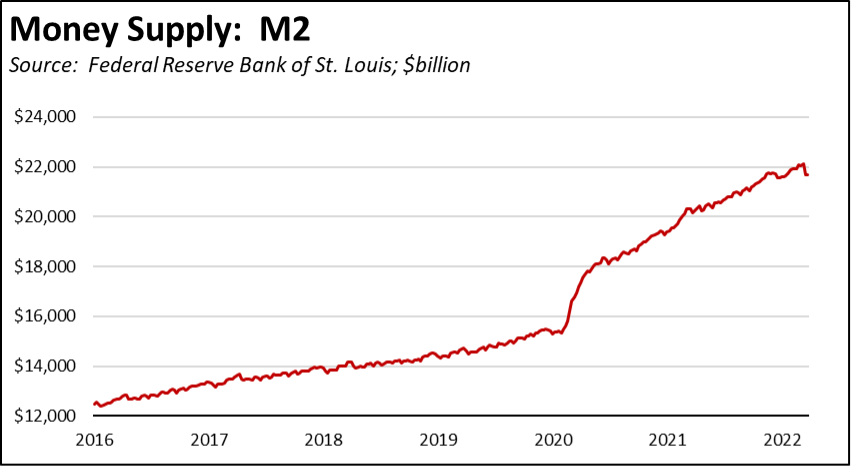
In a broad sense, these questions raise a valid point. In its simplest terms, inflation can come from too much money (demand) chasing too few goods and services. In the current environment, a major source of inflation comes from the phenomenal run-up in deficit spending pursued by the federal government in recent years, as illustrated in the explosive growth in the money supply as measured by the M2 definition of money.
The May Revise proposals consequently have the potential to add to the current inflationary pressures coming from this source. The overall effect, however, is likely to be small overall –$18 billion compared to the $7 trillion increase in money supply over the past 2+ years—but may have an effect on some consumer prices for goods already in short supply or where California regulations constrain market supply to the state only, as in the case of gasoline and various other goods.
The other source of inflation typically comes from rising producer costs, as producers are forced to raise prices to cover increasing costs for labor, materials, components, energy, rent, taxes, fees, and other factors comprising the cost of their sales of goods and services. The supply chain disruptions first generated by the pandemic—due both to import disruption and state-ordered closures of many businesses in the state—and now made worse by the war in Ukraine are a major source of inflationary pressure from this source, both limiting the supply of many goods and services and raising the cost of what is available.
But rising costs of this type are not a new phenomenon in California. Even before the current inflation upswing, California businesses were experiencing rapid increases in the core costs of doing business as the result of state policies and regulations on energy, labor, rents, goods movement, taxes and fees, and other components of their production and operating cost functions. These costs in turn were reflected in growing prices paid by households for housing, transportation, food, and other goods comprising the core costs of living. Even before the current conditions, many California households were forced to restructure their budgets to accommodate these rising prices. The current spike in inflation has only made the situation worse.
The current push to provide assistance to households—as is proposed in the May Revise—is largely being driven by the steep rise in the cost of gasoline, both at the national and state levels. Gasoline often becomes the bellwether product in an inflationary period for a number of reasons. It is often the most visible indicator of inflation consumers experience as they refuel on a weekly or more frequent basis. Cost rises not only feed into a drain on household budgets but into the core production costs leading to price increases in other goods and services. Energy as essentially a fixed component of household consumption tends to crowd out other spending as prices rise.
But the price rise now being experienced nationally and the price rise now generating urgent calls for increased payments to households to provide relief is something Californians went through a year ago. As illustrated in the following chart from our earlier monthly report on energy costs, the rising gasoline prices the rest of the states experienced from May 2021 to the latest results from April 2022 is virtually the same as what happened in California a year earlier, from May 2020 to April 2021. The price increases seen in the past 12 months—as shown in the upper line—in the state have since been much higher, but they began with costs already baked in at levels now leading to calls for national relief.
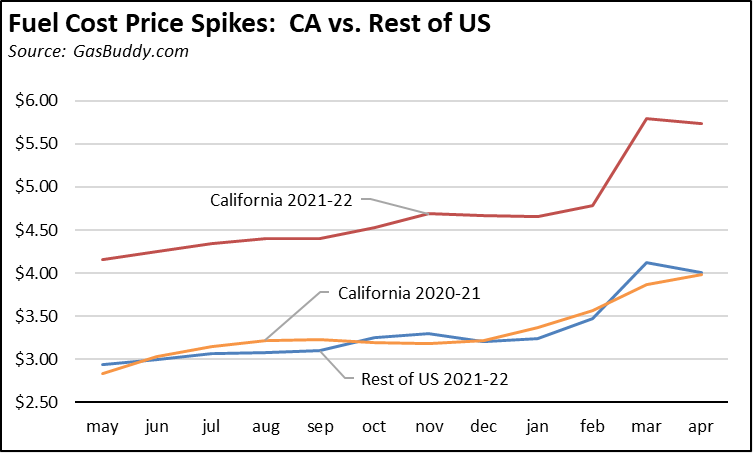
The difference is the source of these cost increases. The national price spikes have come largely as the result of actions by Russia that caused disruptions in global oil and gas supplies. The state price spikes from a year ago and the base of the higher costs now come directly from State policy decisions—regulations that increase the cost of producing gasoline, that wall off the state from other sources of supply, and that will increase the costs further as production is restricted in accordance with the state’s broader energy policies.
But as indicated, gasoline currently is only the most visible component in the rising cost of living. The costs of production and of supplying many goods and services are much higher in California because of regulations causing them to increase, not only gasoline but other energy sources, labor, rents, and other components that feed directly into the prices that businesses must charge.
California is not just a high regulation state. It is by far the highest regulation state, and the number of rules that end up affecting the prices households must pay for everything continue to grow every year. Measured by the number of words in its code of regulations, California is 26% higher than Texas, nearly twice as high as Florida, and nearly five times as high as the states imposing the least number of restrictions. California more than any other state has made its economy dependent on decisions made by its state and local bureaucracies, and the prices eventually paid by households rely heavily on those bureaucracies getting every one of those decisions right.
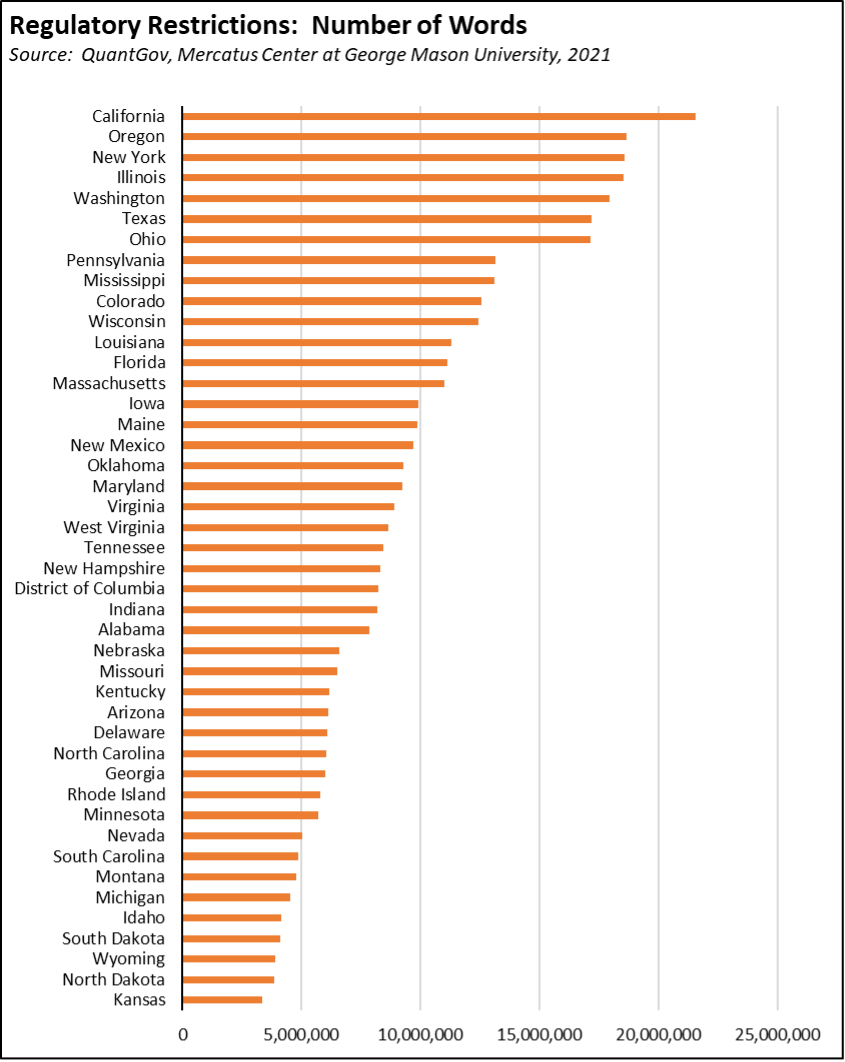
(Note that in the table above, all data is from 2021 and does not cover 7 of the states.)
The more critical question with the May Revise proposals is that they provide only temporary and partial relief to the rising prices that are now straining budgets for both households and employers. They are made possible by an unprecedented upsurge in state revenues combined with the Gann spending limits that mandate that they be spent in this or similar manner. And once spent, the relief is gone, but the inflationary pressures driven by state policies will continue.
The inflationary costs Californians have experienced in recent years, experience more severely at the moment, and will continue facing in the coming years are being driven more directly by deliberate policy decisions creating these conditions. The May Revise offers temporary and partial relief from one-time surplus funds. More lasting relief instead will come only from policy reforms to get at the underlying causes and future regulatory procedures that place greater concern on the cumulative costs to households and to the structure of jobs growth that can evolve in this state.
Recession Risks Before Recovery
Current economic conditions, however, are beginning to suggest that the Finance projections may become too optimistic as concerns over another round of recession increase.
In California’s case, these risks could arise in two different ways: (1) a broader recession affecting more of the state and (2) a more restricted downturn affecting primarily the tech industry as was the case with the Dot.Com recession at the beginning of the century but with more severe effects on state GDP, personal income, and budget revenues.
The stratified job growth contained in the Finance projections reflects the broader economy that has evolved under the state’s regulatory and tax policies. In this process, the state has consequently become heavily dependent on the economic performance of a single region, the Bay Area, and more consequently on the health of a single industry, the tech industry. The Bay Area with 19.6% of the population in pre-pandemic 2019 produced 23.6% of nonfarm jobs, 32.9% of GDP, and 42.8% of the personal income tax revenues that provide about two-thirds of the state general fund.
The current downturn in the stock market by itself carries the risk of substantially reduced capital gains on which the recent state budget surpluses have relied. More specifically, the drop in tech stock prices has undermined potential IPO valuations, cutting into the other primary capital gains source.
And while California is likely to retain a strong tech presence, especially among the larger established firms, our CaliFormer series has previously tracked some moves by even these companies to diversify the geographical base of their operations. More critically, however, there are indications that current conditions are beginning to weigh more heavily on the smaller new venture component capable of evolving into the larger established firms of the future:
- Tech companies are beginning to lay off workers in cost savings moves, although a number of the larger layoffs announced to date in 2022 appear to affect companies in other states more than in California.
- A recent presentation by leading VC firm Sequoia Capital recommended investors shift quickly to moves to cut costs and conserve cash to prepare for a “pending economic downturn that will last much longer and be more severe than what happened at the outset of the Covid-19 pandemic.”
- Former Cisco CEO/Chairman John Chambers in a recent interview suggested that going forward, tech startups will increasingly shift to other states due to the economic burden of trying to begin here:
The cost of living here has become very, very expensive. The big four or five tech players in the region are spending almost obscene amounts of money on their employees because they can afford to. But the average startup cannot afford that. That will prompt more startups to move the majority of their workforce outside Silicon Valley.
. . . Almost every startup is thinking about locating the majority of its employees — over time — outside of California.
. . . When your employees are located outside of the state, that means the next generation of companies will also be created wherever they are now.
CaliFormer Businesses: Update
Additional CaliFormer companies identified since our last monthly report are shown below. Companies listed below include those that have announced: (1) moving their headquarters or full operations out of state, (2) moving business units out of state (generally back office operations where the employees do not have to be in a more costly California location to do their jobs), (3) California companies that expanded out of state, and (4) companies turning to permanent telework options, leaving it to their employees to decide where to work and live. The list is not exhaustive but is drawn from a monthly search of sources in key cities.
| wdt_ID | Companies | From | To | Reason | Source | Year |
|---|---|---|---|---|---|---|
| 167 | Aspen Creek Power | El Segundo | Texas | Longbow Solar 113 MW project | Read More | 2022 |
| 168 | Aviatrix | Santa Clara | Dallas | HQ move | Read More | 2022 |
| 169 | Chem-Energy | Garden Grove | Texas | $1 billion solar/battery complex | Read More | 2022 |
| 170 | HBCU HUB | Carson | Texas | HQ move | Read More | 2022 |
| 171 | Hyundai | Fountain Valley | Georgia | $6.5 billion electric vehicle manufacturing complex | Read More | 2022 |
| 172 | Intel | Santa Clara | Oregon | Data Center expansion | Read More | 2022 |
| 173 | Mothership Technologies | Los Angeles | Austin | HQ move | Read More | 2021 |
| 174 | Netflix | Los Gatos | Albuquerque | $1 billion studio expansion | Read More | 2022 |
| 175 | Ownwell | Santa Monica | Austin | HQ move | Read More | 2022 |
| 176 | Ruiz Foods | Dinuba | Texas | Co-HQ | Read More | 2022 |
| 177 | Samsung | San Jose | Indiana | $2.5 billion battery plant in joint venture with Stellantis | Read More | 2022 |
| 178 | West Marine | Santa Cruz | Florida | HQ move | Read More | 2022 |
| Companies | From | To | Reason | Source | Year |
CaliFormers: Population Drops Two Years in a Row
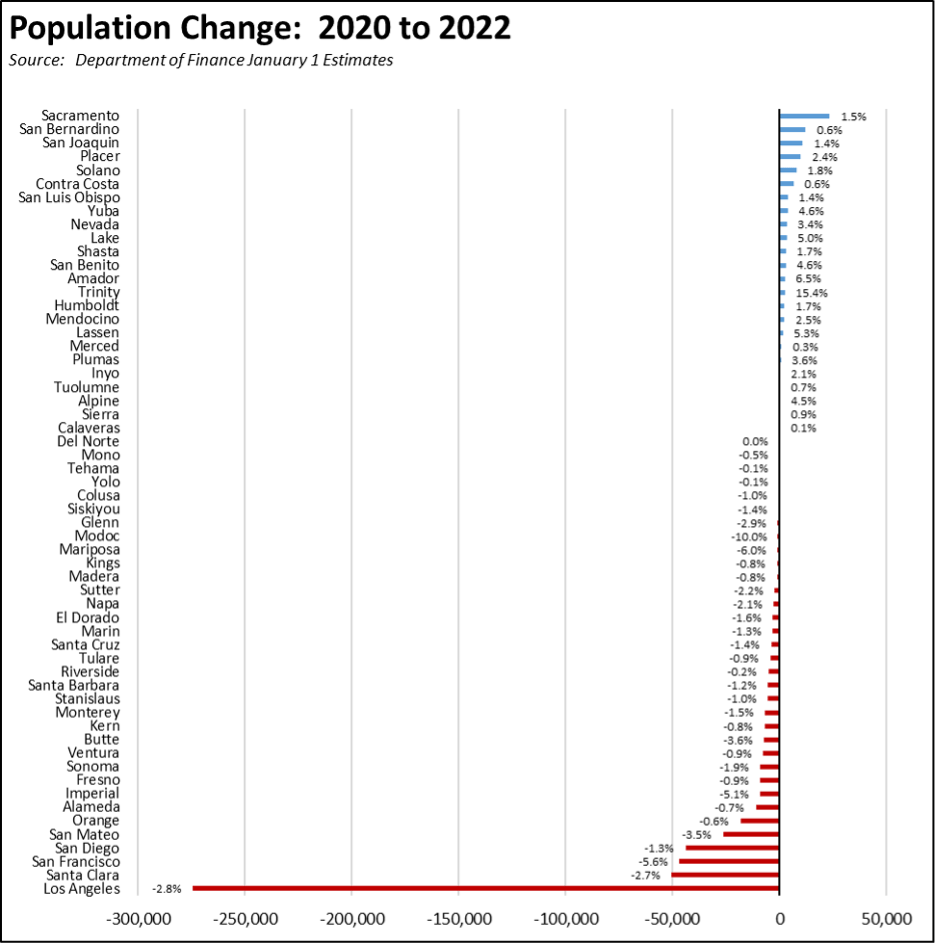
The recent Department of Finance population estimates show California losing population two years in a row, reversing a previously unbroken trend of population growth. Total population decline was a loss of 463,333. A total of 34 counties lost population, led by Los Angeles County with a loss of 274,390 or 59% of the total net loss. The remaining 24 counties showed a population gain in the two-year period.
NonFarm Jobs: 240k Below Pre-Covid Peak
Nonfarm wage and salary jobs were up 41,400 (seasonally adjusted) in April, while gains in March were revised to 74,400 from the previously reported 60,200.
California showed the third highest monthly increase, behind Texas at 62,800 and Florida at 58,600. The number of states above the February 2020 pre-pandemic peak increased from 13 to 14. California remains 239,900 behind or 20.2% of the remaining national shortfall.
Job Change by Industry
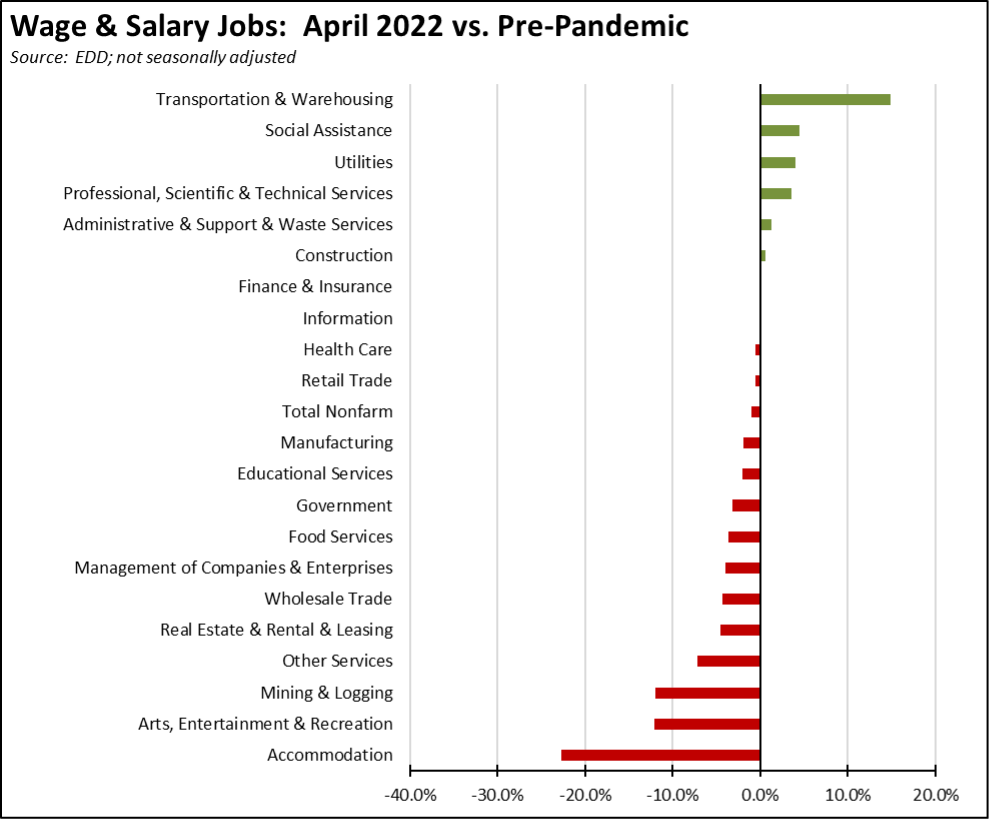
Using the unadjusted numbers that allow a more detailed look at industry shifts, the number of industries showing job levels at or exceeding the pre-pandemic February 2020 levels based on the revised data rose from 5 to 8, but with 4 of these in the “barely above” category. Transportation & Warehousing by a substantial margin shows the strongest growth as companies continue to battle the ongoing supply chain disruptions. The biggest lags in recovery continue to be the lower-wage industries that were hardest hit by the state-ordered closures along with Mining & Logging that is being targeted for job losses under current state policies.
Job Openings Remain High
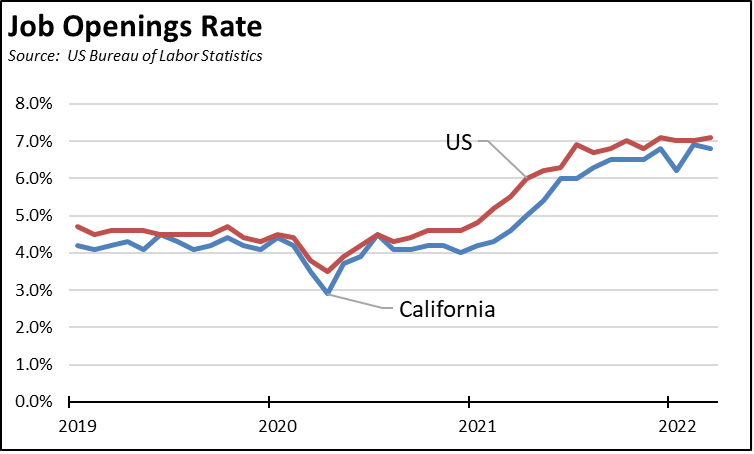
Even with the improved employment numbers, labor shortages continue to weigh on job growth prospects within the state. The number of unfilled job openings at the end of March stood at 1.279 million, only marginally off the previous high of 1.286 million in February. Measured by the Job Openings Rate (job openings divided by total nonfarm jobs), the job potential in the months ahead remains somewhat behind but close to the US as a whole at 6.8% vs. 7.1% in March.
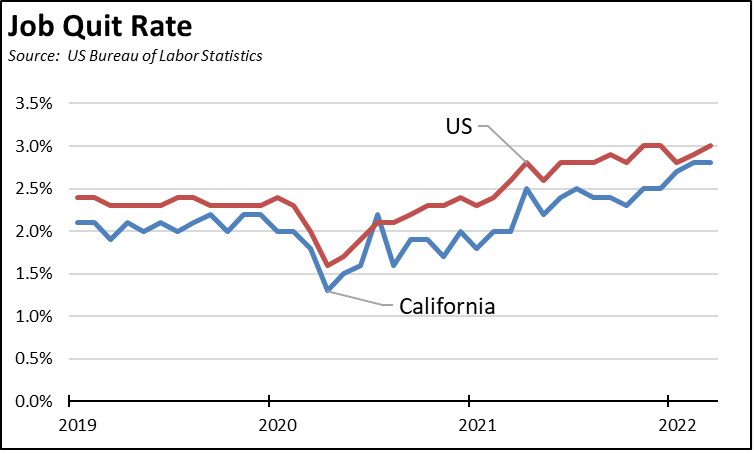
The number of workers quitting their jobs remains somewhat elevated, but with California trending somewhat lower due to the built-in risk aversion coming from the state’s high costs of living, although the gap has narrowed as labor shortages continue to bid wages up higher. California’s job quit rate (job quits divided by total nonfarm jobs) was 2.8%
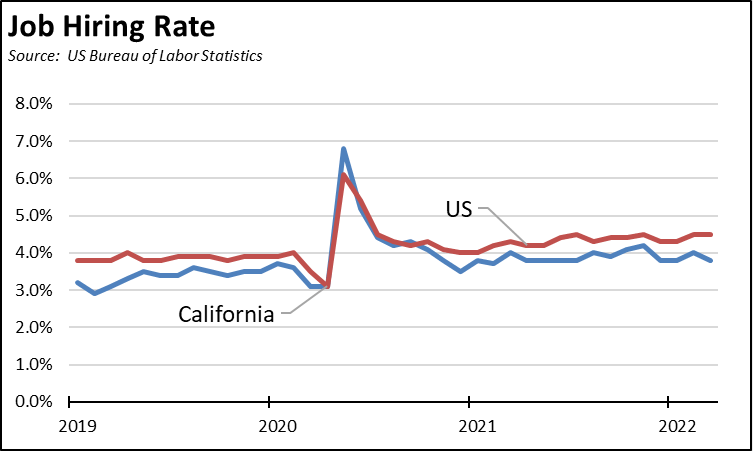
Quits continue to be offset by hires, however, but with California beginning to trend lower likely as the result of an increase in the mismatch between jobs and available skills as well as increasing labor costs in the state. California’s job hiring rate (job hires divided by total nonfarm jobs) was 3.8% vs. the US at 4.5%.
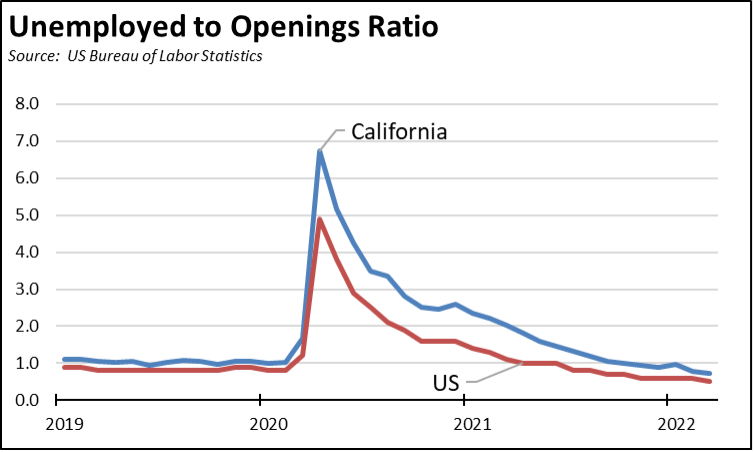
Overall labor shortages are reflected in the final chart, showing the ratio of the number of unemployed to the number of unfilled job openings. California in much of the recovery period trailed the US by this measure due to the much higher employment impacts arising out of the state’s job closures, especially on lower wage, lower-skilled workers. This gap has since narrowed especially with the pick up in the employment numbers in recent months, with both the state and the US trending towards labor markets as a tighter constraint on jobs expansion potential in the rest of the year.
Employment 386k Below Pre-Covid Level
EDD reported that employment (seasonally adjusted; April preliminary) was up 150,000 from the revised March numbers. The number of unemployed was down 38,300.
The reported unemployment rate improved 0.2 point to 4.6%, compared to the revised 4.1% in February 2020 prior to the pandemic. California tied with Illinois for the 6th highest unemployment rate among the states. California contained 15.0% of the total number of unemployed workers in the US.
In the national numbers, total US employment dipped 353,000, and the number of unemployed was largely unchanged, notching down by 11,000. The reported unemployment rate was unchanged at 3.6%, just above the 3.5% rate recorded in February 2020.
Figure Sources: California Employment Development Department; US Bureau of Labor Statistics
In the seasonally adjusted numbers, California employment remains 385,800 (2.1%) below the pre-pandemic level in February 2020; the US as a whole was only 0.5% below.
Unemployment Insurance Initial Claims Edge Above Pre-Pandemic Average in California
Within the 5-week period ending the week of May 14, initial claims in California dipped briefly to 40,624, before returning to the Mid-April level at 46,985. The average in this period was 9% above the pre-pandemic level in 2019. For the US as a whole, average claims were about 9% below. For the 5 weeks ending the week of May 14, California claims were 22% of the national total, while insured unemployment (a proxy for continuing claims) through the week of May 7 was 25% of the total.
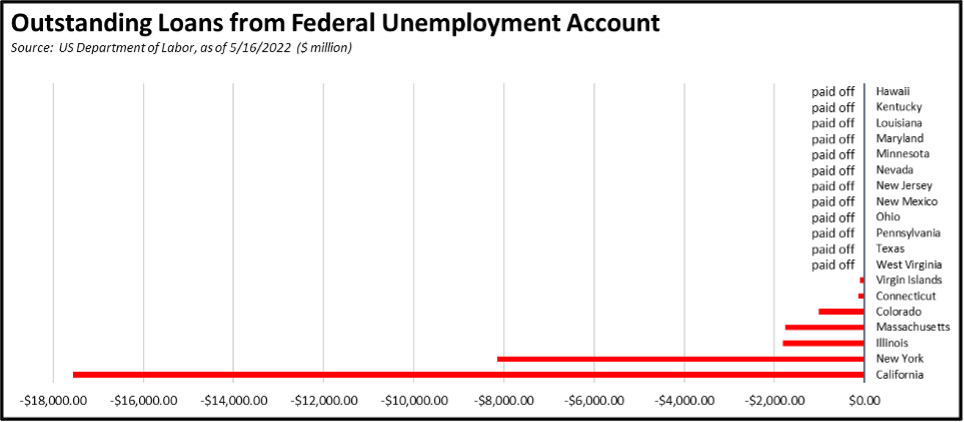
As of May 18, California became even more of an outlier as another three states paid off their debt to the federal unemployment insurance fund debt. California’s debt to the fund was $17.6 billion, or 58% of the total owed by all the states and territories. Minnesota paid its debt with its remaining federal pandemic assistance funds. Colorado is still looking to do the same. Over the past year, 12 states have paid off their federal debt in order to minimize tax increases on their businesses during the difficult recovery period and to rebuild their funds in order to maintain this critical assistance program in the event of another recession.
Labor Force Participation Rate
The labor force participation rate rose 0.4 point to 62.1%, while the US number dipped 0.2 point to 62.2%. The California rate remains well below the pre-pandemic level of 62.8%, which in turn was down substantially from prior years. Accounting for workers leaving the workforce since February 2020 under the revised data, there were an estimated 1.1 million out of work in April.
Unemployment Rates by Legislative Districts
The highest and lowest estimated unemployment rates in April are shown below. The estimates are for the current, 2012 vintage districts. Estimates for the new districts under the 2022 redistricting will be released after the required factors from the American Community Survey become available at the end of the year.
Lowest
Highest
Unemployment Rates by Region
Unemployment rates (not seasonally adjusted) compared to pre-pandemic February 2020 are shown below.
Figure Source: California Unemployment Development Department
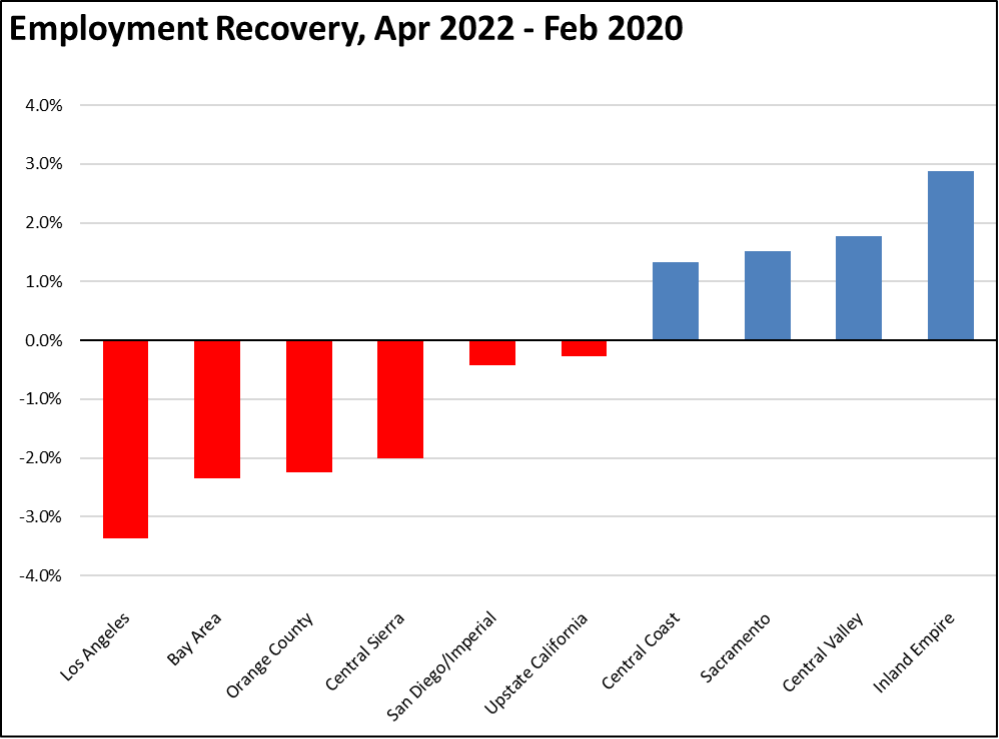
Employment Recovery by Region
In part reflecting migration patterns during the pandemic, the interior regions of the state show employment above pre-pandemic levels. Los Angeles, which saw some of the deepest job losses due to its increasing incidence of lower-wage service jobs, remains the furthest behind.
MSAs with the Worst Unemployment Rates
California again had 11 of the MSAs among the 25 regions with the worst unemployment rates in March, including El Centro MSA (Imperial County) with the worst unemployment rate in the nation. Los Angeles-Long Beach-Anaheim MSA remained out of this group, dropping to #304 in a tie with 9 other MSAs in other states. The best performing California urban region was again San Jose-Sunnyvale-Santa Clara MSA tied with 14 other MSAs at #38, with an unemployment rate of 2.5% compared to the best performing MSA, Logan, UT-ID MSA at 1.7%.