Highlights for policy makers:
- Unemployment Rate Declines to 6.1%; Total Employment Rises 12,200
- State Employment Growth Rankings
- Labor Force Participation Rate Declines to 62.3%
- Nonfarm Jobs Increase 36,300
- 6 Industries Remain Below 2007 Pre-Recession Job Levels
- 3 Counties Remain in Double-Digit Unemployment, 12 are 5% or Less
- 9 California MSAs in Nation’s 10 Worst Unemployment Rates
- Two-Tier Economy Persists
Unemployment Rate Declines to 6.1%; Total Employment Rises 12,200
The Labor Force data for August 2015 (seasonally adjusted; California preliminary) is shown below, along with the change from the prior month:
| Seasonally Adjusted | California | US | ||
|---|---|---|---|---|
| Aug 2015 | Change from Jul 2015 | Aug 2015 | Change from Jul 2015 | |
| Unemployment Rate | 6.1 | -0.1 | 5.1 | -0.2 |
| Labor Force | 19,035,200 | 0.0% | 157,065,000 | 0.0% |
| Participation Rate | 62.3 | -0.1 | 62.6 | 0.0 |
| Employment | 17,872,100 | 0.1% | 149,036,000 | 0.1% |
| Unemployment | 1,163,100 | -1.4% | 8,029,000 | -2.9% |
The related not seasonally adjusted numbers (California preliminary), with the change from August 2014
| Not Seasonally Adjusted | California | US | ||
|---|---|---|---|---|
| Aug 2015 | Change from Aug 2014 | Aug 2015 | Change from Aug 2014 | |
| Unemployment Rate | 6.1 | -1.5 | 5.2 | -1.1 |
| Labor Force | 19,071,900 | 1.1% | 157,390,000 | 0.6% |
| Participation Rate | 62.5 | 0.0 | 62.7 | -0.3 |
| Employment | 17,905,300 | 2.7% | 149,228,000 | 1.8% |
| Unemployment | 1,166,600 | -18.7% | 8,162,000 | -16.6% |
California Employment Development Department’s (EDD) latest release shows on a seasonally adjusted basis, total employment grew by 12,200 from July, while the number of unemployed dropped by 16,600. California’s seasonally adjusted unemployment rate notched down from 6.2% in July to 6.1% in August. The unadjusted rate decreased from 7.6% in August 2014 to 6.1% in August 2015.
Total US employment saw a seasonally adjusted increase of 196,000, while the number of unemployed dropped 237,000.
As on the national level, California’s labor force remained little changed, with improvement to the unemployment rate caused by the unemployment numbers moving into the employed column as well as leaving the labor force.
State Employment Growth Rankings
California’s seasonally adjusted unemployment rate was 19.6% higher than the national rate. Tied with Oregon, California had the 9th highest unemployment rate among the states (including DC).
| Rank | Number of Employed | Percentage Change | Population Adjusted (employment growth per 1,000 civilian noninstitutional population) |
|---|---|---|---|
| 1 | CA 425,229 | MS 4.9% | MS 24.2 |
| 2 | NY 159,057 | AR 3.6% | ID 20.4 |
| 3 | NC 121,361 | ID 3.4% | DC 19.7 |
| 4 | TN 93,512 | OK 3.4% | OK 19.4 |
| 5 | WA 67,348 | TN 3.4% | AR 19.0 |
| 6 | IN 64,902 | NV 3.1% | RI 18.9 |
| 7 | MD 64,895 | RI 3.1% | NV 18.3 |
| 8 | MI 63,891 | DC 3.1% | TN 18.3 |
| 9 | AZ 61,840 | DE 3.0% | DE 17.1 |
| 10 | SC 58,987 | SC 2.9% | UT 17.0 |
| 11 | MA 57,085 | NC 2.8% | NC 15.8 |
| 12 | OK 57,085 | UT 2.6% | SC 15.6 |
| 13 | PA 56,463 | CA 2.4% | CA 14.1 |
| 14 | MS 55,082 | MD 2.2% | MD 13.8 |
| 15 | GA 50,991 | MT 2.2% | MT 13.3 |
| 16 | IL 44,254 | AZ 2.1% | IN 12.7 |
| 17 | AR 43,471 | IN 2.1% | CT 12.6 |
| 18 | NV 40,606 | WA 2.1% | WA 12.2 |
| 19 | NJ 36,549 | CT 2.1% | AZ 11.9 |
| 20 | CT 36,264 | NY 1.8% | MD 10.6 |
| US 2,585,000 | US 1.8% | US 10.3 |
Between August 2014 and August 2015, Bureau of Labor Statistics (BLS) data shows the total number of employed in California increased by 425,229 (seasonally adjusted), or 16.4% of the total net employment gains in this period for the US. Measured by percentage change in employment over the year, California was 13th highest. Adjusted for population, California was also 13th. While California remains above the US average in all three measures for overall employment growth, the last two measures which take into account the relative size of the states indicates that California continues to lie in the second quartile.
Labor Force Participation Rate Remains at 62.3%
California’s participation rate (seasonally adjusted) declined 0.1% to 62.3%. The comparable US rate remained steady at 62.6%.
California’s seasonally adjusted labor force participation rate has now hovered between 62.3% and 62.5% for 25 months, or an overall average rate of 62.4%. In the pre-recession period, California last experienced a rate this low in 1976. While employment continues to grow in absolute terms, the economy still has not reached the point of inducing re-entry back into the labor force for a significant share of the working-age population. By reducing the number of incomes per household, this situation continues to be major factor in the state’s continuing high levels of poverty and declining housing affordability.
Nonfarm Jobs Increase 36,300
EDD reported that between July and August 2015, seasonally adjusted nonfarm payroll jobs increased by 36,300. The July job gains were revised downwards marginally from the preliminary estimate of 84,600 to 84,400.
Looking at the not seasonally adjusted numbers, the change in nonfarm payroll jobs from July 2015 saw the largest increases in Government (36,500) as schools began reopening for the academic year, Individual & Family Services (11,200) as a result of continued expansion of the State’s In-Home Supportive Services program, Accommodation & Food Service (9,900), and Construction (7,900). Biggest declines were in Educational Services (-3,200), Other Services (-3,100), Professional, Technical & Scientific Services (-2,600), and Administrative & Support & Waste Services (-1,500).
| Not Seasonally Adjusted Payroll Jobs | Jul 2015 | Aug 2015 | Change Aug 2015 – Jul 2015 | Change Aug 2015 – Aug 2014 |
|---|---|---|---|---|
| Total Farm | 468,200 | 469,200 | 1,000 | -900 |
| Mining & Logging | 29,900 | 29,800 | -100 | -2,500 |
| Construction | 735,100 | 743,000 | 7,900 | 44,600 |
| Manufacturing | 1,286,400 | 1,290,100 | 3,700 | -1,200 |
| Wholesale Trade | 739,100 | 740,000 | 900 | 21,400 |
| Retail Trade | 1,659,800 | 1,663,800 | 4,000 | 31,900 |
| Transportation, Warehousing & Utilities | 542,800 | 545,900 | 3,100 | 19,000 |
| Information | 472,800 | 473,800 | 1,000 | 12,000 |
| Finance & Insurance | 522,300 | 522,700 | 400 | 2,300 |
| Real Estate & Rental & Leasing | 279,000 | 278,900 | -100 | 9,500 |
| Professional, Scientific & Technical Services | 1,278,100 | 1,275,500 | -2,600 | 81,200 |
| Management of Companies & Enterprises | 231,200 | 232,400 | 1,200 | 7,300 |
| Administrative & Support & Waste Services | 1,077,000 | 1,075,000 | -1,500 | 36,700 |
| Educational Services | 336,700 | 333,500 | -3,200 | 6,400 |
| Health Care & Social Assistance | 2,115,600 | 2,126,800 | 11,200 | 56,000 |
| Individual & Family Services | 574,200 | 580,100 | 5,900 | 2,100 |
| Arts, Entertainment, & Recreation | 302,700 | 303,200 | 500 | 15,900 |
| Accommodation & Food Service | 1,562,600 | 1,572,500 | 9,900 | 61,800 |
| Other Services | 552,200 | 549,100 | -3,100 | 4,400 |
| Government | 2,299,600 | 2,336,100 | 36,500 | 30,800 |
| Total Nonfarm | 16,022,900 | 16,092,600 | 69,700 | 437,500 |
| Total Wage & Salary | 16,491,100 | 16,561,800 | 70,700 | 436,600 |
By total number of new jobs, California had the highest increase in seasonally adjusted nonfarm jobs among the states from August 2014 to August 2015, at 470,000 or 16.1% of the US total. By percentage growth in jobs, California was the 7th highest, and by population adjusted jobs growth, 8th highest.
| Rank | Number of Jobs | Percentage Change | Population Adjusted (job growth per 1,000 civilian noninstitutional population) |
|---|---|---|---|
| 1 | CA 470,000 | UT 4.0% | DC 25.4 |
| 2 | FL 261,500 | OR 3.5% | UT 24.9 |
| 3 | TX 217,700 | FL 3.3% | OR 18.6 |
| 4 | NY 130,500 | NV 3.3% | NV 17.9 |
| 5 | NC 107,200 | WA 3.2% | WA 17.8 |
| 6 | WA 99,500 | SC 3.0% | MA 16.4 |
| 7 | MI 91,300 | CA 3.0% | FL 16.1 |
| 8 | MA 90,200 | ID 2.9% | CA 15.4 |
| 9 | GA 83,200 | MA 2.6% | ID 15.4 |
| 10 | IN 75,600 | NC 2.6% | SC 15.3 |
| US 2,919,000 | US 2.1% | US 11.6 |
6 Industries Remain Below 2007 Pre-Recession Job Levels
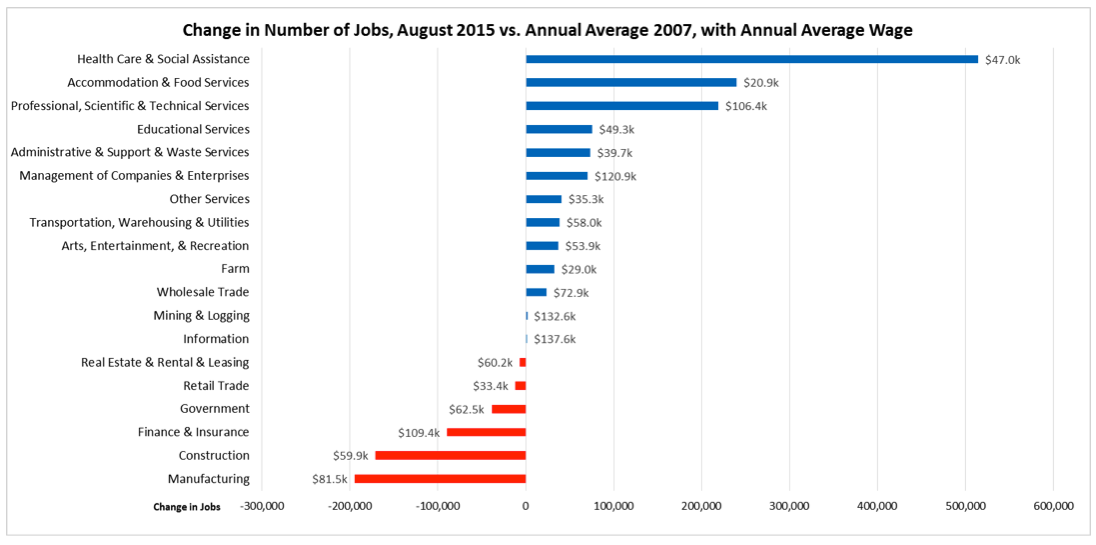
Comparing the number of jobs by industry in August 2015 (seasonally adjusted), 6 industries remain below the 2007 pre-recession levels. Note that from the not seasonally adjusted data, over half of the Health Care & Social Assistance net jobs shown in the chart are attributable to Individual & Family Services, the industry dominated by In-Home Supportive Services and paying only $14,700 average annual wages. Also note that the Government job numbers are influenced by the seasonal employment factors in education.
3 Counties Remain in Double-Digit Unemployment, 12 are 5% or Less

9 California MSAs in Nation’s 10 Worst Unemployment Rates
In the BLS ranking of the nation’s 387 Metropolitan Statistical Areas (MSA) by August 2015 unemployment rate, 9 California MSAs rank in the bottom 10.
| US Rank | MSA | Unemployment Rate, Aug 2015 |
|---|---|---|
| 378 | Modesto, CA MSA | 9.4% |
| 379 | Yuba City, CA MSA | 9.5% |
| 380 | Fresno, CA MSA | 9.6% |
| 381 | Hanford-Corcoran, CA MSA | 9.8% |
| 382 | Madera, CA MSA | 9.9% |
| 383 | Bakersfield, CA MSA | 10.0% |
| 384 | Merced, CA MSA | 10.8% |
| 385 | Visalia-Porterville, CA MSA | 11.7% |
| 386 | El Centro, CA MSA | 24.2% |
| 387 | Yuma, AZ MSA | 26.6% |
The highest ranked California MSA—San Jose-Sunnyvale-Santa Clara MSA—tied with 9 other MSAs nationally at rank 66 with an unemployment rate of 4.3%.
Two-Tier Economy Persists
Unemployment rates (all data is not seasonally adjusted) continue to vary widely across the state, ranging from 4.5% in the Bay Area to more than double at 9.8 in the Central Valley.
| Not Seasonally Adjusted | Unemployment Rate (%) June 2015 |
|---|---|
| California | 6.1 |
| Bay Area | 4.3 |
| Orange County | 4.5 |
| Sacramento Region | 5.7 |
| Central Coast | 5.7 |
| San Diego/Imperial | 6.0 |
| Central Sierra | 6.1 |
| Inland Empire | 6.8 |
| Los Angeles | 6.8 |
| Upstate California | 7.1 |
| Central Valley | 9.1 |
Ratio of Highest to Lowest Rate: 2.14
By County:
| Lowest 3 Unemployment Rates | |
|---|---|
| San Mateo County | 3.3 |
| Marin County | 3.5 |
| San Francisco County | 3.6 |
| Highest 3 Unemployment Rates | |
|---|---|
| Colusa County | 10.2 |
| Tulare County | 11.0 |
| Imperial County | 23.7 |
| Highest 3 Unemployment Rates | Lowest 3 Unemployment Rates | ||
|---|---|---|---|
| San Mateo County | 3.3 | Colusa County | 10.2 |
| Marin County | 3.5 | Tulare County | 11.0 |
| San Francisco County | 3.6 | Imperial County | 23.7 |
Ratio of Highest to Lowest Rate: 7.18
By Legislative District:
| Lowest 10 Unemployment Rates | |||
|---|---|---|---|
| SD 13 (Hill – D) | 3.2 | AD 22 (Mullin – D) | 3.1 |
| SD 11 (Leno – D) | 3.6 | AD 24 (Gordon – D) | 3.3 |
| SD 37 (Moorlach – R) | 3.8 | AD 16 (Baker – R) | 3.3 |
| SD 39 (Block – D) | 4.2 | AD 28 (Low – D) | 3.4 |
| SD 15 (Beall – D) | 4.2 | AD 19 (Ting – D) | 3.6 |
| SD 36 (Bates – R) | 4.3 | AD 17 (Chiu – D) | 3.6 |
| SD 07 (Glazer – D) | 4.5 | AD 77 (Maienschein – R) | 3.7 |
| SD 10 (Wieckowski – D) | 4.6 | AD 74 (Harper – R) | 3.8 |
| SD 02 (McGuire – D) | 4.6 | AD 73 (Brough – R) | 3.8 |
| SD 38 (Anderson – R) | 5.0 | AD 68 (Wagner – R) | 3.8 |
| Highest 10 Unemployment Rates | |||
|---|---|---|---|
| SD 18 (Hertzberg – D) | 7.8 | AD 53 (Santiago – D) | 8.4 |
| SD 30 (Mitchell – D) | 7.9 | AD 59 (Jones-Sawyer – D) | 8.4 |
| SD 05 (Galgiani – D) | 8.1 | AD 36 (Lackey – R) | 8.7 |
| SD 33 (Lara – D) | 8.1 | AD 13 (Eggman – D) | 8.7 |
| SD 24 (de León – D) | 8.1 | AD 21 (Gray – D) | 10.0 |
| SD 35 (Hall – D) | 8.2 | AD 64 (Gipson – D) | 10.1 |
| SD 16 (Fuller – R) | 8.3 | AD 31 (Perea – D) | 10.4 |
| SD 12 (Cannella – R) | 8.5 | AD 26 (Mathis – R) | 10.7 |
| SD 40 (Hueso – D) | 10.0 | AD 32 (Salas – D) | 11.0 |
| SD 14 (Vidak – R) | 11.6 | AD 56 (Garcia – D) | 14.2 |
Ratio of Highest to Lowest Rate: Senate 3.68
Ratio of Highest to Lowest Rate: Assembly 4.63
Note: All data sources, methodologies, and historical data series available at CenterforJobs.org.