The Center for Jobs and the Economy has released our initial analysis of the August Employment Report from the California Employment Development Department.
While the August job numbers were generally positive, they again remained at levels keeping California’s recovery behind much of the rest of the country. The employment numbers, however, remained less positive, again reflecting the significantly higher share of workers in the state who have yet to return to a job.
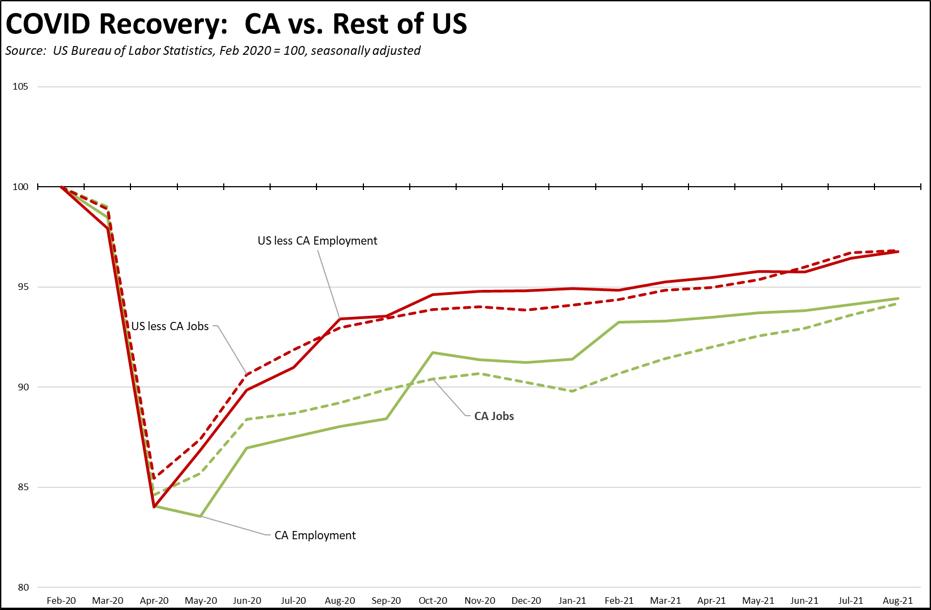
As indicated in the chart, the number of jobs closed due to government actions during the pandemic were only slightly deeper in the state compared to the rest of the nation. Employment losses—the workers—were more severe in part to the additional losses coming from elimination of self-employment alternatives under AB 5. The pace of recovery, however, in both cases was significantly slower in part due to uncertainty in many of the state and local actions, and the renewed state closures towards the end of 2020. California’s job results consequently have improved since the beginning of the year as the state restrictions under the county tier system were first relaxed and then removed in June, but much of this performance instead reflects California “catching up” to the recovery provisions in other states instead allowed to occur during much of 2020. Year to date, California has seen a rise of 694,200 jobs, 14.9% of the US total or somewhat better than the pre-pandemic 11.9% of total non-farm jobs.
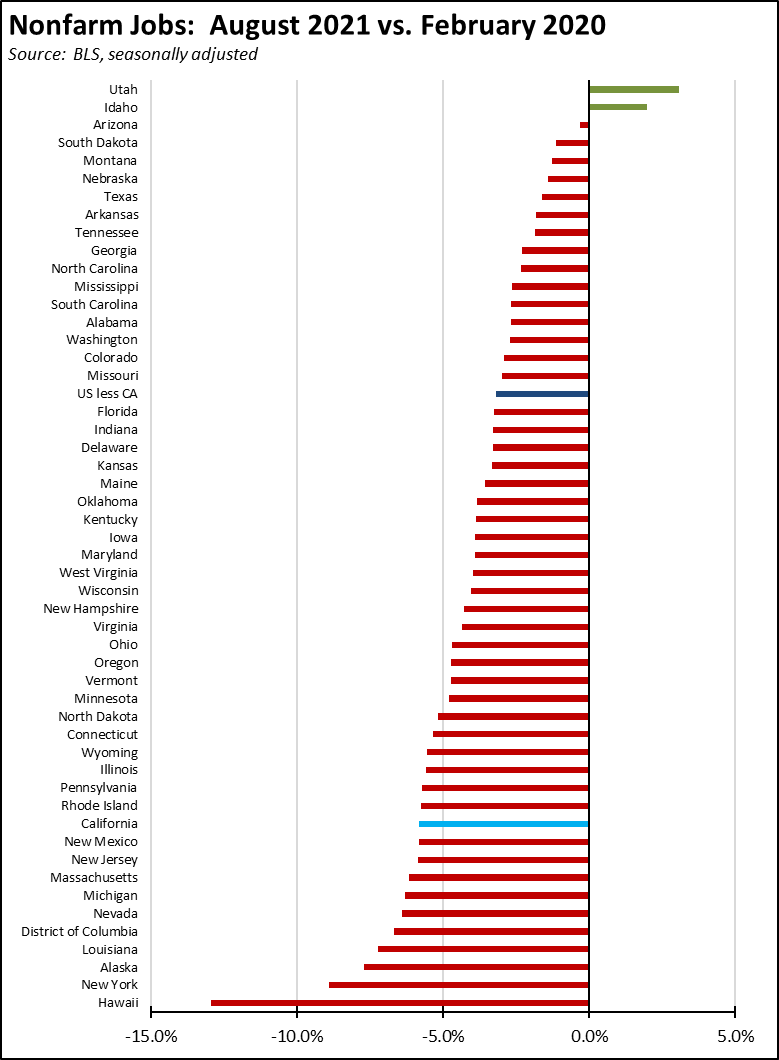
Viewed by state, California ranks 11th in its current recovery level compared to the pre-pandemic job level, while two states have moved into a growth phase.
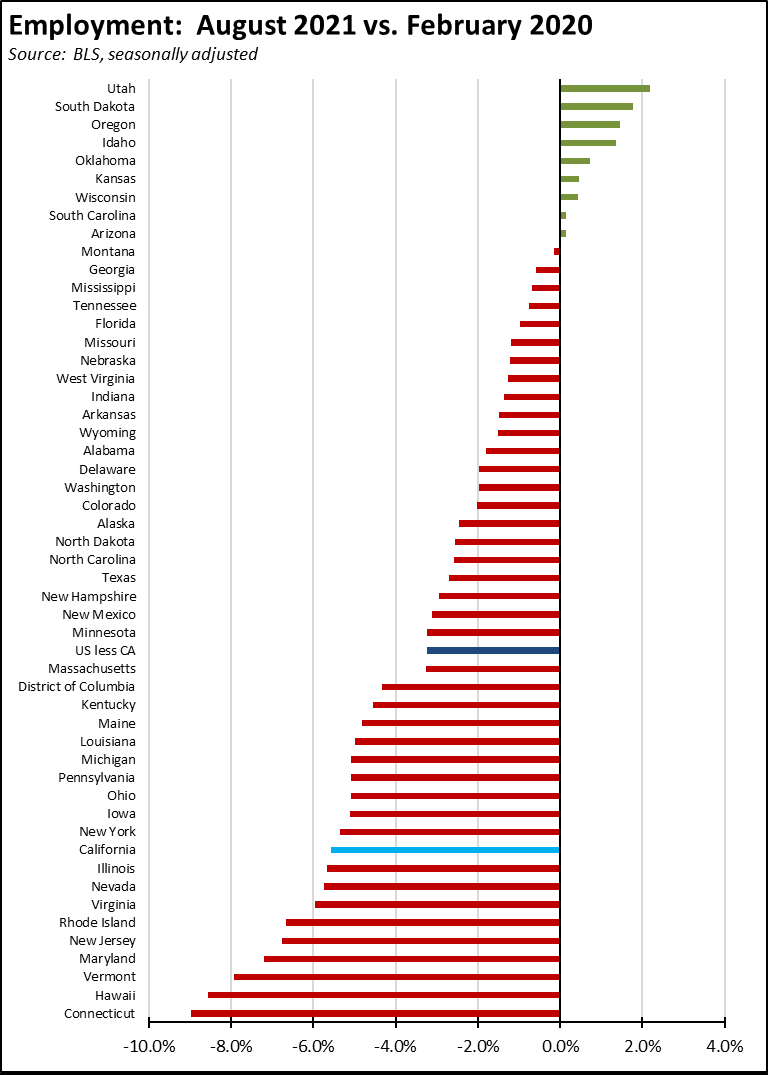
Measured by employment, 9 states have moved to growth while California ranks the 10th lowest.
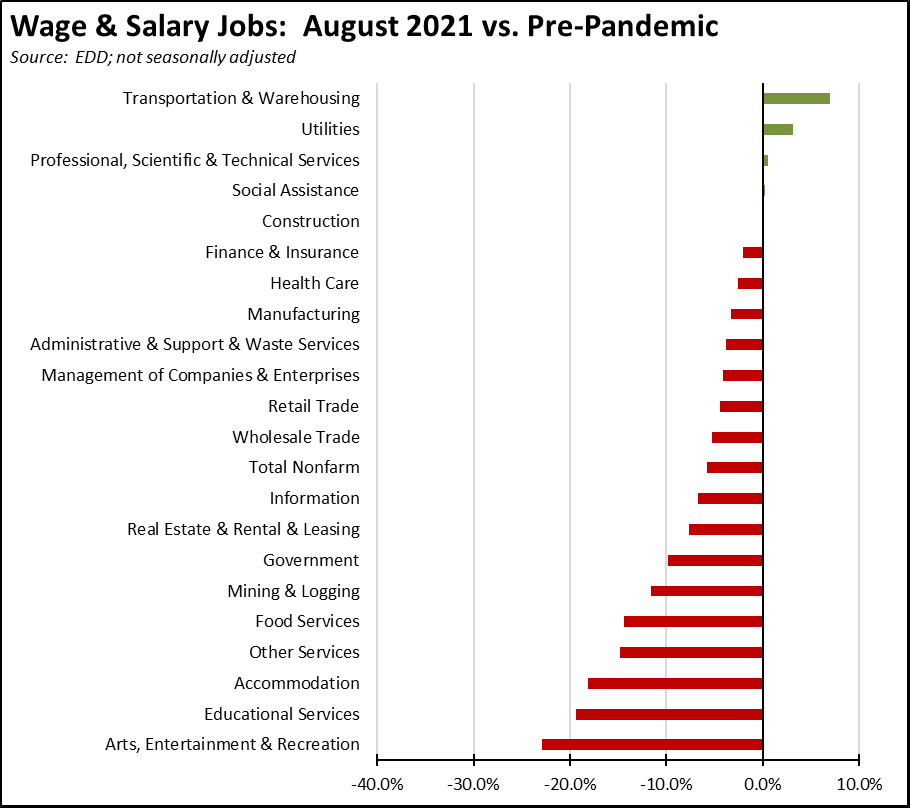
Most parts of the state’s economy remain in the recovery stage. Transportation & Warehousing, Utilities, Professional, Scientific & Technical Services and state-supported jobs in Social Assistance have moved to the growth stage. The bulk of the state’s industries still face a prolonged period of regaining lost ground, and some—as reflected the most current Department of Finance projections—are likely to never recover to prior levels as the result of work, sales channel, and technology changes accelerated by the pandemic shutdowns.
CA Unemployment Rate
Rate
California’s reported unemployment rate (seasonally adjusted) in August improved 0.1 point to 7.5 %. California had the second highest unemployment rate among the states.
The August numbers show little change in the number of unemployed, down only 2,200. Employment rose 57,500, and the total labor force rose 55,300, raising the labor force participation rate from 60.9% to 61.0%.
US Unemployment Rate
Rate
The reported national numbers show US unemployment rate (seasonally adjusted) improving 0.2 point to 5.2% as the result of much stronger employment expansion in the other states. Employment was up 509,000, while unemployment dropped 318,000. The labor force rose 190,000, with the participation rate remaining level at 61.7%.
Nonfarm Jobs
Change
Nonfarm wage and salary jobs rose 104,300 (seasonally adjusted) in August, while the gains in July were revised down by 1,300 to 113,200. Nonfarm jobs nationally were up 235,000.
As of the August numbers, California has regained 62% of the Nonfarm jobs lost to the state shutdowns. The rest of the states combined were further along in recovery, having regained 76% of the jobs lost in the pandemic period.
California job growth was led by Government as schools began the school year (46,900), Accommodation & Food Services (23,700), and Arts, Entertainment & Recreation (9,400). Losses were in 3 industries: Health Care & Social Assistance (-7,500), Wholesale Trade (-900), and Retail Trade (-800).
Counties with Double-Digit Unemployment
Unemployment
Above 10%
The number of counties with an unemployment rate at 10% or above dropped to 3. The unadjusted rates ranged from 4.3% in Marin to 19.4% in Imperial.
On an MSA basis in July, California contained 11 of the 25 MSAs with the worst unemployment rates in the country, ranging from Modesto MSA at 8.5% (#367 out of 389) to El Centro MSA at 18.9% (#388). Los Angeles-Long Beach-Anaheim MSA was at 9.3% (4-way tie for #376).
Wages
Average Hourly Wage
Private Sector Workers
For the 12 months ending August, the average hourly wage for private sector workers grew 5.0%.
While this rate is above the 3.5% annual average experienced 2014-2019, almost all is being offset by the rising costs of living in the state. In the most recent results, inflation as measured by the California CPI was running at an annual rate of 4.4% as of June.