Highlights for policy makers:
- COVID-19 and the State Economy
- CaliFormer Businesses: Update
- CaliFormers: Vehicle Registration Data
- CaliFormers & Tax Revenues
- California Poverty Rate Highest Among the States Again
- Nonfarm Jobs: 47,300 Below Pre-Covid Peak
- Job Change by Industry
- Employment 169,300 Below Pre-Covid Level
- Labor Force Participation Rate
- Unemployment Rates by Legislative Districts
- Unemployment Rates by Region
- Employment Recovery by Region
- MSAs with the Worst Unemployment Rates
COVID-19 and the State Economy
As discussed in our preliminary report on the August data, the results show a substantial weakening in the state’s recovery process, especially in light of the stronger job numbers in July. Nonfarm job gains at 19,900 came in at their lowest level since last September. Employment showing a loss of 3,900 was at the lowest since last December.
California remained 47,300 jobs (-0.3%) below the pre-pandemic peak in February 2020, and 169,300 workers (-0.9%) below the prior employment peak. The US numbers, however, continued growing beyond this recovery mark for nonfarm jobs but remained just 0.1% shy in the employment numbers.
In contrast, the number of states exceeding the pre-pandemic job numbers grew from 15 to 19, although the number of states exceeding this recovery measure for employment eased from 31 to 28.
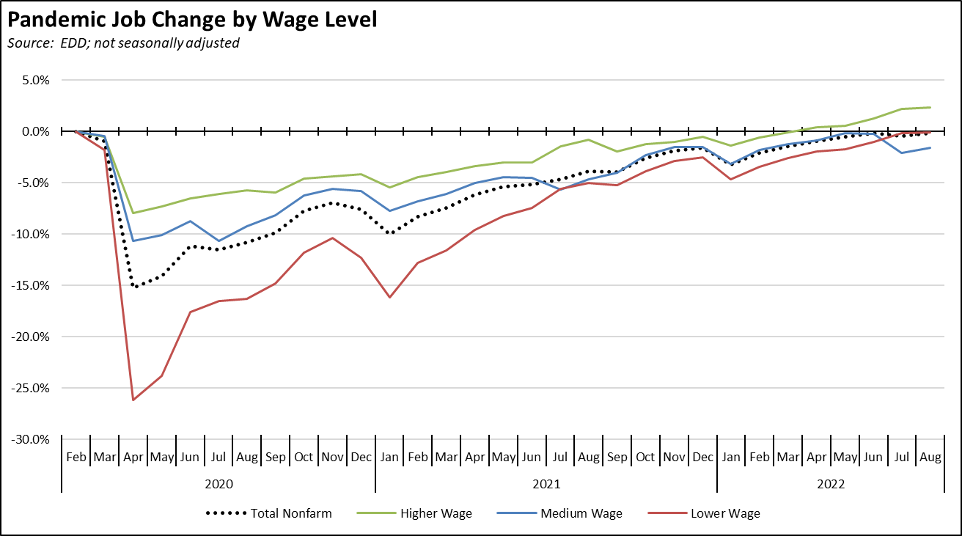
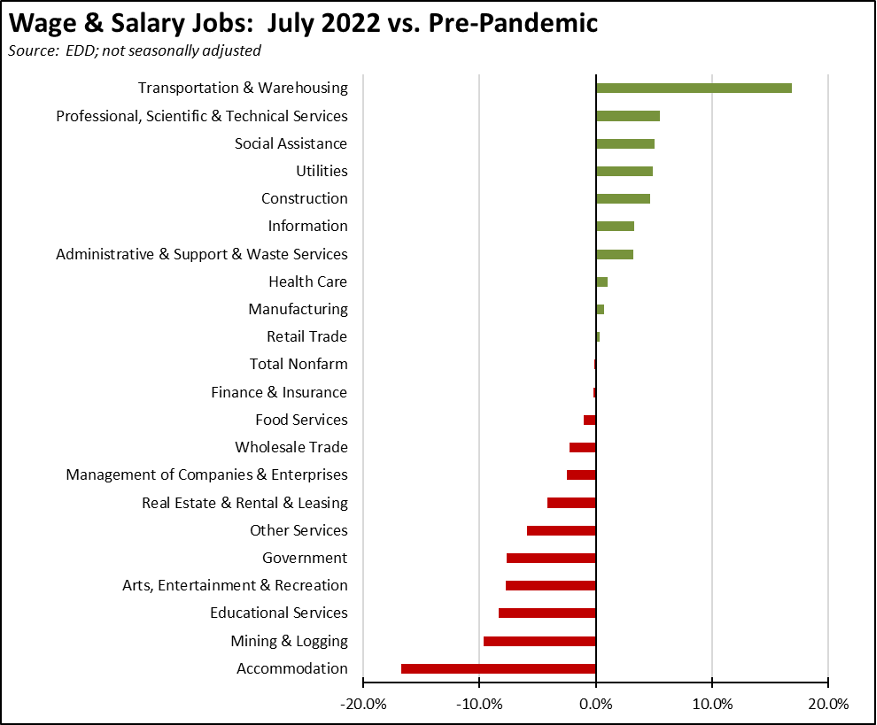
Using the unadjusted numbers to show results by average wage level, the higher wage industries continued the shift from recovery to growth that began in April. The medium-wage industries remained affected by the seasonal shifts related to schools (Educational Services and Government). Seasonal factors remained positive for the lower wage industries, bringing them to within 0.1% of their pre-pandemic peak.
CaliFormer Businesses: Update
Additional CaliFormer companies identified since our last monthly report are shown below. Companies listed below include those that have announced: (1) moving their headquarters or full operations out of state, (2) moving business units out of state (generally back office operations where the employees do not have to be in a more costly California location to do their jobs), (3) California companies that expanded out of state, and (4) companies turning to permanent telework options, leaving it to their employees to decide where to work and live. The list is not exhaustive but is drawn from a monthly search of sources in key cities.
As indicated in this month’s entries, there is a continuing trend in announcements for new manufacturing facilities related to chip production and electric vehicles. These facilities are highlighted because these industries in essence began in California, and the state still retains at least a presence primarily coming from the R&D component for both industries and Tesla’s original factory in the case of the second. Reliance on only the R&D portion, however, continues the state’s two-tier tendency of producing jobs primarily at the higher and lower ends of the wage scale, with many of these higher wage jobs filled by workers coming into the state given the continuing failures of the state’s schools to produce the required skill sets.
The far more numerous middle class wage jobs—both those from the core production facilities plus over time the associated supplier and services networks—are going to other states, largely those states forming an interior arc running from the top of the Inter-mountain to the Southeast states that have already shifted to jobs growth while California still struggles to reach the pre-pandemic jobs recovery point. California’s goals may be focused on reducing income equality, but its policies and the increasing costs these impose on households and employers are ensuring that the jobs to reach this goal—along with the opportunities for further upward economic mobility—are going to other states.
| wdt_ID | Companies | From | To | Reason | Link | Date |
|---|---|---|---|---|---|---|
| 1 | 828 Productions | Glendale | New Mexico | HQ and studio move | Read More | 2022 |
| 2 | Advanced Nano Products | Pleasanton | Kentucky | Electric vehicle battery components manufacturing | Read More | 2022 |
| 3 | AerCap | Los Angeles | Miami | HQ move | Read More | 2022 |
| 4 | Belong | San Mateo | Miami | HQ move | Read More | 2022 |
| 5 | Cellipoint Bioservices | San Diego | Texas | HQ and manufacturing move | Read More | 2022 |
| 6 | ExteNet Systems | Burbank, San Ramon | Texas | HQ move | Read More | 2022 |
| 7 | First Solar | San Francisco | Southwest tbd/Ohio | $1 billion solar factory in southwest/$185 production expansion in Ohio | Read More | 2022 |
| 8 | Hitachi Vantara | Santa Clara | Dallas | Application reliability center | Read More | 2022 |
| 9 | Inxeption | Cupertino | Kentucky | Operational HQ | Read More | 2022 |
| 10 | LG Energy Solution/Honda | Torrance | Ohio | $4.4 billion battery factory | Read More | 2022 |
| 11 | Lyft | San Francisco | telecommuting | Reducing SF office space by 60% | Read More | 2022 |
| 12 | Micron | Folsom/Irvine/San Diego/San Jose | Idaho | $15 billion memory chip factory | Read More | 2022 |
| 13 | Mission Wealth | Santa Barbara | Florida | Expansion | Read More | 2022 |
| 14 | Panasonic | various | Oklahoma | $4 billion battery factory | Read More | 2022 |
| 15 | SH Hotel & Resorts | Los Angeles | Miami | HQ move | Read More | 2022 |
| 16 | Tesla | Fremont | Texas or Louisiana | Lithium refinery | Read More | 2022 |
| 17 | Toyota Motor Co. | Los Angeles | North Carolina | Double capacity of previously announced battery manufacturing | Read More | 2022 |
| Companies | From | To | Reason | Link | Date |
CaliFormers: Vehicle Registration Data
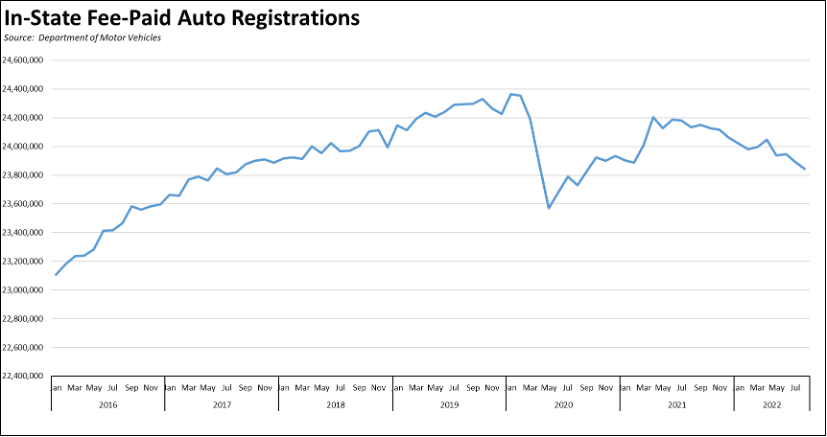
Along with businesses, Californians themselves continue to leave the state due to the growing costs of living, both as the result of job changes and due to remote work opportunities that have expanded since the beginning of the pandemic period. The Department of Finance E-4 estimates (January estimates) show a population loss of 463,000 between 2019 and 2022. The vehicle registration data suggests this trend is continuing.
While not a perfect indicator, vehicle registration data at least through 2019 was highly correlated with population. This match was interrupted temporarily at the beginning of the pandemic as registration renewals were delayed and as people abandoned public transit in droves and turned to single-occupant vehicles. The trend restabilized in mid-2021 but indicates a continuing decline in total population since then. Annualizing the year-to-date data suggests that population in 2022 is on track for an additional decline of just over 1%.
CaliFormers & Tax Revenues
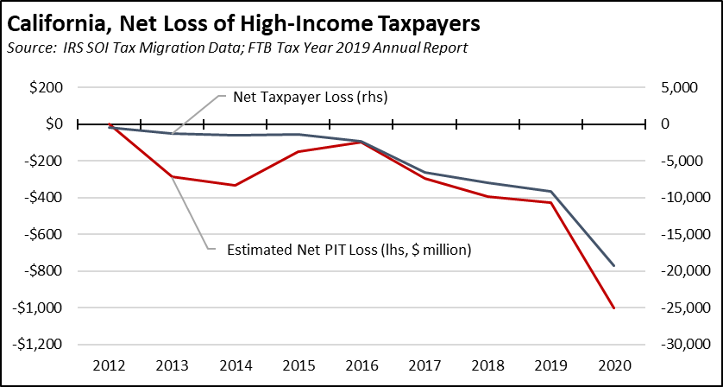
From a public revenues standpoint, more important than the number of Californians leaving is the type that is leaving, specifically whether higher income households are becoming more likely to move to other states. As indicated in our previous discussion of the IRS tax migration data, the net migration of high-income taxpayers ($200,000 AGI and above) has been increasing since the passage of the Prop 55 tax increases in 2016. In the latest data for tax year 2020, the total number of high-income tax returns leaving was 36,751 compared to only 17,522 moving in, for a net loss of 19,229 returns covering 48,479 persons and a net loss of $11.3 billion in taxable (federal) AGI.
The associated tax loss with this movement out of state can be estimated using the Franchise Tax Board annual report data (latest data, tax year 2019). Adjusting the federal AGI and using average rates, the 2020 net migration produced a net revenue loss of $1.0 billion from personal income tax (PIT) alone. In looking at the estimation results in the chart below, there are three points to keep in mind. One, the estimates only cover PIT, and these higher income taxpayers also pay relatively higher amounts for the full range of state and local taxes and fees that would raise the estimates even higher. Two, the net losses are cumulative. In most cases, the annual losses will continue into the future at levels comparable to what is shown unless the tax migrants retire or otherwise stop producing income at these levels. Three, the losses are accelerating, although it is not yet apparent whether the 2020 results come from pandemic factors or whether they indicate a longer trend.
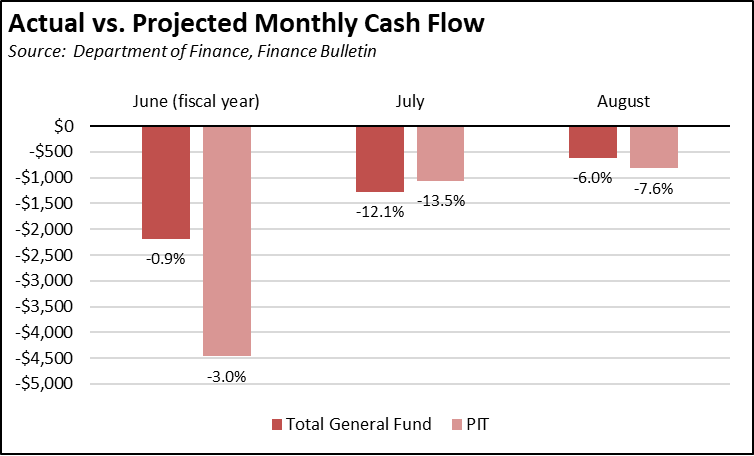
State tax revenues, however, have been consistently falling short of projections since the enactment of the 2022 Budget Bill, in stark contrast to the pandemic period results when receipts consistently outperformed projections, often at precedent-setting levels. While July and August tend to be lower revenue months, the fiscal year-to-date results show actual receipts at $1.7 billion (-10.5%) below projections for personal income tax and $2.0 billion (-8.4%) below projections for the total general fund. These shortfalls are in addition to the lower receipts (-$4.5 billion personal income tax and -$2.2 billion total general revenue) seen at the end of the prior fiscal year in June.
These shortfalls, however, are likely not due solely to migration. As discussed before, the state budget is inordinately vulnerable to economic outcomes in the Bay Area and more specifically that region’s tech industry. The most recent data from Franchise Tax Board indicates the Bay Area with 19.6% of the population produced 34.7% of the state AGI and 43.2% of total personal income tax receipts in tax year 2019. This contribution going forward is now moving against several headwinds. IPOs associated with the tech industry are down dramatically from prior years, and reports of companies laying off workers or pulling back on new hires have been increasing. As one indicator, Layoffs.fyi Tracker shows 47,072 layoffs to date by start-ups in the Bay Area (plus another 5,014 in Los Angeles and San Diego), although not all workers were located in the state. The total for California based start-ups represents 65% of all layoffs in 2022 covered in this Tracker.
California Poverty Rate Highest Among the States Again
The negative pressure imposed by California’s regulation-driven cost of living crisis is once again reflected in the recent release of the supplemental poverty measure by the US Census Bureau for 2021. California once again had the highest cost-adjusted poverty rate, at 13.2% compared to the overall US average of 9.6%. California has ranked as the state with the highest supplemental poverty measure rate since the introduction of this data series in 2011, although in some years including 2021, DC has had a slightly higher rate.
The state’s rate declined from 2020 (from 15.4%) as did the national rate as the result of a substantial increase in pandemic assistance payments and related tax credits. The temporary effect of this assistance, however, is quickly being eroded by the subsequent upsurge in inflation affecting the buying power and effective incomes of a much broader range of income groups for what now appears to be a longer period of time. Even with the rate decrease, California still contained 16.4% of all persons living in poverty in the US under this measure.
The supplemental poverty measure was instituted to measure poverty more accurately, taking into account several factors, including: (1) assessing poverty status for household units, including families as well as resident unrelated children, foster children, and unmarried partners and their relatives; (2) adjusting for the core living costs of housing, utilities, food, and clothing; and (3) incorporating a broader range of income sources including cash income, noncash benefits, as well as adjustments for state and local taxes/tax credits, work expenses, medical expenses, and child support payments.
The official poverty measure in contrast along with the associated income numbers released at the same time by the Census Bureau is based only on pre-tax money income, incorporating cash received from sources such as wages, benefits and other transfer payments, alimony, child support, and interest and dividends. Rather than assessing the differing cost levels faced by families in each state, the official poverty threshold is based on three times the costs of a minimum food diet in 1963, adjusted by the consumer price index.
Nonfarm Jobs: 47,300 Below Pre-Covid Peak
Nonfarm wage and salary jobs were up 19,900 (seasonally adjusted) in July, while the estimated gains in June were revised up to 91,400. Nonfarm jobs remained 47,300 below the pre-pandemic peak in February 2020 (-0.3%).
Among the states, California’s job results dropped to 4th, behind Kentucky (26,700), New York (25,600), and Florida (20,700). On a running quarterly basis, California (148,600) remained behind Texas (181,500) but still ahead of smaller Florida (133,500). However, California gains still are from jobs recovery, while the other two states show jobs growth having surpassed their prior peaks—Florida last October and Texas in November—much earlier.
Job Change by Industry
Using the unadjusted numbers that allow a more detailed look at industry shifts, the number of industries showed job levels at or exceeding the pre-pandemic February 2020 levels remained at 10. Transportation & Warehousing again showed the strongest cumulative jobs growth (112,100) by a large margin, with higher-wage Professional, Scientific & Technical Services (75,000) remaining in second place.
Employment 169,300 Below Pre-Covid Level
EDD reported that employment (seasonally adjusted; August preliminary) was essentially unchanged with a dip of 3,900 from the revised June numbers. The number of unemployed rose 36,300.
The reported unemployment rate rose 0.2 point to 4.1%, matching the revised 4.1% in February 2020 prior to the pandemic. California had the 10th highest unemployment rate among the states, and contained 13.2% of the total number of unemployed workers in the US.
In the national numbers, total US employment was up 422,000, and the number of unemployed rose as well by 344,000. As workers reentered the labor force, the reported unemployment rate rose 0.2 point to 3.7%, compared to the 3.5% rate recorded in February 2020.
Figure Sources: California Employment Development Department; US Bureau of Labor Statistics
Labor Force Participation Rate
The labor force participation rate edged up 0.1 point to 62.5% but remained above the US number at 62.4%. The California rate still remains below the pre-pandemic level of 62.8%, which in turn was down substantially from prior years. Accounting for workers leaving the workforce since February 2020, there were an estimated 0.9 million out of work in August.
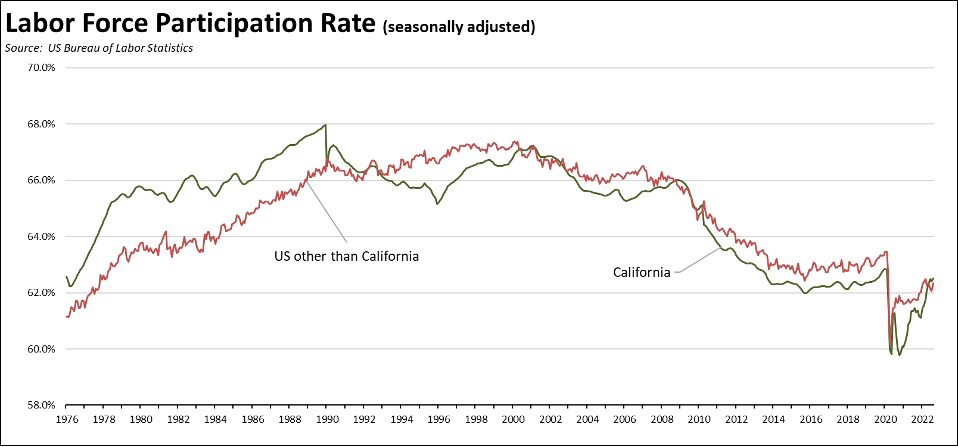
While at least a portion of the reduced participation rate is due to the aging population, California’s emphasis on benefits rather than shifting policies to accelerate job creation after the 2008 Great Recession contributed to the lagging recovery in those portions of the state outside the Bay Area. This result, however, builds on itself with long-term unemployment affecting the employability of the affected workers as well as lowering their prospects for long-term wage and income growth. While the job openings data indicate that there are more than enough unfilled jobs to bring the state back to full recovery—defined both as exceeding the pre-pandemic peak AND returning to the prior jobs growth trend—labor remains the primary constraint. And if jobs don’t grow, the revenues required to support the current state fiscal structure and expanding benefits structure don’t grow as well.
Looking at the demographic breakdowns from EDD (12-month moving averages due to the nature of the underlying Current Population Survey data), labor force recovery varies by group. Men overall remain outside the labor force to a greater extent as measured by their participation rates both before the 2008 and more recent recession. Women have largely recovered and participated at a rate somewhat above their 2007 level.
By race and ethnicity, Whites are substantially below due in large part to the shifting age distribution, while African-Americans show improved rates overall. Latinos show recovery from pre-pandemic, but lower rates compared to pre-Great Recession.
By age, youth and young adults show the greatest slippage and likely are to continue along this trend as the minimum wage continues to grow higher. The prime working ages show recovery pre-pandemic but some slippage from 2007 rates. The older cohorts essentially show recovery, with age 65+ showing expanded participation from 2007.
Figure Source: California Employment Development Department, 12-month moving average
Unemployment Rates by Legislative Districts
The highest and lowest estimated unemployment rates in July are shown below. The estimates are for the current, 2012 vintage districts. Estimates for the new districts under the 2022 redistricting will be released after the required factors from the American Community Survey become available at the end of 2023.
Lowest
Highest
Unemployment Rates by Region
Unemployment rates (not seasonally adjusted) compared to pre-pandemic February 2020 are shown below.
Figure Source: California Employment Development Department
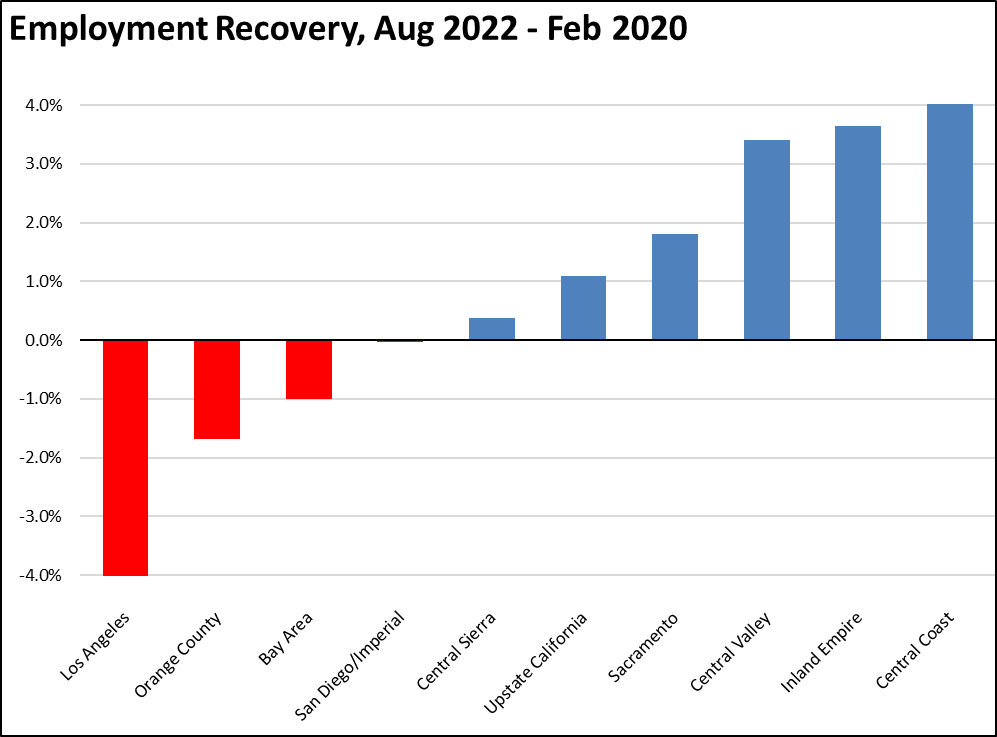
Employment Recovery by Region
Los Angeles Region continues to lag the rest of the state in recovery to the pre-pandemic peak employment levels, with San Diego/Imperial just short of moving into the recovery category.
MSAs with the Worst Unemployment Rates
The number of California MSAs among the 25 regions with the worst unemployment rates in July notched up to 7. Los Angeles-Long Beach-Anaheim MSA remained out of this group but dipped to #304 in a tie with 6 other MSAs in other states. The best performing California urban region was again San Jose-Sunnyvale-Santa Clara MSA, edging down to a tie with Lincoln, NE MSA at #19, with an unemployment rate of 2.2% compared to the 7 best-performing regions tied at 1.7%.