The Center for Jobs and the Economy has released our full analysis of the July Employment Report from the California Employment Development Department. For additional information and data about the California economy visit www.centerforjobs.org/ca.
Highlights for policy makers:
- Nonfarm Jobs up 3,800.
- Changes in the Monthly Estimates
- California Unemployment Rate Highest Among the States
- Employment Recovery Progress
- Nonfarm Jobs
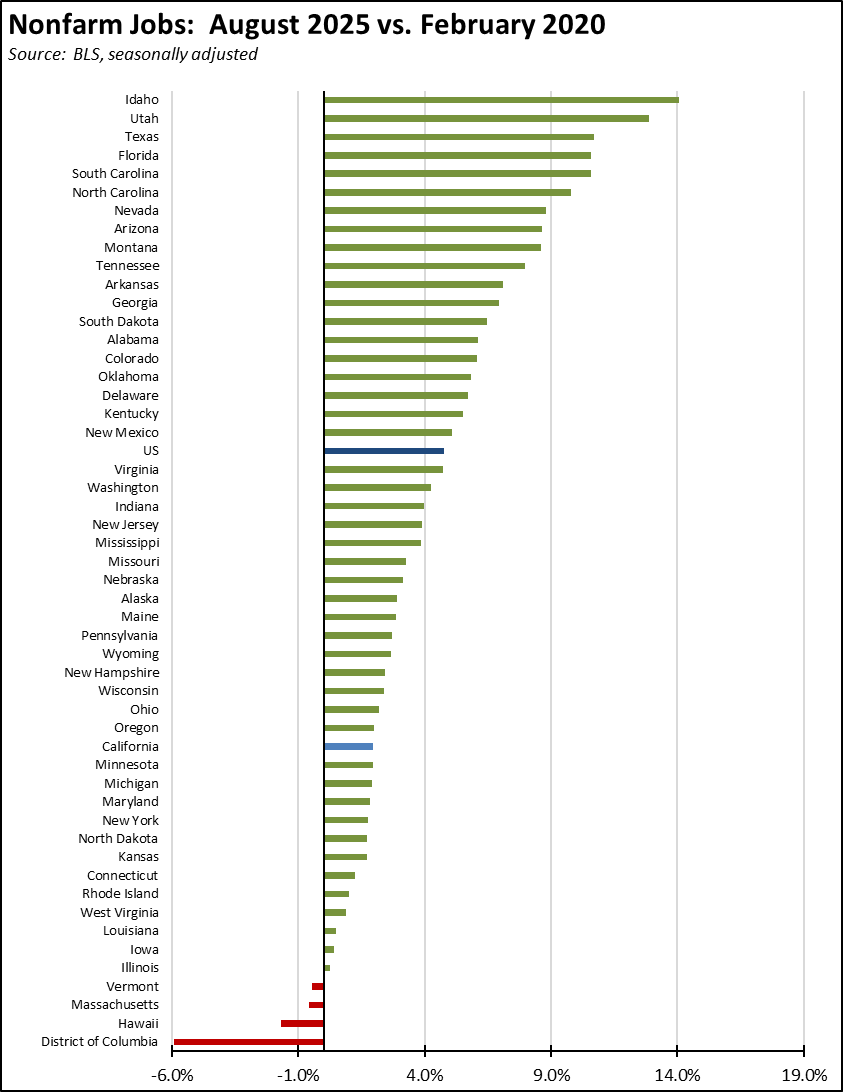
- Recovery Progress: CA Nonfarm Jobs vs. Other States
- Wages & Hours
- Unemployment Rates by Region
- Counties with Double-Digit Unemployment
- Unemployment Rate by Legislative District
Nonfarm Jobs up 3,800.
In the preliminary numbers, seasonally adjusted nonfarm jobs showed little change with a gain of only 3,800. Year-to-date, nonfarm jobs now show a loss of 21,200.
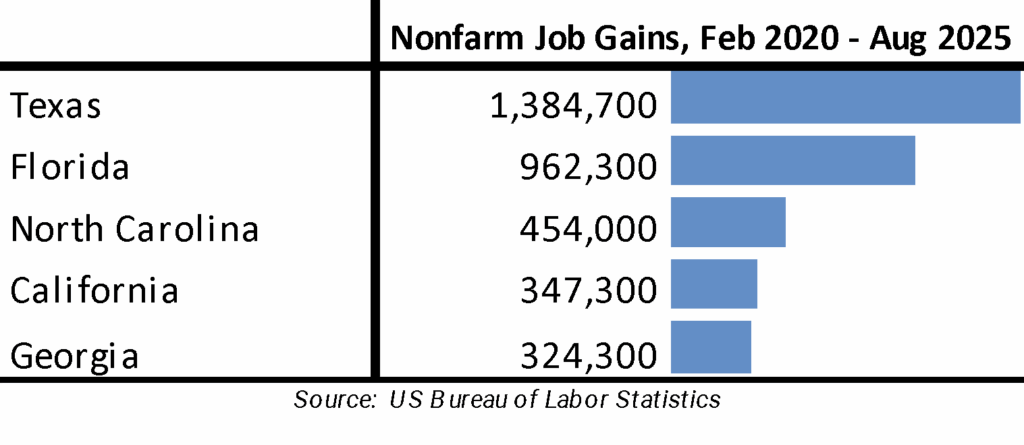
The August preliminary result was the 13th highest among the states, with jobs led by Texas with a gain of 17,600 followed by Pennsylvania with 12,200 and Ohio at 9,900. In the year-to-date totals, California ranks the worst among the states and DC, which are led by Texas at 139,200, Ohio at 75,600, and Pennsylvania at 68,300.
Looking at net total nonfarm job gains compared to pre-pandemic peaks, California remained in 4th place behind much smaller North Carolina and with Georgia maintaining the spread.
By industry, the results were split over the month, but with Government and government-supported Healthcare & Social Assistance dominating the numbers for the year. Gains in August were still seen in the seasonal Arts, Entertainment & Recreation (4,700) and Accommodation & Food Services (4,600) but also some life in tech-related Information (1,200). Losses, however, were led by the other tech component of Professional, Scientific & Technical Services (-3,600), a drop during its peak season in Construction (-2,500), and yet another loss in Manufacturing (-1,400) .
Changes in the Monthly Estimates
In response to the growing concerns over the quality of the monthly job and labor force data, we are now providing a tracking of the various revisions as they occur. As summarized in the following chart:
- Preliminary Estimate is the first round of estimates announced in the monthly reports from EDD and BLS. The job numbers are based on a survey of establishments, but the initial response rates have been dropping sharply especially since the pandemic. As a result, they have been criticized increasingly for their accuracy, which in the case of California as shown, has been significantly overestimated. All other Change columns are based on a comparison of the subsequent revisions to these first preliminary looks.
- Monthly Revision reports the first adjustments to the numbers based on follow-up efforts that improve the overall survey response rates and that are reported for the prior month along with the preliminary monthly reports. As indicated, the revisions to the July numbers erased any jobs growth, with a net loss of 300.
- Annual Revision is reported at the beginning of each year, with job models recalibrated (rebenched) primarily based on the March Quarterly Census of Employment & Wages (QCEW) count of actual wage and salary jobs, along with updates from various other data sources. In a reversal from previous years, the preliminary benchmark revision announced by BLS would increase the state’s March 2025 jobs by 20,700, but this number is not seasonally adjusted and will be affected by any changes to that calculation as well.
- Early Benchmark is a series maintained by the Philadelphia Federal Reserve Bank using the most recent QCEW data along with the overall method used by BLS to come up with an early look at likely revisions to the state numbers in the Annual Revision, including both the early benchmark estimated changes (shaded cells) and projections based on the more current monthly results. Using the just- released 2025 Q1 QCEW data, these estimates expect California’s 2024 numbers to be lowered by 175,100. This magnitude of a change would reduce the state’s total job gains in 2024 to only 75,600, or an anemic 6,300 per month.
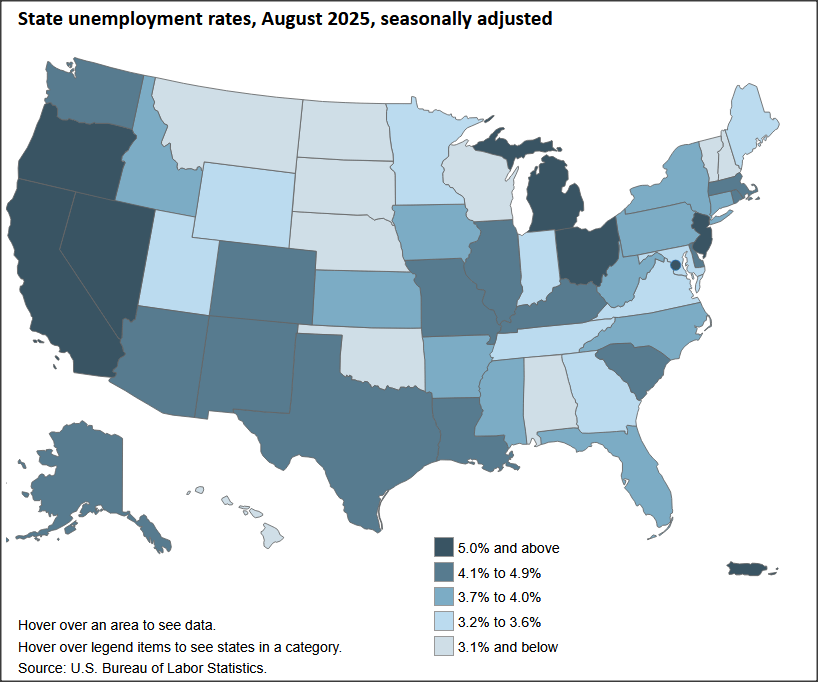
California Unemployment Rate Highest Among the States
Employment Recovery Progress
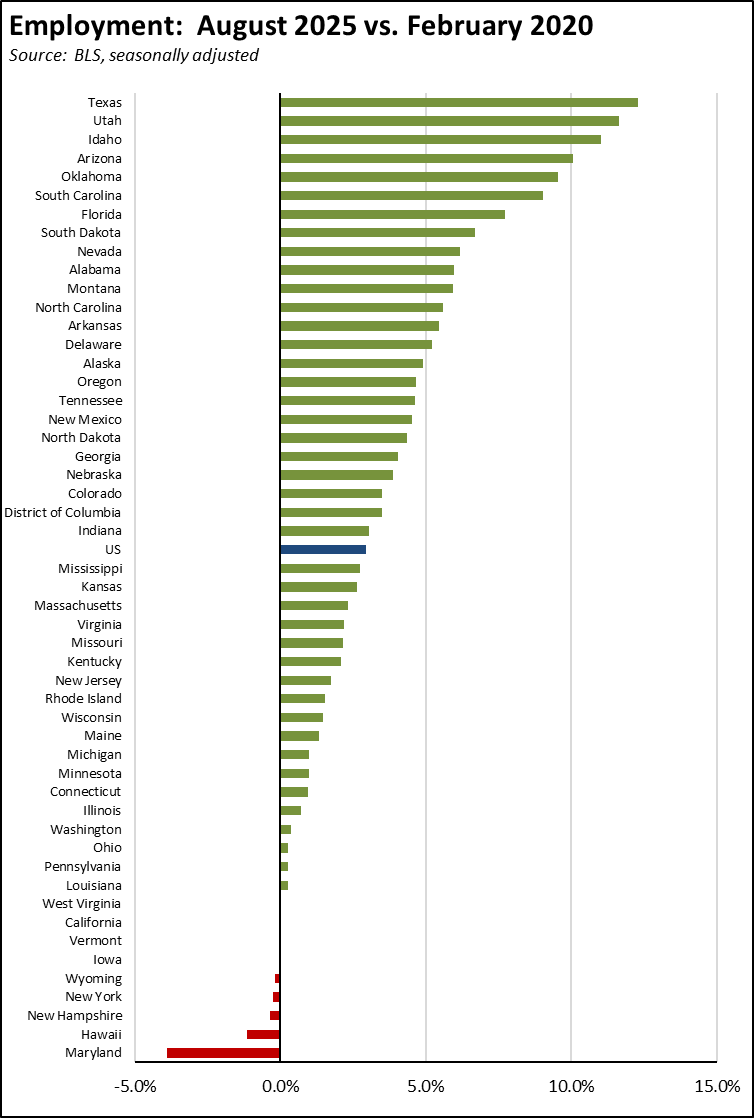
Due to the weak labor force numbers, California again remained just shy of recovery to its pre-pandemic employment levels. Adjusted by size, California’s performance was 44th highest among the states and DC.
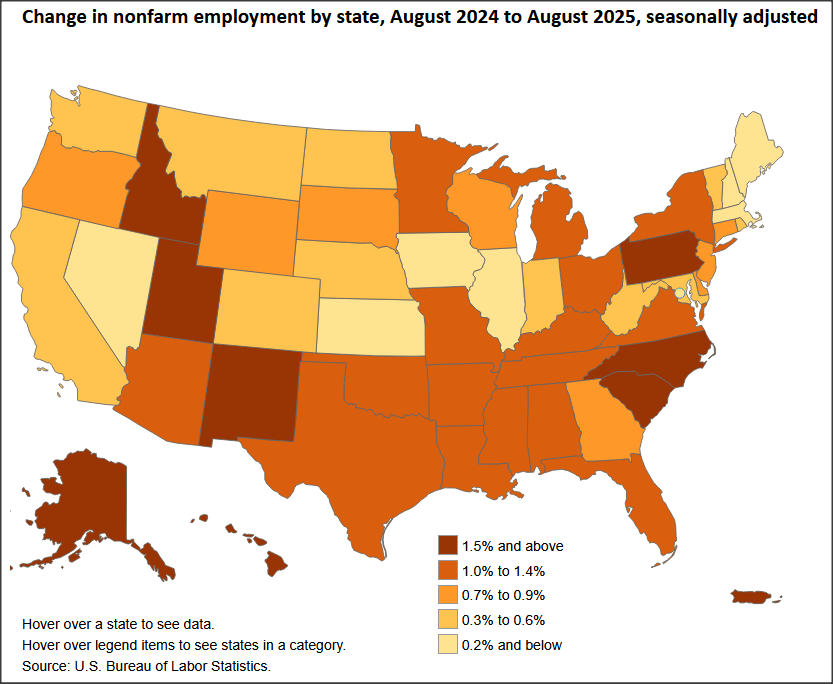
Nonfarm Jobs
Recovery Progress: CA Nonfarm Jobs vs. Other States
Interactive Original https://www.bls.gov/charts/state-employment-and-unemployment/state-unemployment-rates-map.htm
California’s monthly job performance in June was the 13 th highest among the states and DC. Adjusted for size, California’s recovery level compared to the pre-pandemic peaks remained the 35 th highest, while only 3 states and DC have yet to show positive recovery.
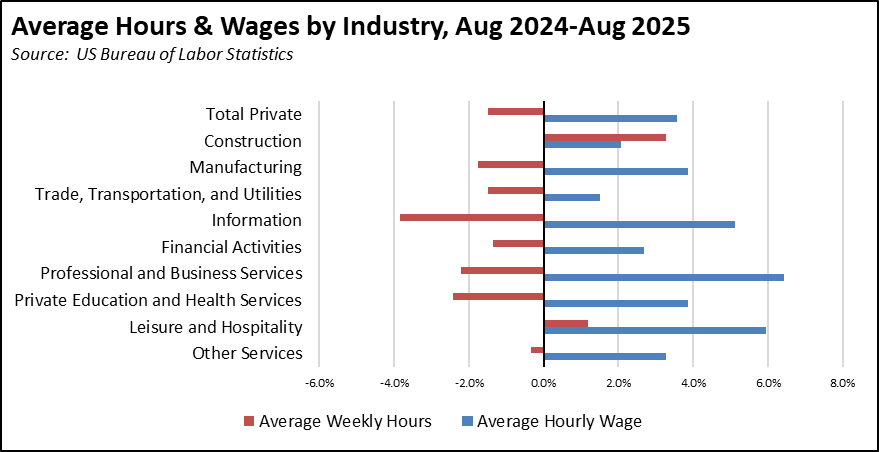
Wages & Hours
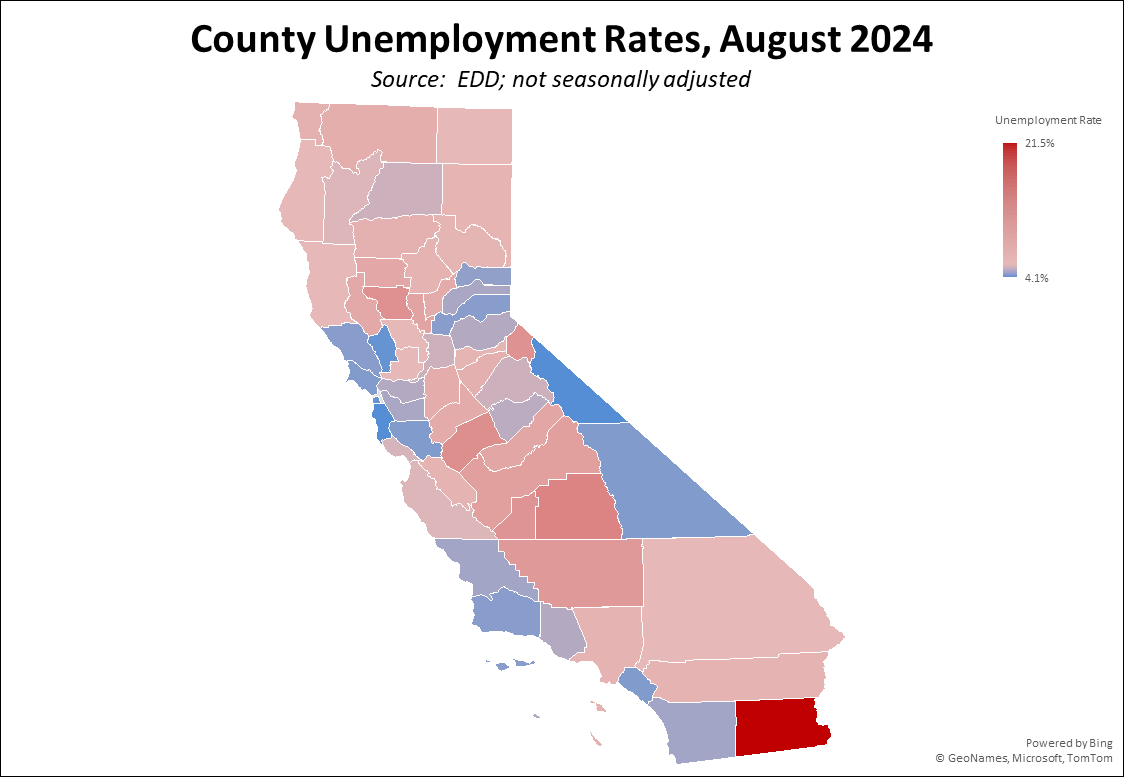
Unemployment Rates by Region
Unemployment rates (not seasonally adjusted) were higher in all regions compared to pre-pandemic February 2020 levels other than the Central Coast, Upstate California, and Central Valley.
Counties with Double-Digit Unemployment
Unemployment Rate by Legislative District
The estimated unemployment rates are shown below for the highest and lowest districts. The full data and methodology are available on the Center’s website.