06/11/2025

Reports » Job Reports

California Employment Report for April 2025

Download Report

The Center for Jobs and the Economy has released our initial analysis of the April Employment Report from the California Employment Development Department. Data for the other states will be addressed in our Full Jobs Report after it is released by Bureau of Labor Statistics next Tuesday. For additional information and data about the California economy visit www.centerforjobs.org/ca.

Highlights for policy makers:

Nonfarm Jobs Rise 17,700

After three months of losses and the 54,800 downgrade in December coming from the annual revision process, California posted a 17,700 nonfarm jobs gain in April. The 11,600 preliminary loss in March was revised to a loss of 6,800.

Change in Nonfarm Jobs by Industry

Source:  EDD, seasonally adjusted

From March 2025From September 2022
Total Nonfarm17,700216,000
Government & Government Supported12,600565,800
Government4,500169,700
Health Care & Social Assistance8,100396,100
Other Private5,100-349,800
Mining & Logging0-1,100
Construction6,300-18,800
Manufacturing-500-81,000
Wholesale Trade-3,000-17,200
Retail Trade-1,700-27,000
Transportation, Warehousing & Utilities2,600-6,100
Information1,100-94,200
Finance & Insurance-200-41,800
Real Estate & Rental & Leasing-700-7,100
Professional, Scientific & Technical Services700-55,900
Management of Companies & Enterprises-1,500-6,000
Administrative & Support & Waste Management & Remediation Services-1,600-99,900
Private Educational Services1,30046,800
Arts, Entertainment & Recreation60041,600
Accommodation & Food Services2,000-3,900
Other Services-30021,800

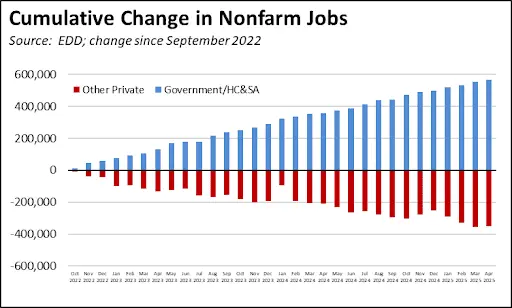
By industry, nonfarm jobs were again dominated by government and government-supported Healthcare & Social Assistance. The other private industries as a group posted a small positive result, primarily due to a seasonal uptick in activity in Construction and accelerated trade shipments in advance of the recent tariff actions. Jobs in the other private industries previously peaked in September 2022. Since then, nonfarm jobs growth has been solely in government and Healthcare & Social Assistance. Over the past 31 months, jobs largely dependent on public funding grew by 565,800, while jobs in the other private industries fell by 349,800. Even with jobs being propped up by the state’s continued deficit spending, the average monthly gain of only 7,000 coming from government-supported jobs in this period again emphasizes the extent to which the state’s economy was stagnant even before the recent actions by the federal government.

California Labor Force

Seasonally AdjustedCaliforniaUS
Apr 2025Change from Mar 2025Apr 2025Change from Mar 2025
Unemployment Rate5.3%0.04.2%0.0
Labor Force19,704,8000.2%171,109,0000.3%
Participation Rate62.6%0.1
Employment18,699,2000.2%163,944,0000.3%
Unemployment1,055,0000.0%7,165,0001.2%

5.3%

CA Unemployment Rate

California’s reported unemployment rate (seasonally adjusted) was unchanged at 5.3%. The US rate also remained level but at 4.2%.

39.3k

CA Employment

Employment rose 39,300 (seasonally adjusted) in April, while US employment rose by 436,000.

California unemployment was essentially unchanged with an increase of only 400, while US unemployment edged up by 82,000. California unemployment has been above 1 million every month since January 2024, the highest levels since the pandemic period in 2021.


Nonfarm Jobs

17.7k

Nonfarm Jobs Change

Nonfarm wage and salary jobs rose 17,700.

For the US as a whole, nonfarm jobs rose 177,000.

Counties with Double-Digit Unemployment

4

Counties with Unemployment Above 10%

The number of counties with an unemployment rate (not seasonally adjusted) at 10% dipped to 4. The unadjusted rates ranged from 3.4% in San Mateo to 16.0% in Imperial.