The Center for Jobs and the Economy has released our initial analysis of the February Employment Report from the California Employment Development Department. For additional information and data about the California economy visit www.centerforjobs.org/ca.
Highlights for policy makers:
- February Data Shows Weak Results
- California Labor Force
- Recovery Progress: CA Employment vs. Other States
- Nonfarm Jobs
- Recovery Progress: CA Nonfarm Jobs vs. Other States
- Nonfarm Jobs by Region
- Unemployment Rates by Region
- Counties with Double-Digit Unemployment
- Unemployment Rate by Legislative District
February Data Shows Weak Results
The February labor force data in general produced weak results for the state. Nonfarm jobs dipped by 3,400 over the month, while January’s strong preliminary numbers were revised down sharply from the initially reported 58,100 to 25,600, the lowest since last September and only 38% as high as the gain in January 2023.
Employment came in with yet another monthly loss, the 8th in the last 9 months. Employment was off 20,100 for the month and a total of 120,200 in the current 9-month downward trend. As unemployment also has grown in every month except one since September 2022, the unemployment rate rose to 5.3%, the highest among the states and DC and the highest in California since December 2021.
California Labor Force
US employment dipped by 31,000 in January.
California unemployment rose 23,300, while US unemployment dropped 144,000.
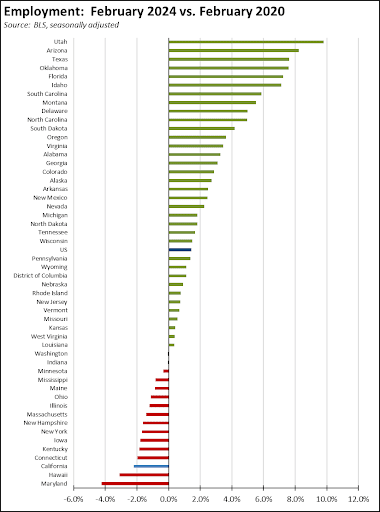
Recovery Progress: CA Employment vs. Other States
Compared to the pre-pandemic peak in February 2020, California’s sustained weak employment recovery remained at the 3rd lowest among the states and DC. Rather than moving towards recovery, total employment fell further to 265,900 below the pre-pandemic peak.
Nonfarm Jobs
Nonfarm wage and salary jobs dipped 3,400 (seasonally adjusted), while the previously reported January gains were slashed by 32,500 to 25,600.
For the US, nonfarm jobs were up 275,000 in February.
The seasonally adjusted numbers for California showed gains in 5 industries and losses in 13. Increases were led by Healthcare & Social Assistance (14,300), Professional, Scientific & Technical Services (4,000), and Accommodation & Food Services (1,400). Losses were led by Construction (-9,600), Wholesale Trade (-3,500), and Transportation, Warehousing & Utilities (-2,100).
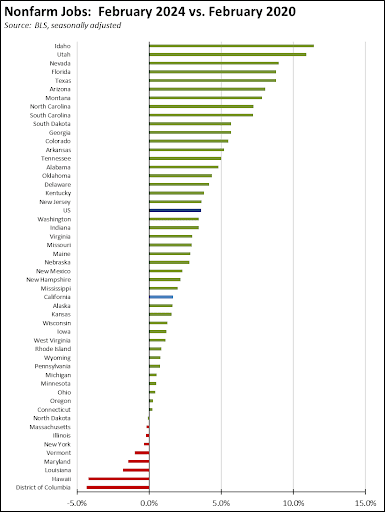
Recovery Progress: CA Nonfarm Jobs vs. Other States
California’s monthly job performance in February was the 49th highest among the states and DC. Texas led with 49,800, followed by Illinois at 23,100 and Michigan at 15,200.
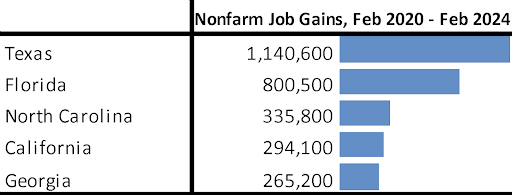
Compared to the pre-pandemic peak, California has now gained 294,100 nonfarm jobs, still in 4th place among the states and DC.
Adjusted for size, California again ranked 29th highest, below the US average.
Nonfarm Jobs by Region
Both the budget critical Bay Area and Los Angeles Region posted nonfarm job losses (seasonally adjusted) over the month, leaving the post-pandemic recovery rankings unchanged.
Because the data in the table is seasonally adjusted, the numbers should be considered as the total for the counties in each region rather than the regional number. This job series also is not available for all areas in California.
Unemployment Rates by Region
Looking at employment, no region in the state has yet to pass the pre-pandemic peak. Los Angeles and Bay Area remain the furthest behind.
Unemployment rates (not seasonally adjusted) compared to pre-pandemic February 2020 are shown below.
Counties with Double-Digit Unemployment
The number of counties with an unemployment rate (not seasonally adjusted) at 10% or edged up to 3. The unadjusted rates ranged from 3.7% in San Mateo to 20.4% in Colusa.
Unemployment Rate by Legislative District
The estimated unemployment rates are shown below for the highest and lowest districts. The full data and methodology are available on the Center’s website.