04/21/2025

Reports » Job Reports

California Employment Report for February 2025

Download Report

The Center for Jobs and the Economy has released our full analysis of the January Employment Report from the California Employment Development Department. For additional information and data about the California economy visit www.centerforjobs.org/ca.

Highlights for policy makers:

Nonfarm Jobs Drop in February and January

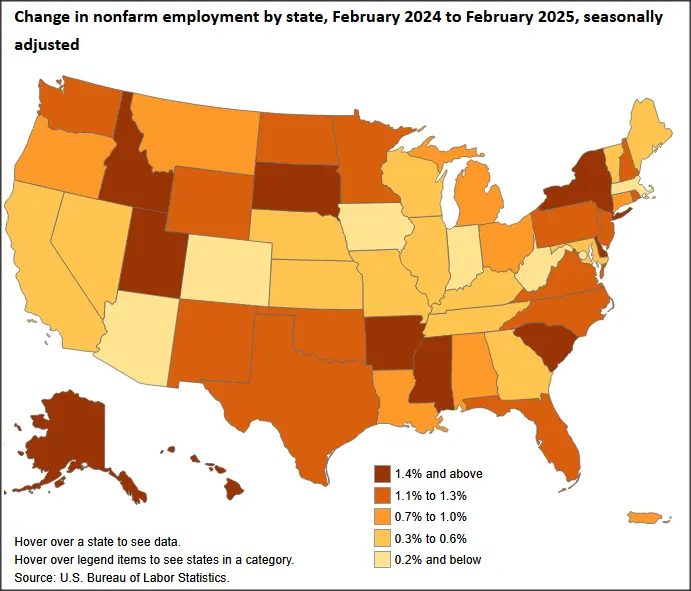
In the preliminary numbers, seasonally adjusted nonfarm jobs fell 7,500 in February. The January numbers were revised from a preliminary result of no change in jobs to a loss of 21,400. The February number was the 49th highest among the states, with jobs led by Ohio with a gain of 23,100 followed by Texas with 25,600 and New Jersey at 19,200.

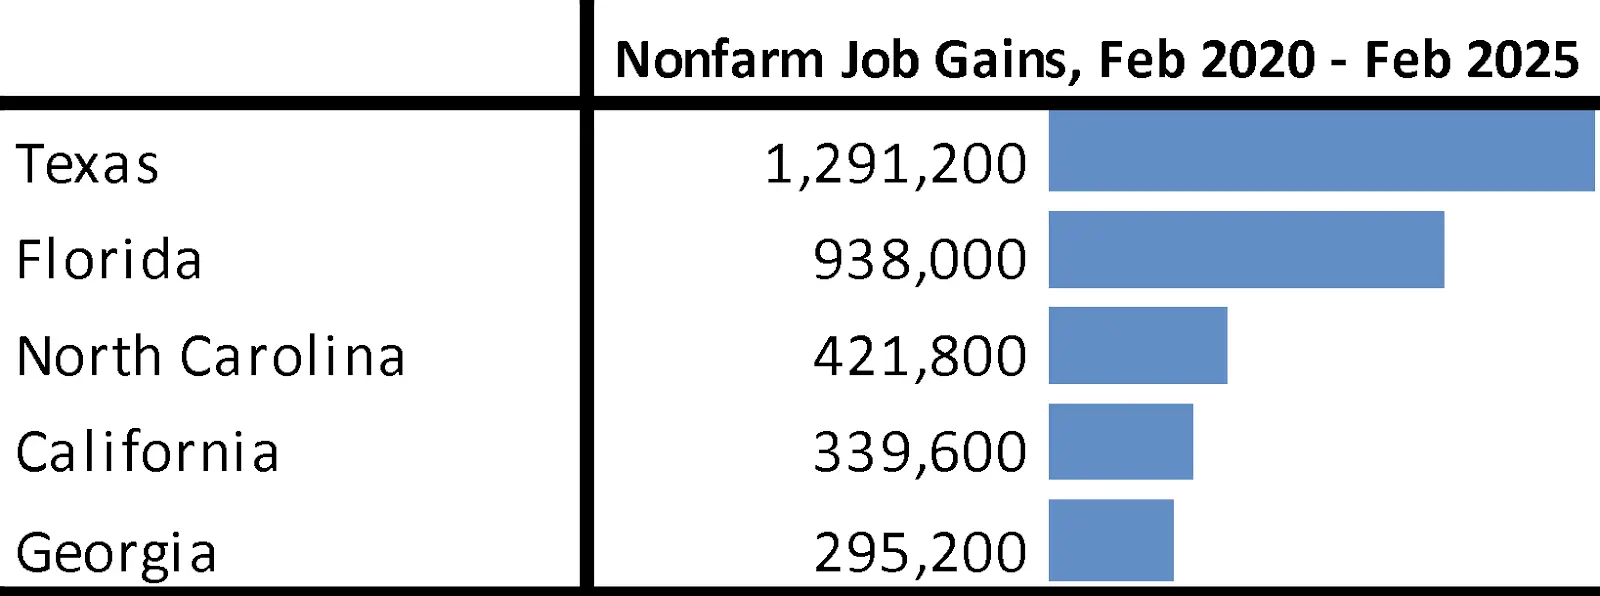
Looking at net total nonfarm job gains compared to pre-pandemic peaks, California remained in 4th place behind much smaller North Carolina but still ahead of Georgia.
By industry, both government and government-dependent Healthcare & Social Assistance again showed gains by 18.500 in February, but these were offset by a 26,000 drop in the other private industries. Still some gains were reported within this last category, including Private Educational Services (3,500), Information (2,600), and Wholesale Trade (1,800). These gains were more than offset by greater losses in industries led by Accommodation & Food Services (-8,200), tech-containing Professional, Scientific & Technical Services (-5,200), and Finance & Insurance (-5,000).

California Federal Jobs by Industry, September 2024

Source: Quarterly Census of Employment & Wages

IndustryJobsAverage Annual Wage
Postal service58,686$78,360
National security50,845$116,997
General medical & surgical hospitals28,496$142,704
Police protection17,093$158,354
Administration of conservation programs10,998$130,041
Regulation & administration of transportation programs10,802$120,932
Public finance activities9,335$106,636
Administration of veterans' affairs8,802$129,720
Administration of human resource programs6,475$101,048
Engineering services6,324$111,539
Offices of physicians (except mental health specialists)5,506$139,336
Other general government support5,325$90,315
International affairs3,454$130,102
Correctional institutions3,192$130,781
Courts2,828$122,419
Administration of general economic programs2,346$113,193
Department stores2,320$40,146
Regulation of agricultural marketing & commodities2,307$112,879
Nature parks & other similar institutions2,152$83,701
Legal counsel & prosecution2,001$154,724
Space research & technology1,823$159,814
Other justice, public order, & safety activities 1,642$138,062
Warehouse clubs & supercenters1,630$35,591
Regulation, licensing, & inspection of miscellaneous commercial sectors1,496$172,601
Supermarkets & other grocery retailers (except convenience retailers)1,137$59,295
Fitness & recreational sports centers1,094$30,567
Administration of public health programs1,029$137,537
Administration of air & water resource & solid waste programs998$134,896
Child care services595$34,055
Environmental consulting services 554$149,331
Administration of housing programs534$157,018
Other direct insurance (except life, health, & medical) carriers407$206,064
Gasoline stations with convenience stores379$39,352
All other amusement & recreation industries262$26,822
All other general merchandise retailers240$54,630
Civic & social organizations 223$31,255
Freestanding ambulatory surgical & emergency centers215$112,040
Research & development in nanotechnology200$151,923
Offices of certified public accountants163$29,274
Cemeteries & crematories 155$75,145
Administration of education programs155$134,239
All other traveler accommodation 153$34,923
Research & development in the physical, engineering, & life sciences132$92,745
Real estate credit118$124,303
Rooming & boarding houses, dormitories, & workers' camps116$25,616
Other761$82,779

California Unemployment Rate Unchanged at 5.4%

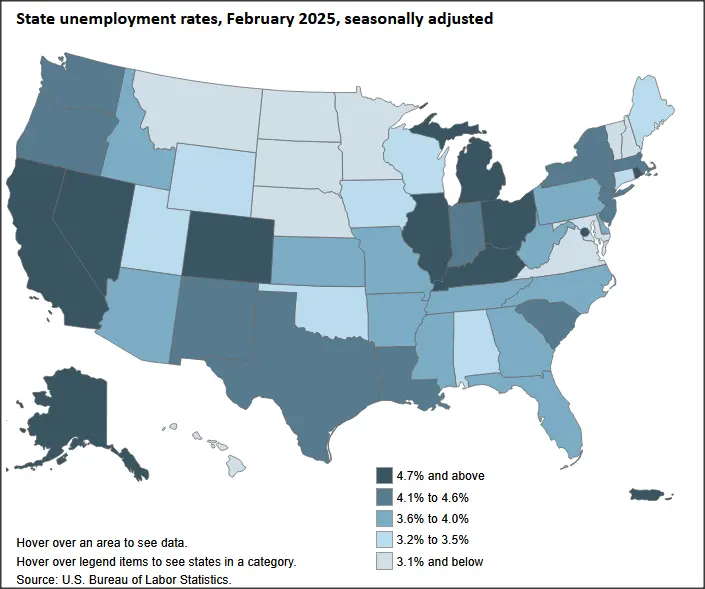
California’s seasonally adjusted unemployment rate remained unchanged at 5.4%, but also remained the 2nd highest among the states, tied with Michigan and DC and behind Nevada. The US unemployment rate edged up 0.1 point to 4.1%. Total unemployed edged down by 8,200 but remained above the 1 million level for the 14th month in a row.

Seasonally AdjustedCaliforniaUS
Nov 2024Change from Oct 2024Nov 2024Change from Oct 2024
Unemployment Rate5.4%0.04.1%0.1
Labor Force19,706,7000.0%170,359,000-0.2%
Participation Rate62.1%0.062.4%-0.2
Employment18,645,7000.1%163,307,000-0.4%
Unemployment1,061,000-0.8%7,052,0003.0%
Not Seasonally AdjustedCaliforniaUS
Nov 2024Change from Nov 2023Nov 2024Change from Nov 2023
Unemployment Rate5.5%0.14.5%0.3
Labor Force19,737,9000.6%170,116,0001.7%
Participation Rate62.2%-0.162.3%-0.2
Employment18,653,0000.4%162,544,0001.4%
Unemployment1,084,9002.4%7,572,0008.6%

4th Quarter Real GDP Up 1.4%


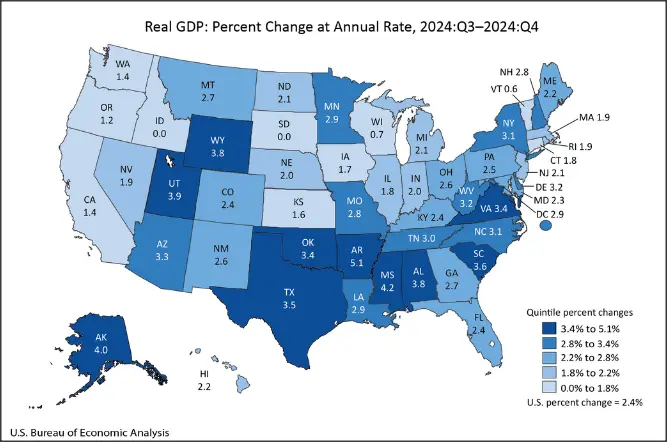
On an annualized basis, California Real GDP grew at an anemic 1.4%, below the US average of 2.4% and coming in at 44th highest among the states. Leading contractions were in Information and Durable Manufacturing, while the strongest growth sectors were Healthcare & Social Services and Government.

For the year, the preliminary results are somewhat better. California Real GDP grew 3.6%, above the US average of 2.8% and 10th highest among the states. California’s growth rate was matched by both Texas and Florida.

Nominally, California’s 2024 current GDP of $4.103 trillion would place it marginally ahead of Japan to become the 4th largest economy based on the October 2024 data from the International Monetary Fund. However, the IMF data only contains an estimate for Japan in 2024, and that country’s performance in 2024 has experienced growth rather than the IMF’s projected contraction, which would keep it ahead of California’s level. A more accurate ranking will be reported after IMF updates its data next month.

The current IMF data does contain the 2024 results for India, and California remains ahead of that country. However, California would need to grow by more than 4.1% in 2025 and more than 14.8% in 2025 and 2026 combined to remain ahead in 5th place. At its current growth rate, California would still stay ahead in 2025, but fall behind India in 2026.

4th Quarter Personal Income Up 5.1%
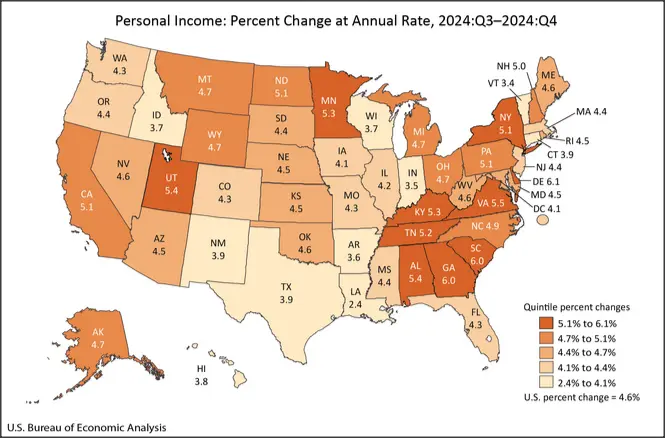
On an annualized basis, Personal Income grew 5.1% in the 4th Quarter, above the US average of 4.6% and 13th highest among the states. Transfer payments were the strongest component, growing at an annualized rate of 9.4%, while Net Earnings grew by 5.1%. Earnings were driven heavily by Government (23% of the growth) and Healthcare & Social Assistance (18%).

For the year, the preliminary results show California Personal Income growing 6.5%, above the US average of 5.4% and 3rd highest among the states.

5.4%

CA Unemployment Rate

California’s reported unemployment rate (seasonally adjusted) was unchanged at 5.4%. The US rate edged up 0.1 point to 4.1%.

Among the states, California again had the second highest unemployment rate, tied with Michigan and DC and just behind Nevada.

Interactive Original
https://www.bls.gov/charts/state-employment-and-unemployment/state-unemployment-rates-map.htm

10.8k

CA Employment Rate

Employment rose by 10,800 (seasonally adjusted).  

US employment fell by 588,000.

California unemployment dipped up by 8,200, while US unemployment notched up by 203,000.  California unemployment has been above 1 million for the past 14 months in a row, the highest levels since the pandemic period in 2021.

62.1%

CA Labor Force Participation Rate

California labor force (seasonally adjusted) was essentially unchanged with a gain of only 2,600, while the labor force participation rate was level at 62.1%. The US labor force edged down by 385,000, while the participation rate dipped 0.2 point to 62.4%.

Recovery Progress: CA Employment vs. Other States

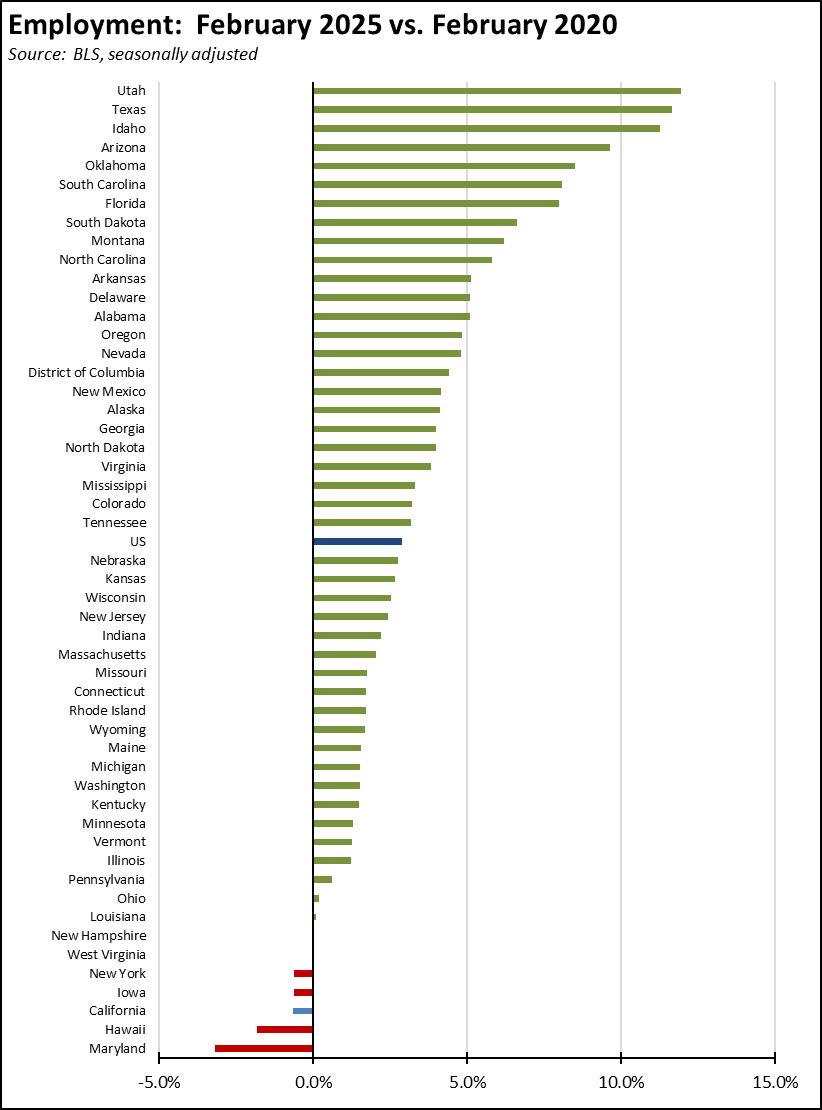
Compared to the pre-pandemic peak in February 2020, California’s relative ranking for employment recovery fell marginally to 3rd lowest among the states and DC. California is one of only 5 states still short of full recovery from the pandemic employment losses.
Nonfarm Jobs

-7.5k

Nonfarm Jobs Change

Nonfarm wage and salary jobs (seasonally adjusted) were down 7,500 in the preliminary results for February, while the while January was revised to a loss of 21,400.

For the US as a whole, nonfarm jobs rose 151,000 in February.

Wages & Hours

5.9%

12-month Change in Average Hourly Wage

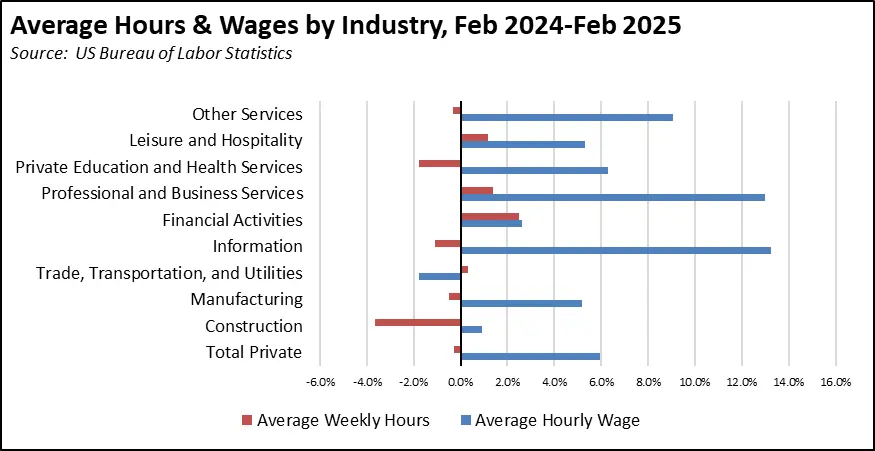
In the seasonally unadjusted data, private average hourly wage rose 5.9% over the year, and saw only a minor offset through a 0.3% dip in the average number of hours worked weekly.  Strongest wage gains were in tech-containing Information and Professional & Business Services.  Trade, Transportation & Utilities was the only industry to post a dip in hourly wage.

Recovery Progress: CA Nonfarm Jobs vs. Other States
Interactive Original
https://www.bls.gov/charts/state-employment-and-unemployment/change-in-nonfarm-employment-by-state-map.htm

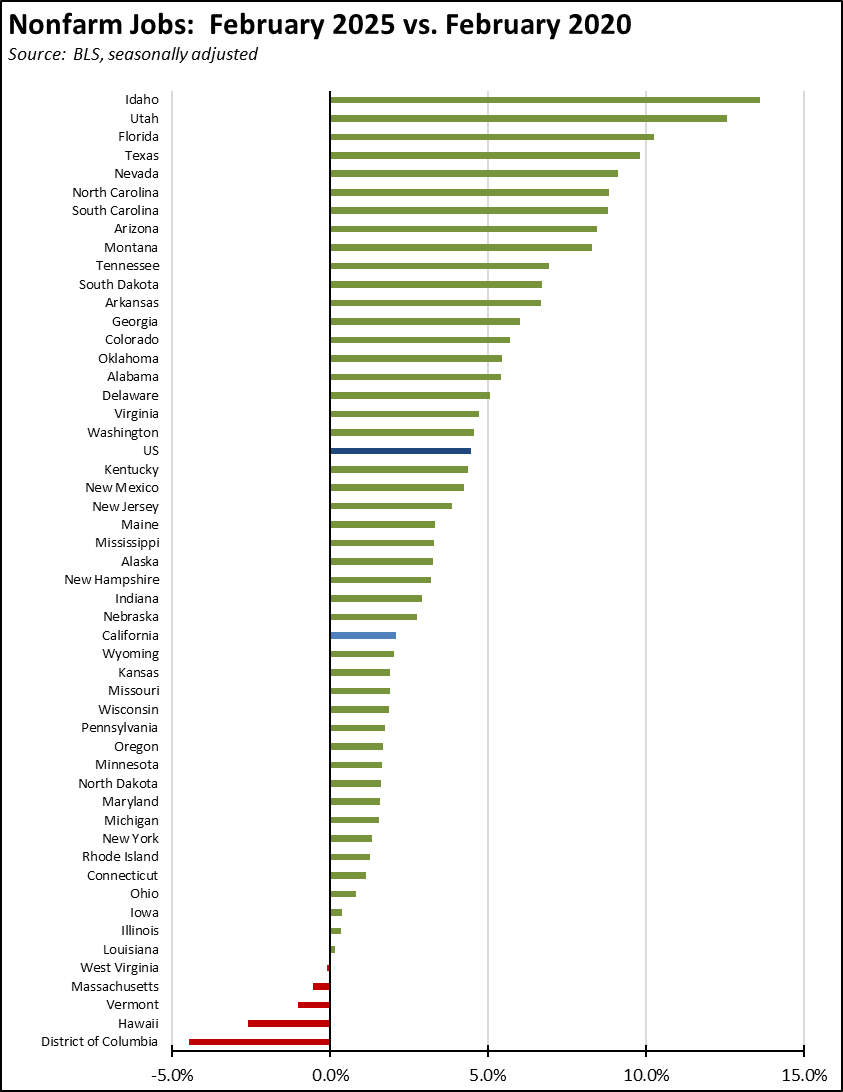
California’s monthly job performance in February was the 49th highest among the states and DC. Adjusted for size, California’s recovery level compared to the pre-pandemic peaks notched up to 29th highest, while only 4 states and DC have yet to show positive recovery.
Unemployment Rates by Region

Unemployment rates (not seasonally adjusted) were higher in all regions compared to pre-pandemic February 2020 levels.

Unemployment Rate by Region

Source:  EDD, not seasonally adjusted
Feb-25Feb-20
California5.54.3
Orange County3.92.8
Bay Area4.22.7
Sacramento4.93.7
San Diego/Imperial4.93.8
Inland Empire5.13.9
Central Sierra5.74.5
Los Angeles5.84.3
Upstate California7.16.3
Central Coast7.97.0
Central Valley8.88.4

Counties with Double-Digit Unemployment

8

Counties with Unemployment Above 10%

The number of counties with an unemployment rate (not seasonally adjusted) at 10% or more rose to 8. The unadjusted rates ranged from 3.7% in San Mateo and Inyo to 18.5% in Colusa.

Unemployment Rate by Legislative District

The estimated unemployment rates are shown below for the highest and lowest districts. The full data and methodology are available on the Center’s website.

LowestCD40 Kim (R)3.5SD40 Jones (R)3.4AD76 Maienschein (D)3.5
CD50 Peters (D)3.5SD38 Blakespear (D)3.6AD19 Ting (D)3.5
CD11 Pelosi (D)3.8SD13 Becker (D)3.7AD16 Bauer-Kahan (D)3.5
CD47 Porter (D)3.8SD11 Wiener (D)3.8AD72 Dixon (R)3.6
CD15 Mullin (D)3.9SD37 Min (D)3.8AD26 Low (D)3.7
CD16 Eshoo (D)3.9SD10 Wahab (D)4.1AD68 Valencia (D)3.7
CD49 Levin (D)3.9SD34 Umberg (D)4.1AD23 Berman (D)3.8
CD17 Khanna (D)4.0SD36 Nguyen (R)4.2AD21 Papan (D)3.8
CD10 DeSaulnier (D)4.0SD15 Cortese (D)4.3AD77 Boerner Horvath (D)3.9
CD46 Correa (D)4.1SD09 Skinner (D)4.4AD73 Petrie-Norris (D)3.9
HighestCD48 Issa (R)6.8SD26 Durazo (D)6.4AD30 Addis (D)6.9
CD02 Huffman (D)6.9SD04 Alvarado-Gil (D)6.5AD34 Lackey (R)7.1
CD03 Kiley (R)7.0SD28 Smallwood-Cuevas (D)6.9AD22 Alanis (R)7.7
CD51 Jacobs (D)7.1SD01 Dahle (R)7.0AD29 Rivas (D)7.8
CD45 Steel (R)7.4SD12 Grove (R)7.0AD57 Jones-Sawyer (D)8.1
CD38 Sánchez (D)7.6SD35 Bradford (D)7.0AD32 Fong (R)9.3
CD35 Torres (D)8.3SD18 Padilla (D)7.8AD35 Bains (D)9.9
CD28 Chu (D)10.1SD17 Laird (D)8.1AD27 Soria (D)9.9
CD33 Aguilar (D)10.9SD14 Caballero (D)10.9AD31 Arambula (D)10.4
CD24 Carbajal (D)11.2SD16 Hurtado (D)11.4AD33 Mathis (R)11.1