The Center for Jobs and the Economy has released our initial analysis of the July Employment Report from the California Employment Development Department. The EDD and BLS releases are again on different schedules. Data for the other states will be addressed in our Full Jobs Report after it is released by Bureau of Labor Statistics next Tuesday. For additional information and data about the California economy visit www.centerforjobs.org/ca.
Highlights for policy makers:
- Nonfarm Jobs Rise 15,000 in the Preliminary Estimate; 9,700 Loss to Date for 2025
- Uncertainty in the Monthly Preliminary Estimates
- California Labor Force
- Nonfarm Jobs
- Counties with Double-Digit Unemployment
- Unemployment Insurance Claims Continue to Follow 2024 Trend
Nonfarm Jobs Rise 15,000 in the Preliminary Estimate; 9,700 Loss to Date for 2025
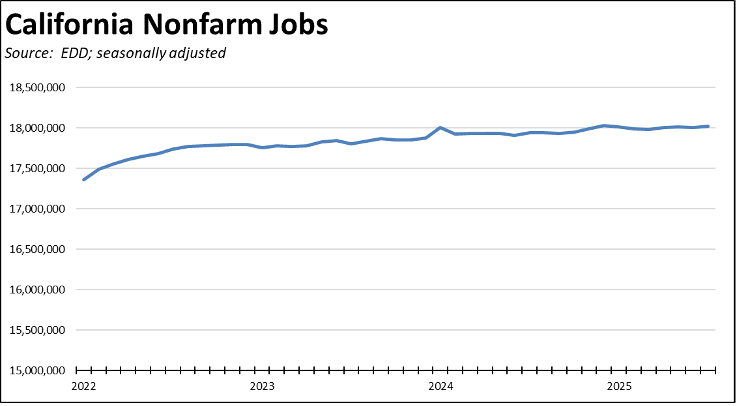
Nonfarm wage and salary jobs (seasonally adjusted) rose 15,000 in the preliminary estimate for July. The 6,100 loss in June was revised lower to a loss of 9,500. The cumulative result to date in 2025 is a loss of 9,700 nonfarm jobs. All of these numbers are subject to change in the annual revisions to be released in early 2026.
Regardless of the final revisions, the jobs data continues to indicate the state’s economy has essentially stalled, and these conditions have existed well before the current tariff and immigration enforcement actions. Compared to the previous peak in January 2024, the preliminary numbers indicate nonfarm jobs have only grown by only 12,700 over the 18 months.
Uncertainty in the Monthly Preliminary Estimates
As covered in a number of recent articles and as will be detailed in a forthcoming Substack piece, concerns have been increasing over the extent to which the monthly preliminary estimates now deviate from the subsequent revisions. These include both the monthly revisions as the underlying survey data response rate improves over a three-month period and the annual benchmark revisions based on the complete counts in the Quarterly Census of Employment & Wages (QCEW). For example, the Legislative Analysts’ Office now reports a “Hybrid Measure” that combines the results from the establishment survey used to estimate wage and salary jobs and the household survey used to estimate the labor force numbers.
In the case of California, the cumulative effect of these revisions since 2023 has been almost uniformly negative and substantial. The chart below tracks the cumulative changes by comparing the preliminary monthly release with the current estimates incorporating both the annual and monthly revisions. Also shown are the preliminary estimates of what next year’s annual revisions will produce, taken from the Philadelphia Federal Reserve Bank Early Benchmark series.
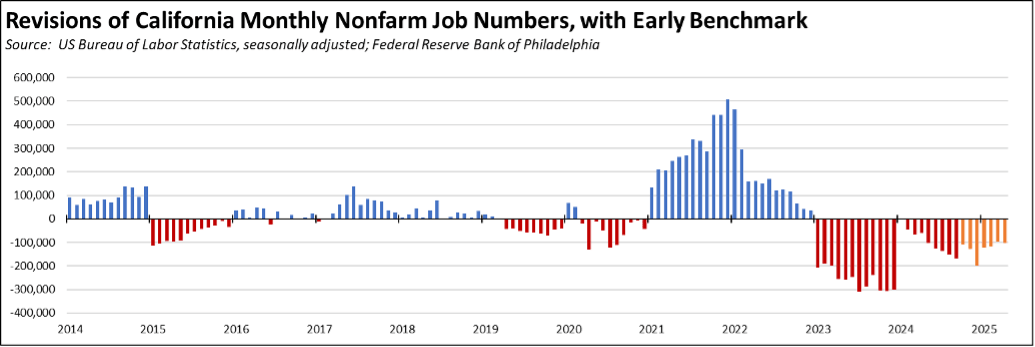
The monthly estimates, consequently, also have to be considered from this perspective—they likely are too high and under the current QCEW results are likely to be lowered by just over 100,000 in next year’s revisions. Additional information on the likely outcome will be gleaned from the release of the first quarter data—which provides the data benchmark in the job estimation model—now scheduled for September 9 followed shortly by the BLS preliminary benchmark revision information for the US and the states.
To help put the preliminary monthly estimates in perspective, the following chart will be used to track both the monthly and annual revisions. Under the Early Benchmark column, both the early benchmark calculations from the Philly Fed are shown along with their extended forecast months (shaded). All the Change columns are calculated as the difference from the Preliminary Estimates.
By industry, jobs growth continued to be dominated by government and government-supported Healthcare & Social Assistance. Other private industries saw a loss of 15,600 for the month and 132,500 for the year, although the trade related industries and real estate posted some gains within this total. Overall, other private industries have experienced the loss of 390,000 jobs since their peak in September 2022. Federal government jobs were off 400 for the month, and off 4,700 since their peak last October.
California Labor Force
Nonfarm Jobs
Counties with Double-Digit Unemployment
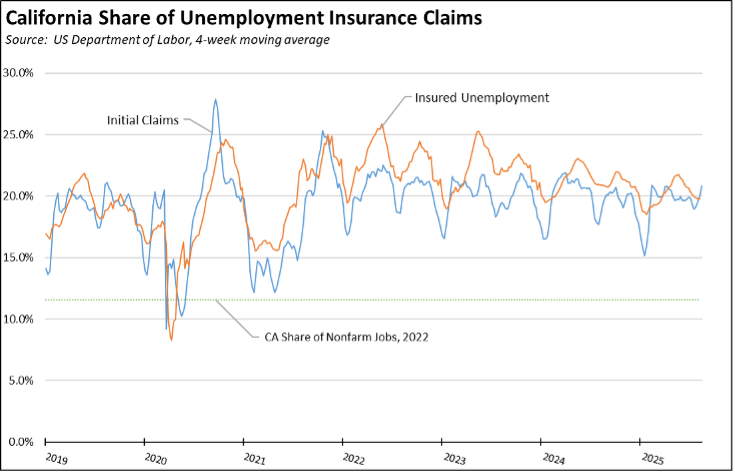
Unemployment Insurance Claims Continue to Follow 2024 Trend
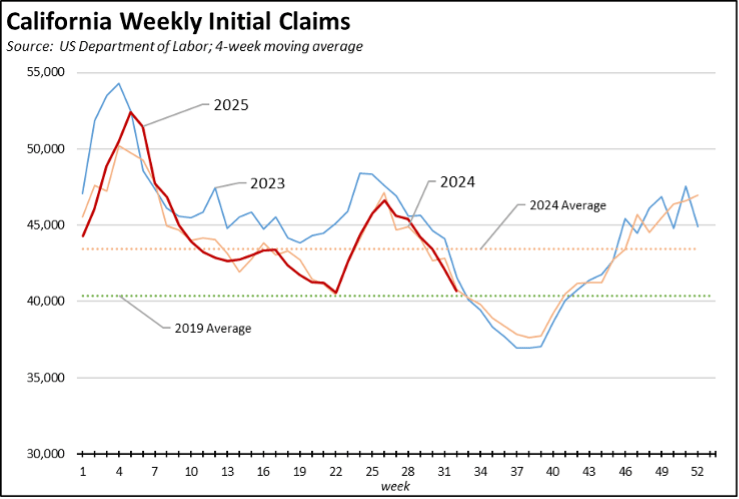
Initial claims continue to largely follow the 2024 trend.
As does insured unemployment, a proxy for continuing claims.
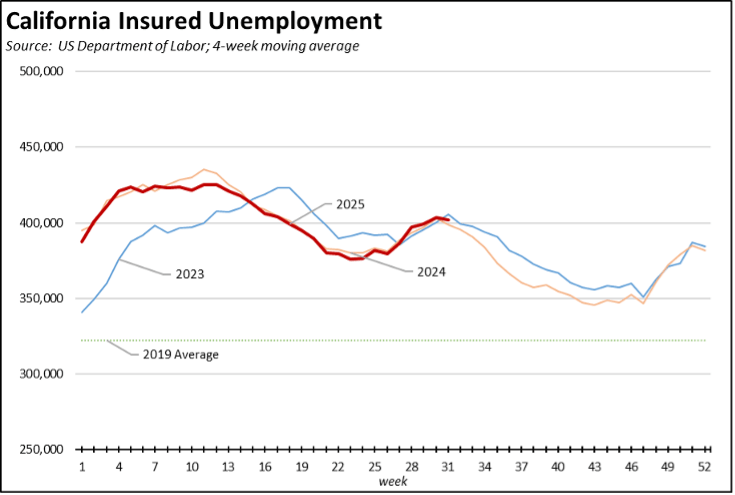
Combined, California’s poor job creation performance continues to keep workers far more reliant on unemployment insurance benefits than in other states. Using the 4-week moving averages compared to its overall 11.3% of all nonfarm jobs, California in the latest data contained 20.8% of initial claims and 19.8% of all insured unemployment.