
The Center for Jobs and the Economy has released our initial analysis of the July labor force and jobs data. For additional information and data about the California economy visit www.centerforjobs.org/ca.
Nonfarm Jobs Drop 20,500
In the preliminary numbers, seasonally adjusted nonfarm jobs fell by 20,500, while the June numbers were revised from a loss of 2,900 to a gain of 6,100. California’s job gains were the 49th highest among the states, which were led by Illinois (11,700), Maryland (11,700), and Washington (11,600). Since January, California has lost 11,300 jobs.
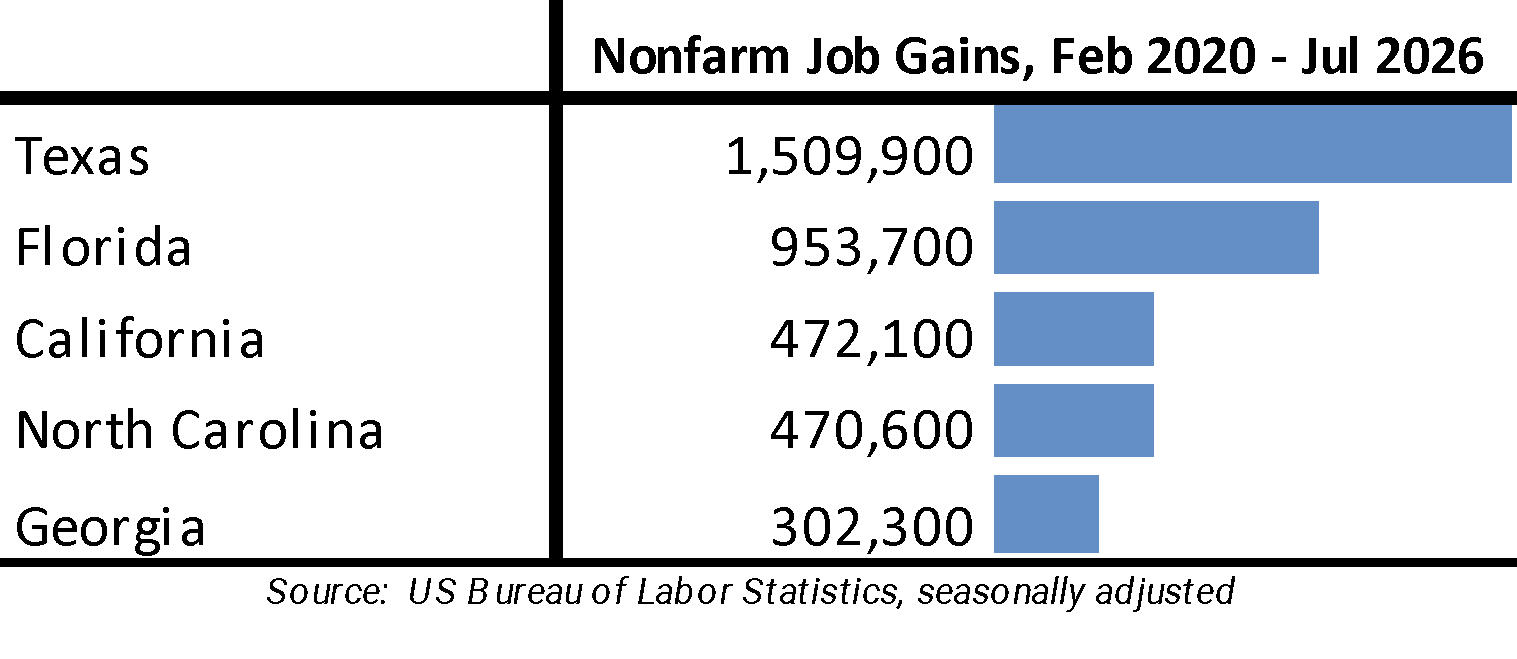
Looking at net total nonfarm job gains compared to pre-pandemic peaks, California remained in 3rd place but only barely at only 1,500 jobs more than much smaller North Carolina.
By industry, there were small job gains of 2,100 from government and government-supported Health Care & Social Assistance, which were more than offset by a 22,600 loss in the Other Private Industries. To date, the bulk of job growth (100,100) came from government and government-supported jobs, but the Other Private Industries showed some gains (12,600) in Education and Retail Trade and lower wage Accommodation & Food Services and Other Services.
The labor force numbers were even more disappointing. The number of employed workers dropped by another 52,200, bringing total losses over the year to 197,500 or a drop of 1.1%. After previous gains, the number of workers employed in the state is now 226,500 lower than the peak prior to the pandemic.
California Unemployment Rate 3rd Highest Among the States
California Unemployment
California’s seasonally adjusted unemployment rate fell again to 5.1%, but only as the labor force continued to contract by another 70,200 workers. California had the 3rd highest rate among the states which were led by Connecticut and Oregon at 5.2% each (DC was higher at 5.9%). The US unemployment rate dipped the same amount to 4.1%, also because of contraction in the labor force.
Total number of unemployed also continued to contract as workers unable to find a job continued to leave the labor force. The number of unemployed dropped by 18,000 but with the total remaining above the 1 million level since January 2024. The number of unemployed nationally also fell, by 218,000.
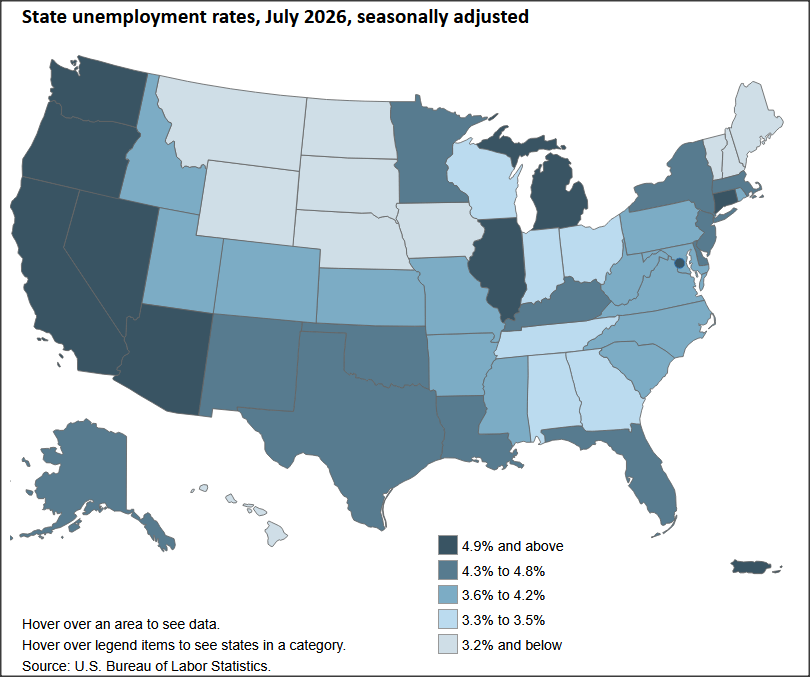
Interactive original: https://www.bls.gov/charts/state-employment-and-unemployment/state-unemployment-rates-map.htm
The Latino unemployment rate fell from 5.7% to 5.5%, but remained higher than the comparable rates for the state (5.1%), Whites (4.9%), and Asians (4.0%). Blacks retained the highest unemployment rate at 8.4%.
The demographic data, which is taken from a 12-month moving average of the Current Population Survey data (currently, 11 months since the October survey was not done), is not directly comparable to the headline monthly data which is based on the same survey data but which is estimated using labor force models. The demographic data, however, is useful for showing the relative labor force status of these groups.
Employment fell by 52,200 (seasonally adjusted) in the preliminary estimate and was down 197,500 for the year.
Nationally, total employment edged down 87,000 in the preliminary estimate for the month, and off 963,000 for the year.
California labor force (seasonally adjusted) was down by 70,200, with the labor force participation rate level falling 0.2 point to 61.6%. The US labor force was down by 264,000, pushing the participation rate down 0.1 point to 61.4%.
Employment Recovery Progress
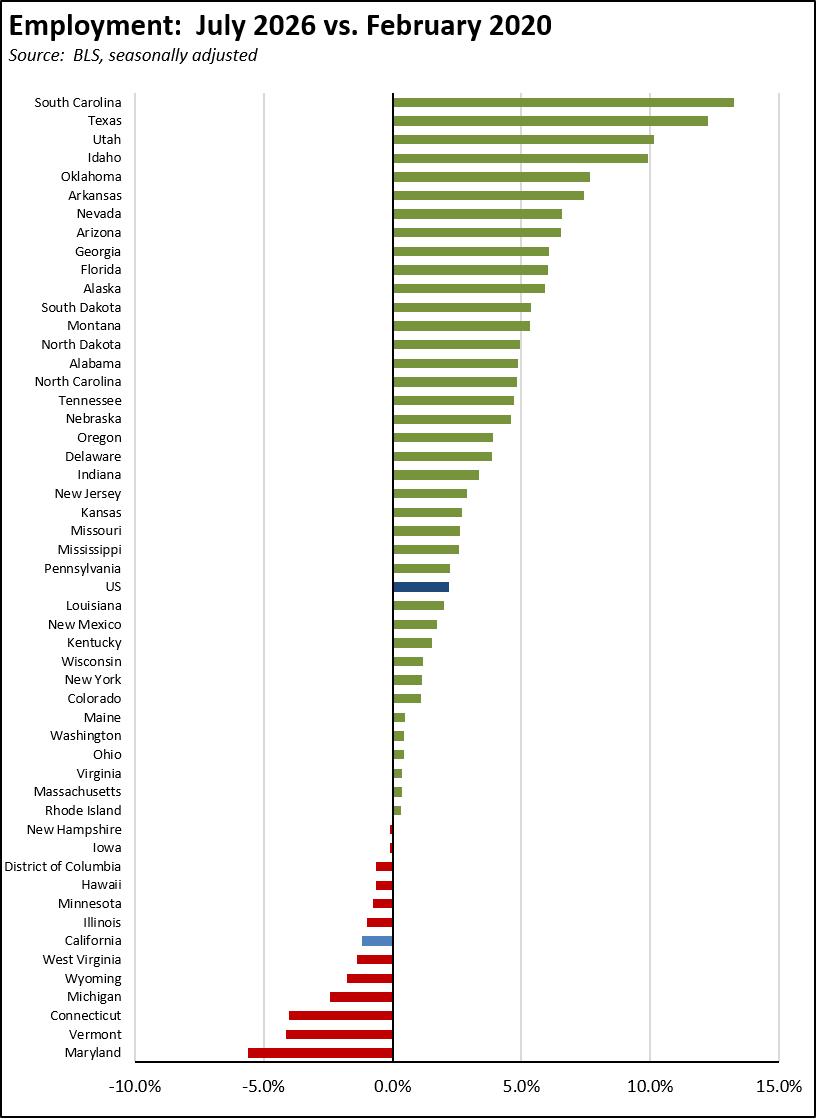
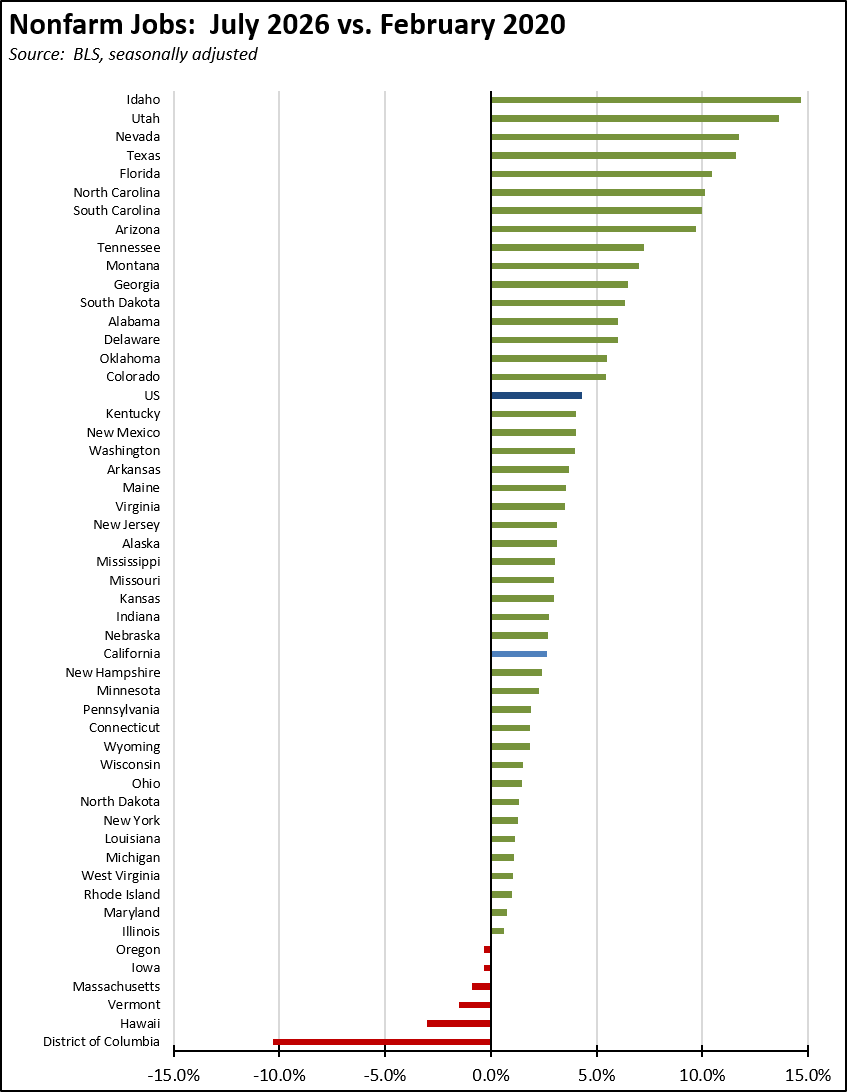
Due to the weak labor force numbers, California again remained below its pre-pandemic employment levels, off 226,500 from the peak. Adjusted by size, California’s performance remained the 45th worst among the states and DC. As indicated in the chart, states with lower tax and lower regulatory burdens—including several adopting lower individual and business tax rates in recent years—have been far more successful in expanding employment opportunities for their populations.
Nonfarm Jobs
Nonfarm wage and salary jobs (seasonally adjusted) fell 20,500, while June was revised to a gain of 6,100.
For the US as a whole, nonfarm jobs were down nominally by 23,000.
Recovery Progress: CA Nonfarm Jobs vs. Other States
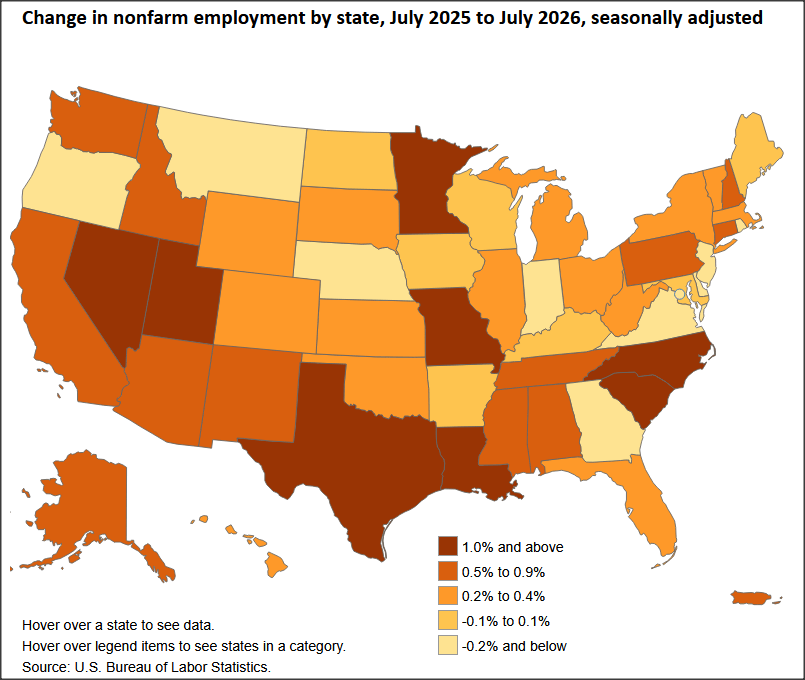
Interactive original: https://www.bls.gov/charts/state-employment-and-unemployment/change-in-nonfarm-employment-by-state-map.htm
California’s monthly job performance in July was the 49th highest among the states and DC. Adjusted for size, California’s recovery level compared to the pre-pandemic peaks fell to 30th highest, while only 5 states and DC have yet to show positive recovery.
Wages & Hours
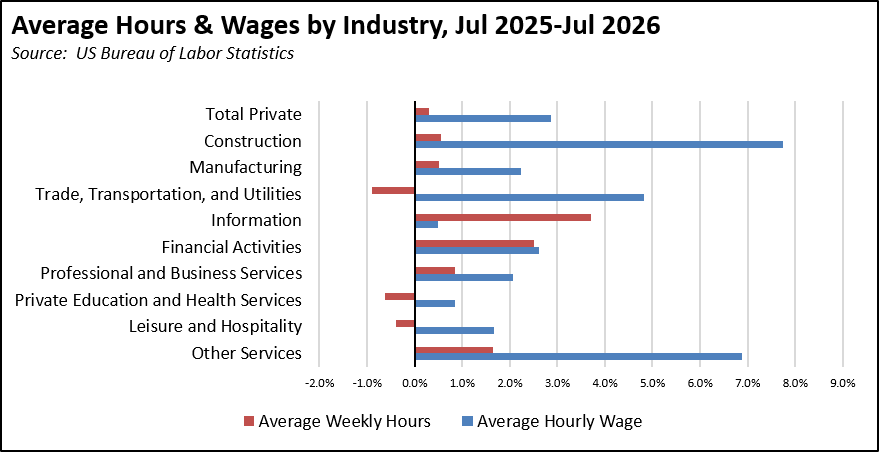
In the seasonally unadjusted data, private average hourly wage rose 2.9% over the year, ranging from 0.5% in Information to 7.7% in Construction. The wage gain, however, fell below inflation which as measured by the CPI-U was 3.4%. The change in weekly hours, however, was more mixed and generally more positive than it has been recently. Overall, average private weekly hours were little changed with a gain of only 1.7%, but ranged from a dip of 0.9% for Trade, Transportation & Utilities to a stronger gain of 3.7% for Information.
Unemployment Rates by Region
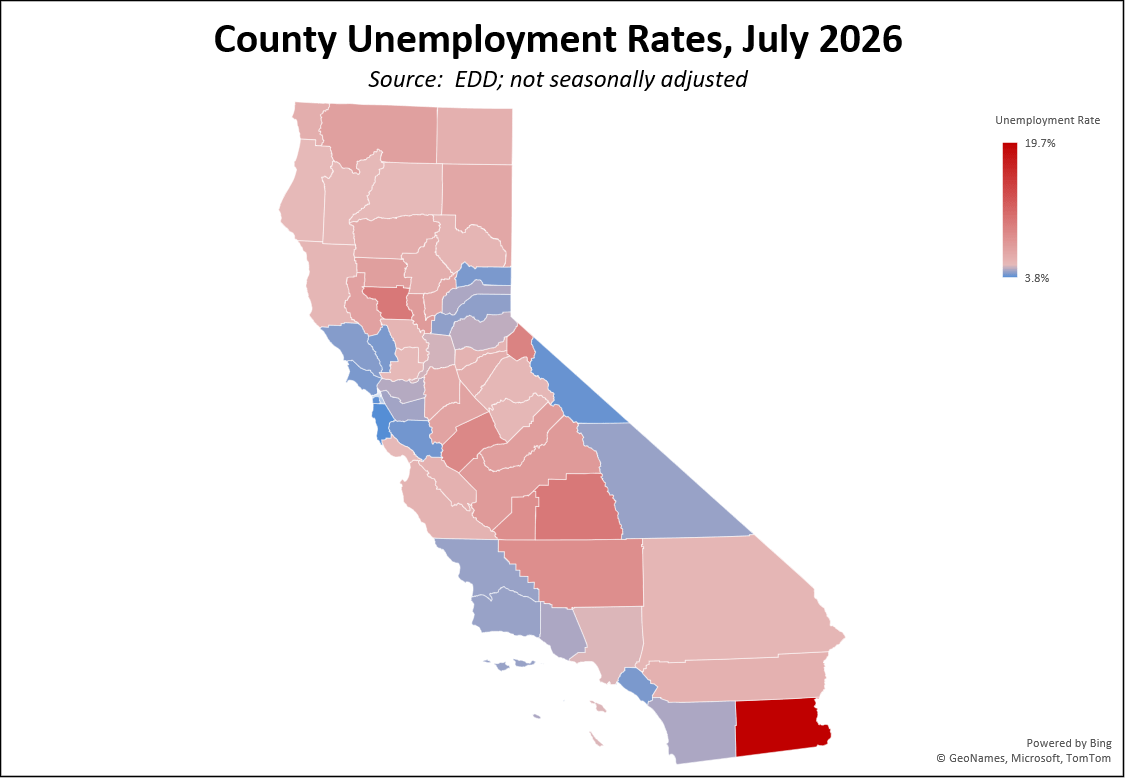
Unemployment rates (not seasonally adjusted) ranged from 4.2% in Orange County to 7.9% in the Central Valley.
Counties with Double-Digit Unemployment
The number of counties with an unemployment rate (not seasonally adjusted) at 10% remained at 3. The unadjusted rates ranged from 3.8% in San Mateo to nearly a fifth of all workers in Imperial.
Unemployment Rate by Legislative District
The estimated unemployment rates are shown below for the highest and lowest districts. The full data and methodology are available on the Center’s website.