The Center for Jobs and the Economy has released our initial analysis of the March labor force and jobs data. For additional information and data about the California economy visit www.centerforjobs.org/ca.
Highlights for policy makers:
- Nonfarm Jobs Drop for 3rd Month in a Row
- California Unemployment Rate Dips to 5.3%
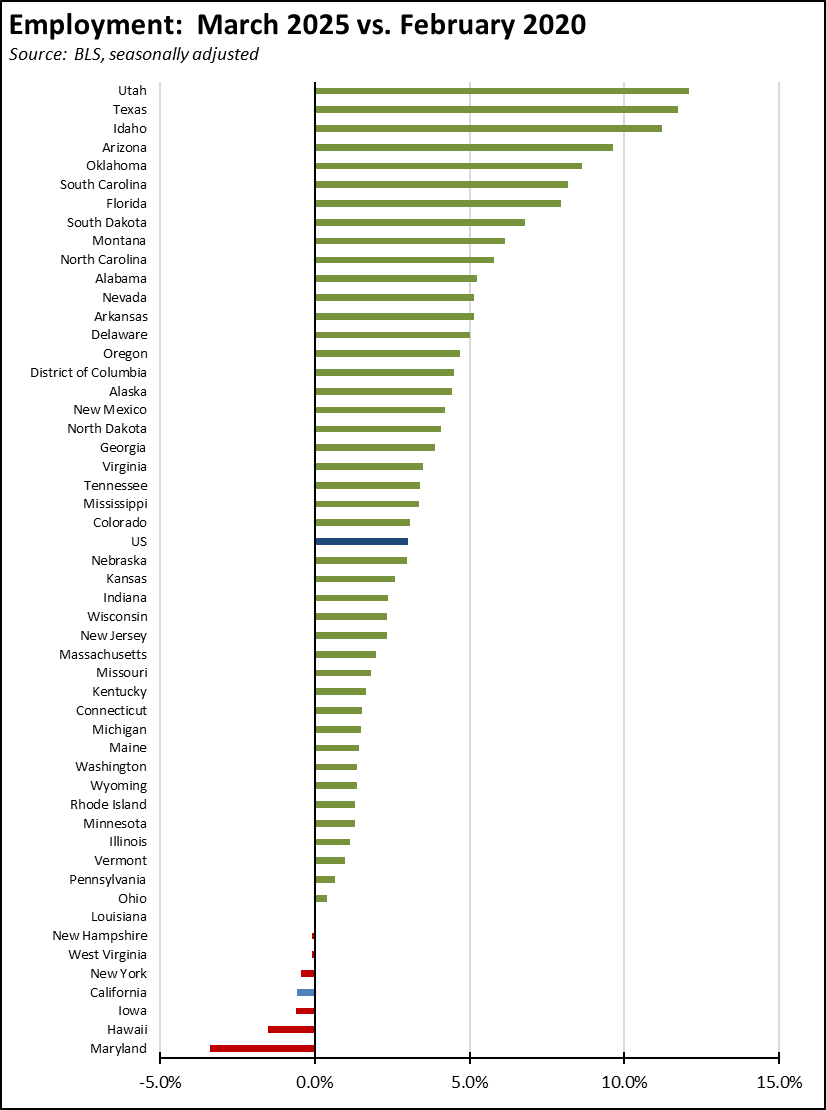
- Recovery Progress: CA Employment vs. Other States
- Nonfarm Jobs
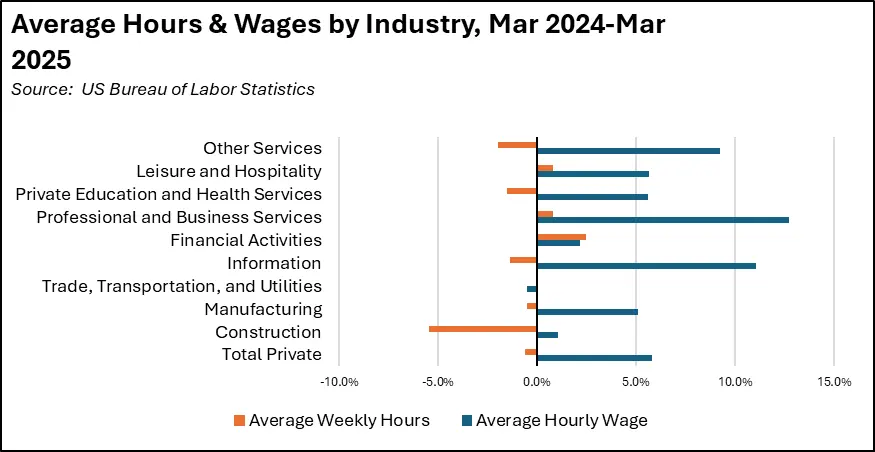
- Wages & Hours
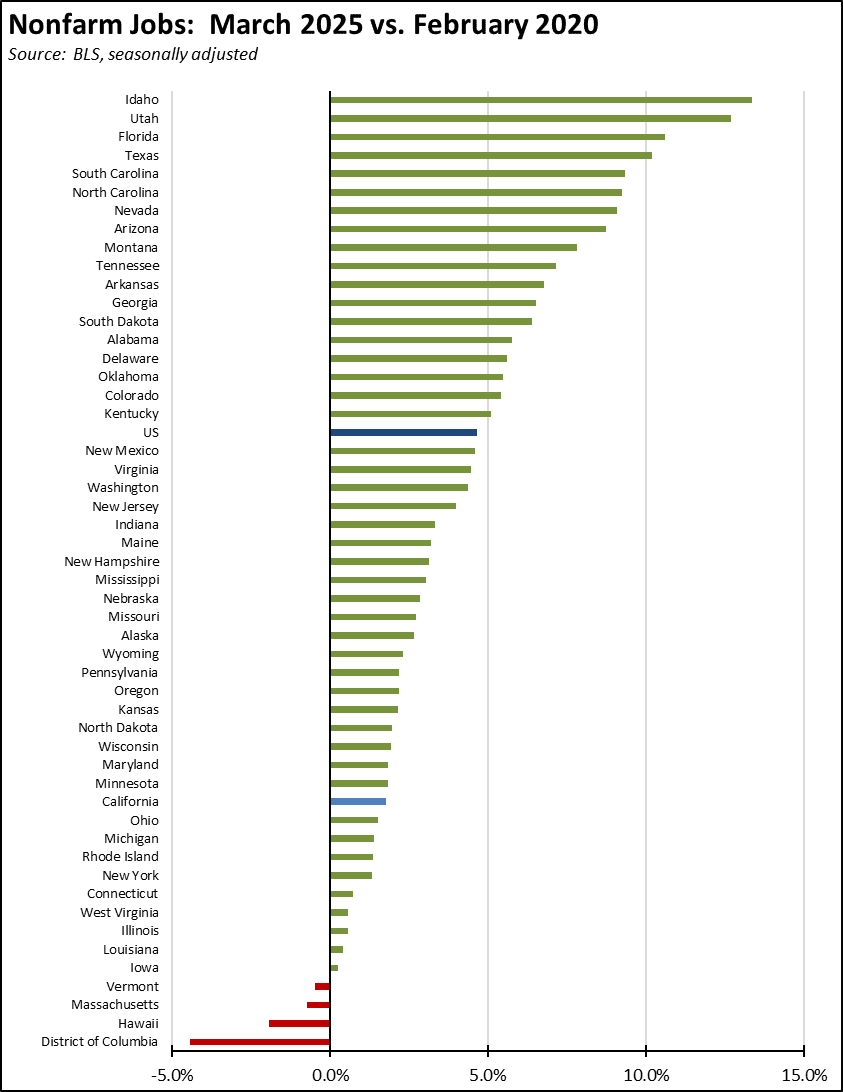
- Recovery Progress: CA Nonfarm Jobs vs. Other States
Nonfarm Jobs Drop for 3rd Month in a Row
In the preliminary numbers, seasonally adjusted nonfarm jobs fell 11,600 in March. The February numbers were revised from a preliminary result of a 7,500 loss to 21,800. The March number was the worst among the states and DC, with jobs led by Texas with a gain of 26,500 followed by Pennsylvania at 20,900 and Florida at 18,100.
March was the 3rd month in a row of losses for California. Overall, nonfarm jobs are off 54,800 since December. While this cumulative loss represents only 0.3% of total nonfarm jobs, California’s preliminary numbers have seen substantial downgrades in the annual revisions in recent years, suggesting the loss may be somewhat greater. The results from the first quarter at best indicate the state’s economy is running in place rather than the expanding at the rate required to close the current $10 to $30 billion annual gap in the state’s budget numbers over at least the next 5 years.
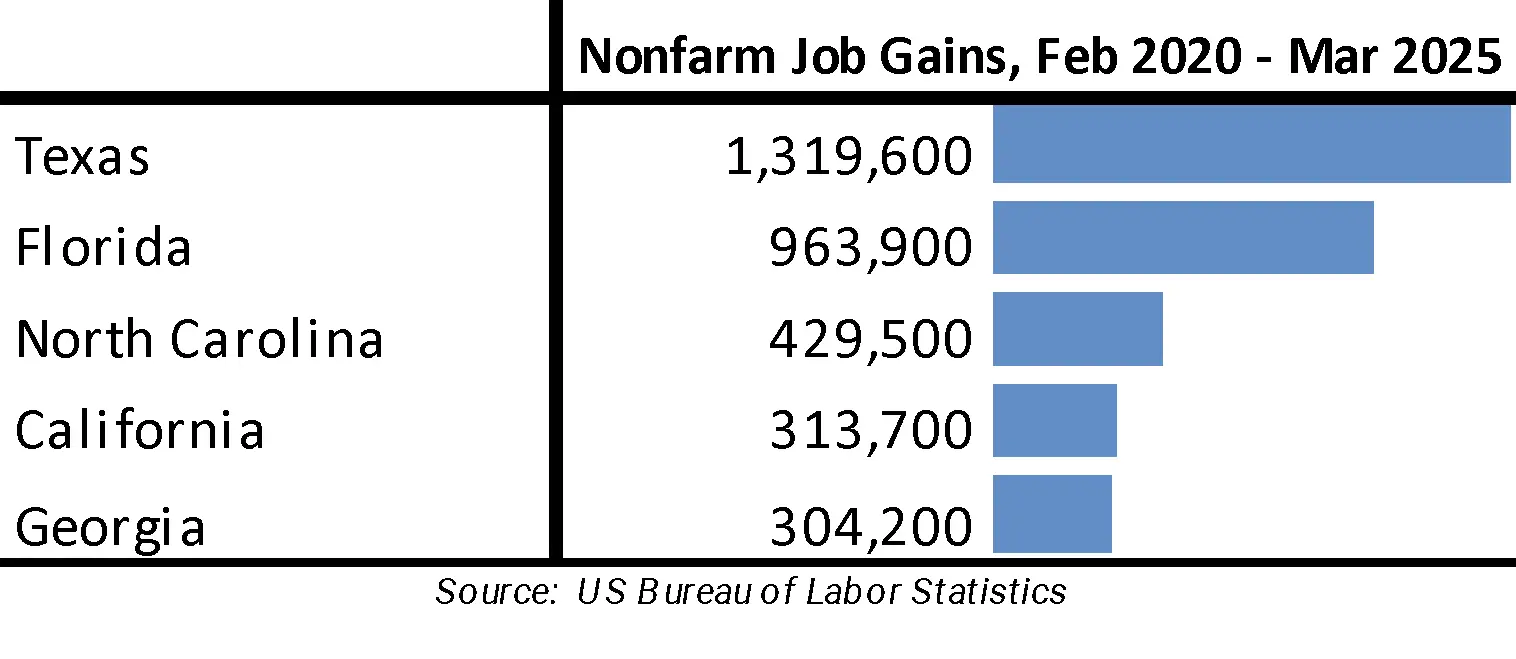
Looking at net total nonfarm job gains compared to pre-pandemic peaks, California remained in 4th place. However, California is now only 9,500 ahead of 5th place Georgia and losing ground fast.
By industry, both government and government-dependent Healthcare & Social Assistance again showed gains by 15,200 in March, but these were offset by a 26,800 drop in the other private industries. Only some gains were reported within this last category, including Other Services (2,800), Private Educational Services (2,200), Information (2,600), and Retail Trade (1,100). These gains were more than offset by greater losses in industries led by Transportation, Warehousing & Utilities (-8,600), Accommodation & Food Services (-6,400), and tech-containing Professional, Scientific & Technical Services (-4,100).
California Unemployment Rate Dips to 5.3%
The labor force numbers largely were in positive territory but at levels indicating no significant change. California’s seasonally adjusted unemployment rate dipped to 5.3%, also easing to 4th highest among the states, behind Nevada, DC, and Michigan. The US unemployment rate edged up 0.1 point to 4.2% as the labor force expanded. Total unemployed notched down by 7,000 but remained above the 1 million level for the 15th month in a row.
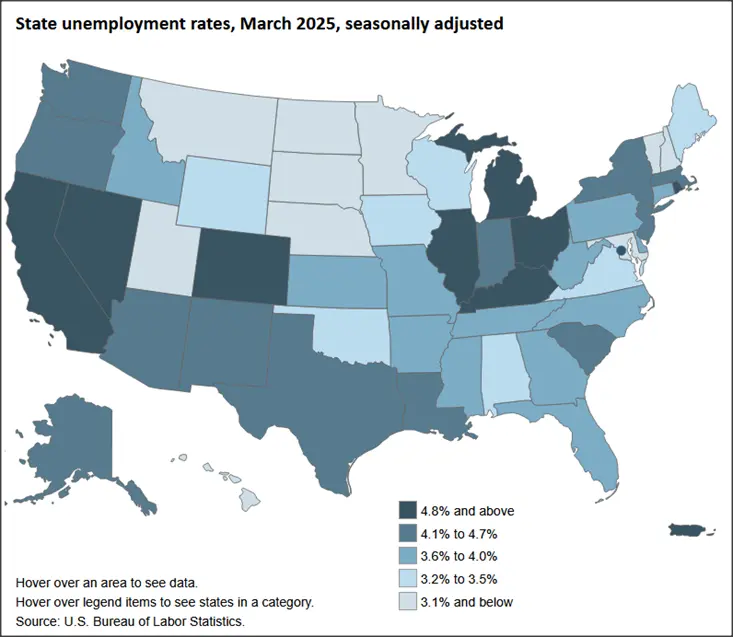
Interactive Original
https://www.bls.gov/charts/state-employment-and-unemployment/state-unemployment-rates-map.htm
Recovery Progress: CA Employment vs. Other States
Compared to the pre-pandemic peak in February 2020, California’s relative ranking for employment recovery improved marginally to 4th lowest among the states and DC. California is one of only 7 states still short of full recovery from the pandemic employment losses.
Nonfarm Jobs
Wages & Hours
Recovery Progress: CA Nonfarm Jobs vs. Other States
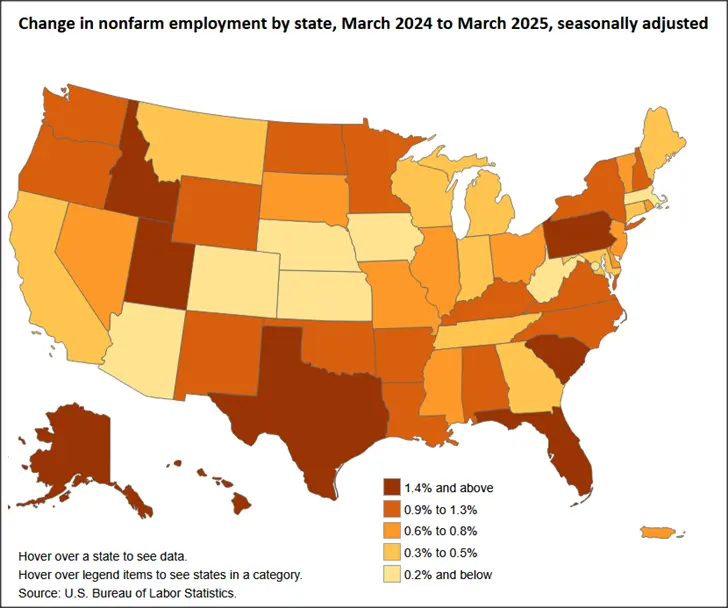
Interactive Original
https://www.bls.gov/charts/state-employment-and-unemployment/change-in-nonfarm-employment-by-state-map.htm
California’s monthly job performance in March was the worst among the states and DC. Adjusted for size, California’s recovery level compared to the pre-pandemic peaks was 38th highest, while only 3 states and DC have yet to show positive recovery.