The Center for Jobs and the Economy has released our initial analysis of the May Employment Report from the California Employment Development Department. The EDD and BLS releases are again out of sync, and data for the other states will be addressed in our Full Jobs Report after it is released by Bureau of Labor Statistics next Tuesday. For additional information and data about the California economy visit www.centerforjobs.org/ca.
Highlights for policy makers:
- Nonfarm Jobs Rise 17,700 in May; 9,200 Loss to Date for 2025
- California Labor Force
- Nonfarm Jobs
- Counties with Double-Digit Unemployment
- Unemployment Insurance Claims Continue to Follow 2024 Trend
Nonfarm Jobs Rise 17,700 in May; 9,200 Loss to Date for 2025
For the second time in 2025, California posted positive job numbers, with a preliminary gain of 17,700 in May. The 17,700 preliminary gain in April was revised to 23,100.
Cumulatively, the two-month gain still has not offset losses in the first 3 months of the year. To date in 2025, nonfarm jobs have shown essentially no change, with a cumulative loss of 9,200. Compared to the previous near-term peak in January 2024, the cumulative gain has been only 13,200.
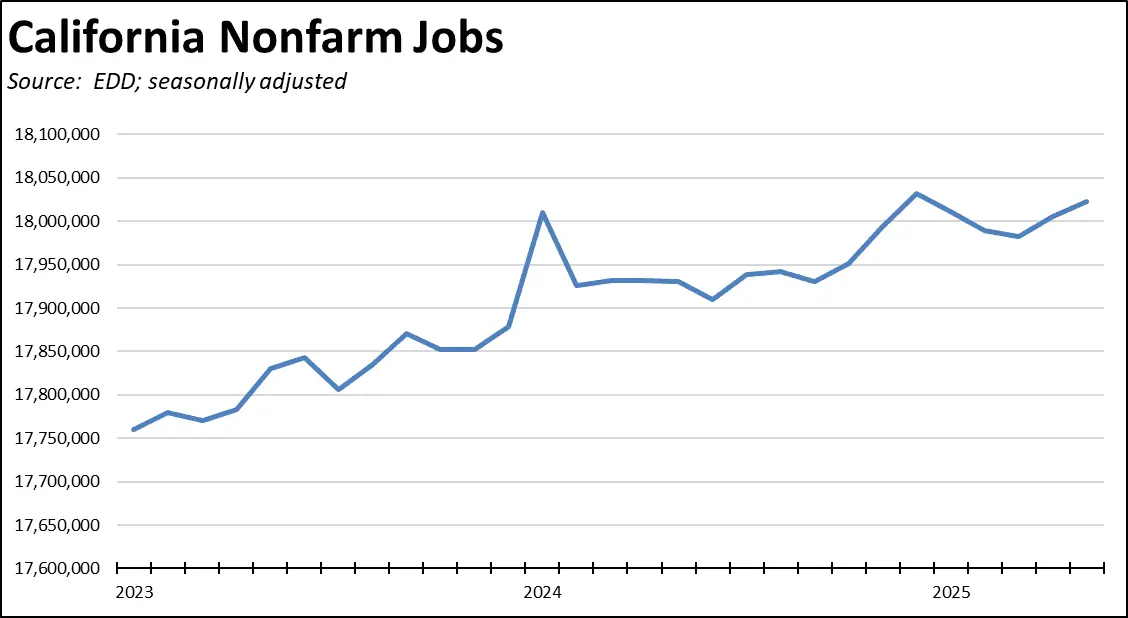
By industry, jobs growth continued to be dominated by government and government-supported Healthcare & Social Assistance. Other private industries, however, saw a small gain of 2,000 primarily due to growth in Accommodation & Food Services. Overall, other private industries have experienced the loss of 346,900 jobs since their peak in September 2022. Federal government jobs were off 2,700 for the month, and off 4,500 since their peak last October.
California Labor Force
Nonfarm Jobs
Counties with Double-Digit Unemployment
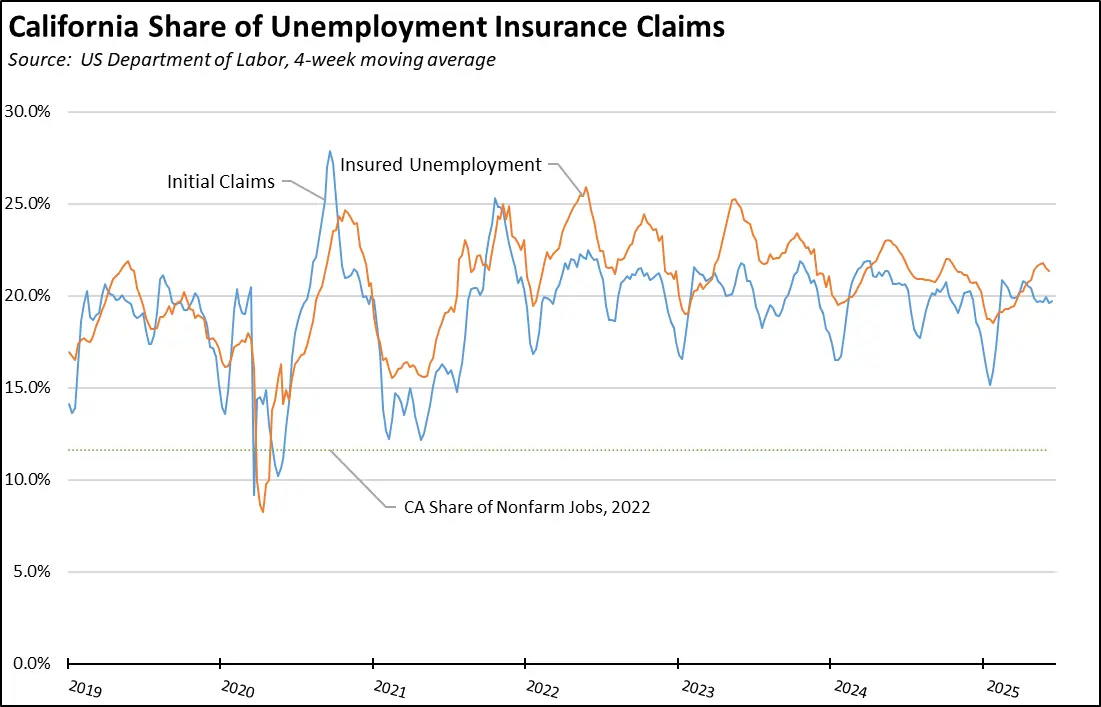
Unemployment Insurance Claims Continue to Follow 2024 Trend
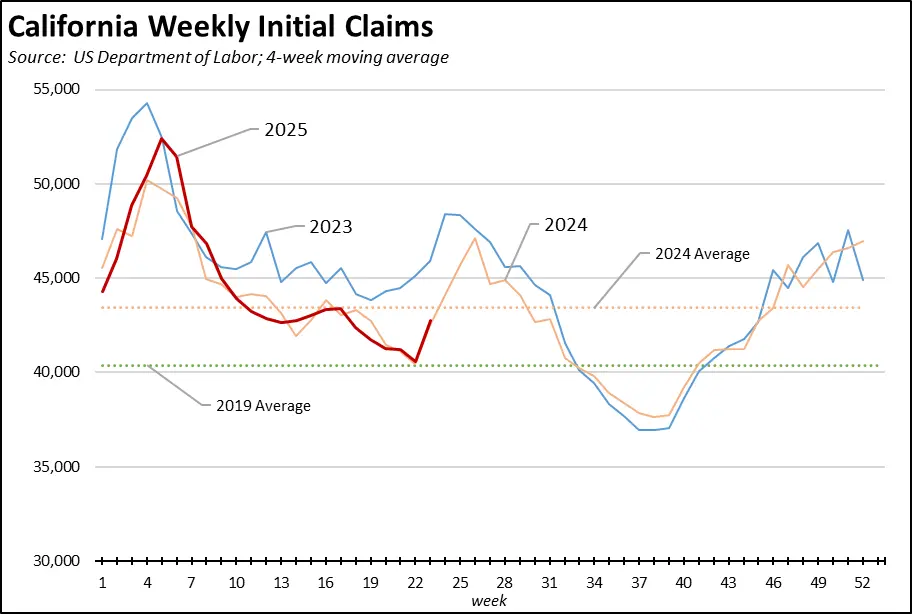
With a sharp uptick in initial claims, the unemployment insurance program continues to largely follow the 2024 trend.
As does insured unemployment, a proxy for continuing claims.
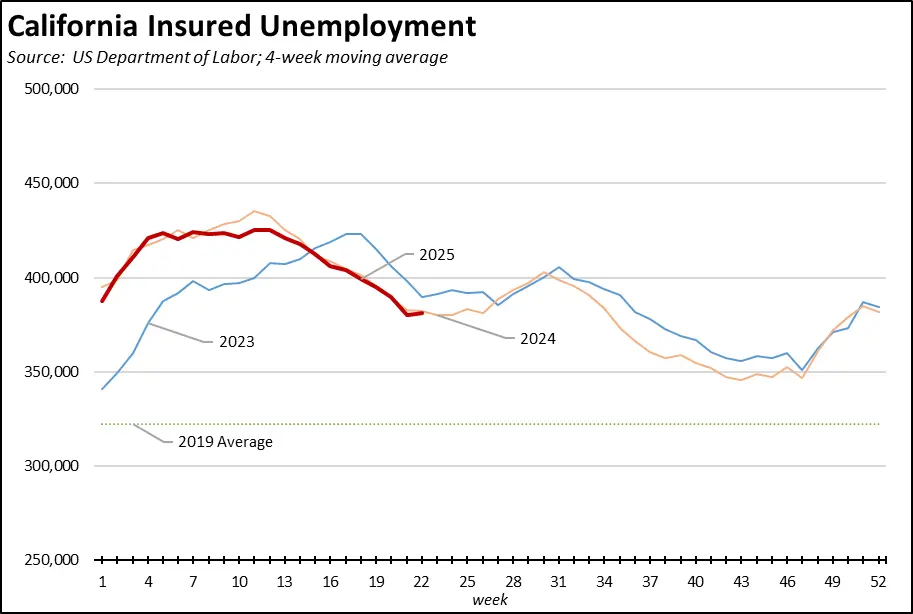
Combined, California’s poor job creation performance continues to keep workers far more reliant on unemployment insurance benefits than in other states. Using the 4-week moving averages compared to its overall 11.3% of all nonfarm jobs, California in the latest data contained 19.7% of initial claims and 21.4% of all insured unemployment.
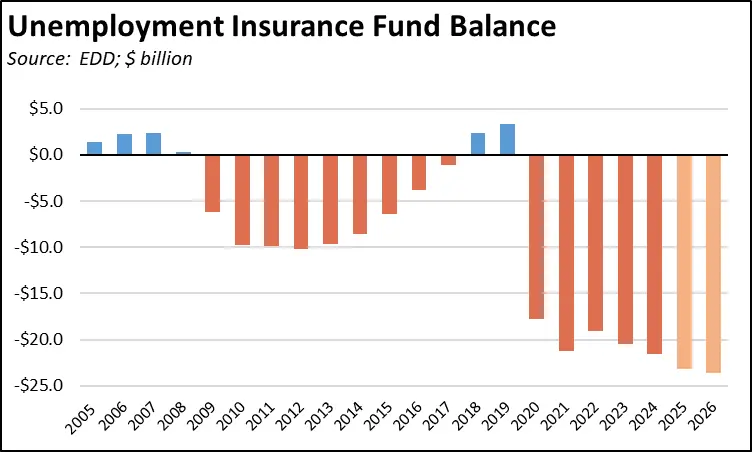
This overreliance of providing benefits to workers rather than jobs also is pushing the unemployment insurance fund further into functional bankruptcy. After diverting federal pandemic funds provided to pay off its substantial unemployment insurance debt to other uses, California remains only one of two states still carrying this debt. As a result, California employers now face rising employment taxes each year, further increasing the cost of creating new jobs. Yet in spite of rising taxes, the latest EDD forecasts only see this debt rising even further. The state’s debt to the federal government is now projected to grow from $19.1 billion at the end of the pandemic, to $23.7 billion in 2027. With unemployment remaining stubbornly high and possibly increasing if the state’s economy weakens further, the actual debt levels may increase further.