The Center for Jobs and the Economy has released our initial analysis of the May employment and labor force data. The EDD and BLS releases are again on different schedules. Data for the other states will be addressed in our Full Jobs Report after it is released by the Bureau of Labor Statistics this week. For additional information and data about the California economy visit www.centerforjobs.org/ca.
Nonfarm Jobs Rise 3,100
Nonfarm wage and salary jobs (seasonally adjusted) rose 3,100 in the preliminary estimate for May, while the preliminary loss estimate for April was revised to no change in jobs for the month.
By industry, the preliminary May numbers still show job gains coming solely from industries largely supported by public funds. However, growth still was seen in some of the Other Private Industries, including Arts, Entertainment & Recreation, Accommodation & Food Services, and Retail Trade.
California Labor Force
California Unemployment
California’s reported unemployment rate (seasonally adjusted) was unchanged at 5.3% as the labor force dipped by 0.3%. The US rate also was unchanged but based on a stable labor force number.
The Latino unemployment rate was unchanged at 5.8%, but remained higher than the comparable rates for the state (5.3%), Whites (5.0%), and Asians (4.0%). Blacks retained the highest unemployment rate at 9.0%. The demographic data, which is taken from a 12-month moving average of the Current Population Survey data, is not directly comparable to the headline monthly data which is based on the same survey data but which is estimated using labor force models. The demographic data, however, is useful for showing the relative labor force status of these groups.
Employment again fell, by 44,100 (seasonally adjusted) in May, while US employment rose by 144,000. California unemployment was largely unchanged with a dip of 8,800, while US unemployment dipped by 66,000. Even though there has been marginal improvement in the numbers so far this year, California unemployment has been above 1 million every month since January 2024, the highest levels since the pandemic period in 2021. Rather than people being able to find jobs, the year-to-date 55,700 improvement in the unemployment numbers has come as workers have left the labor force. Combined with a year-to-date drop of 154,400 in the number of employed workers, the labor force has fallen by 1.1%, further diminishing the potential for future jobs growth by reducing the available labor supply.
Nonfarm Jobs
Nonfarm wage and salary jobs (seasonally adjusted) in the preliminary estimate rose by 3,100, resulting in a total gain of 102,900 jobs for the year. For the US as a whole, nonfarm jobs rose 172,000 in May, while the previous two months were revised up by a total of 122,000. The US showed a gain of 503,000 for the year.
Counties with Double-Digit Unemployment
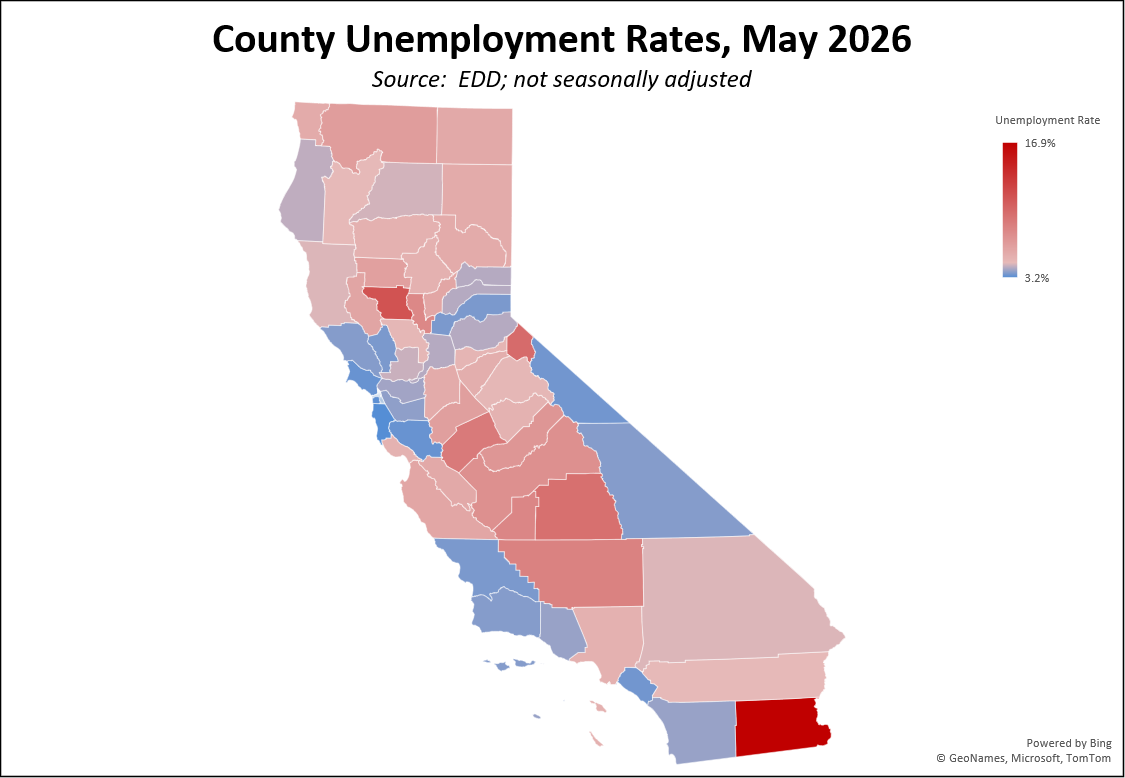
The number of counties with an unemployment rate (not seasonally adjusted) at 10% dropped to 2. The unadjusted rates ranged from 3.1% in San Mateo to 16.9% in Imperial.
In the chart, counties with rates higher than the state average are coded in red.