The Center for Jobs and the Economy has released our initial analysis of the November employment data. For additional information and data about the California economy visit www.centerforjobs.org/ca.
The data available this month still reflects the disruptions during the federal closures. Labor force data will not be published for October as the required survey was not done, and US Bureau of Labor Statistics (BLS) reports that the standard errors for the November labor force estimates are somewhat higher due to a number of factors related to the shutdown. The surveys used for the nonfarm job numbers, however, had a higher response rate due to the extended period employers had to complete their responses.
Highlights for policy makers:
- Nonfarm Jobs Rise 32,500 in November; Essentially Unchanged at a Dip of 7,500 Year-to-Date
- Changes in the Monthly Estimates
- California Unemployment Rate Highest Among the States
- Employment Recovery Progress
- Nonfarm Jobs
- Recovery Progress: CA Nonfarm Jobs vs. Other States
- Wages & Hours
Nonfarm Jobs Rise 32,500 in November; Essentially Unchanged at a Dip of 7,500 Year-to-Date
In the preliminary numbers, seasonally adjusted nonfarm jobs showed a preliminary gain of 32,500 in November but were essentially unchanged with a gain of only 1,500 in October. The September numbers were shifted lower from a loss of 4,500 to a loss of 6,200. Year-to-date, California nonfarm jobs were essentially stagnant at a loss of 7,500. This job picture extends the state’s period of no growth. Since January 2024, California has grown only 14,900 jobs, while the US as a whole has expanded by 2.5 million.
The November preliminary result was the highest among the states, with California followed by New York at 17,100 and Virginia at 8,600. In the year-to-date totals, California ranks 47th among the states and DC, which are led by Texas at 112,500, Pennsylvania at 77,500, and North Carolina at 75,600.
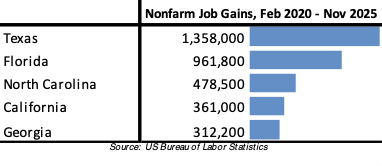
Looking at net total nonfarm job gains compared to pre-pandemic peaks, California remained in 4th place behind much smaller North Carolina.
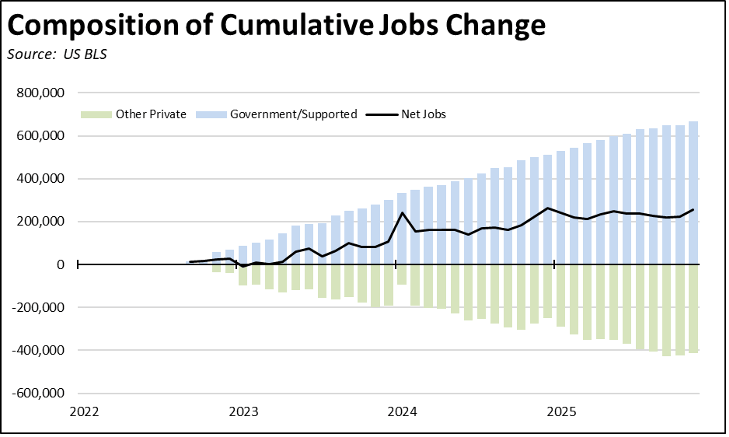
By industry, job gains again were dominated by jobs largely dependent on the public revenues generated by the state’s high tech industry, directly in government along with Health Care & Social Assistance largely driven by state spending on health care and social services. Combined, all other private industries finally showed a gain for the month, led by Accommodation & Food Services (6,200) and Transportation, Warehousing & Utilities (5,800). Over the year, government and government-supported jobs showed a gain of 167,000, largely offset by combined losses of 136,400 in rest of the private sector.
Since they peaked in September 2022, Other Private Industries as a group have shed 413,300 jobs. Government and government supported industries maintained by the recent surge in public spending in contrast grew by 668,500 jobs.
Changes in the Monthly Estimates
In response to the growing concerns over the quality of the monthly job and labor force data, we are now providing a tracking of the various revisions as they occur. As summarized in the following chart:
- Preliminary Estimate is the first round of estimates announced in the monthly reports from EDD and BLS. The job numbers are based on a survey of establishments, but the initial response rates have been dropping sharply especially since the pandemic. As a result, they have been criticized increasingly for their accuracy, which in the case of California as shown, has been significantly overestimated. All other Change columns are based on a comparison of the subsequent revisions to these first preliminary looks.
- Monthly Revision rreports the first adjustments to the numbers based on follow-up efforts that improve the overall survey response rates and that are reported for the prior month along with the preliminary monthly reports.
- Annual Revision is reported at the beginning of each year, with job models recalibrated (rebenched) primarily based on the March Quarterly Census of Employment & Wages (QCEW) count of actual wage and salary jobs, along with updates from various other data sources. In a reversal from previous years, the preliminary benchmark revision announced by BLS would increase the state’s March 2025 jobs by 20,700, but this number is not seasonally adjusted and will be affected by any changes to that calculation as well.
- Early Benchmark is a series maintained by the Philadelphia Federal Reserve Bank using the most recent QCEW data along with the overall method used by BLS to come up with an early look at likely revisions to the state numbers in the Annual Revision, including both the early benchmark estimated changes (shaded cells) and projections based on the more current monthly results. Using the just-released 2025 Q1 QCEW data, these estimates expect California’s 2024 numbers to be lowered by 175,100. This magnitude of a change would reduce the state’s total job gains in 2024 to only 75,600, or an anemic 6,300 per month.
Upcoming changes will affect these numbers further. Beginning in January 2026, BLS will change its birth-death model component in an effort to improve the accuracy of the monthly job estimates. For the labor force numbers, BLS will release their annual updates to the seasonally adjusted series as scheduled in January but will delay the companion population control adjustments (based on current population estimates for the US and states) normally scheduled for the following month.
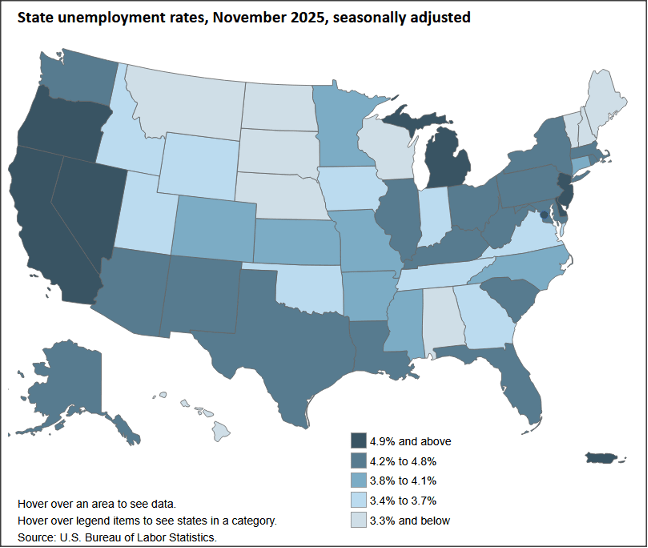
California Unemployment Rate Highest Among the States
Note that in the tables below, the seasonally adjusted numbers are compared to the September results rather than the prior month as usual, due to the absence of the October data.
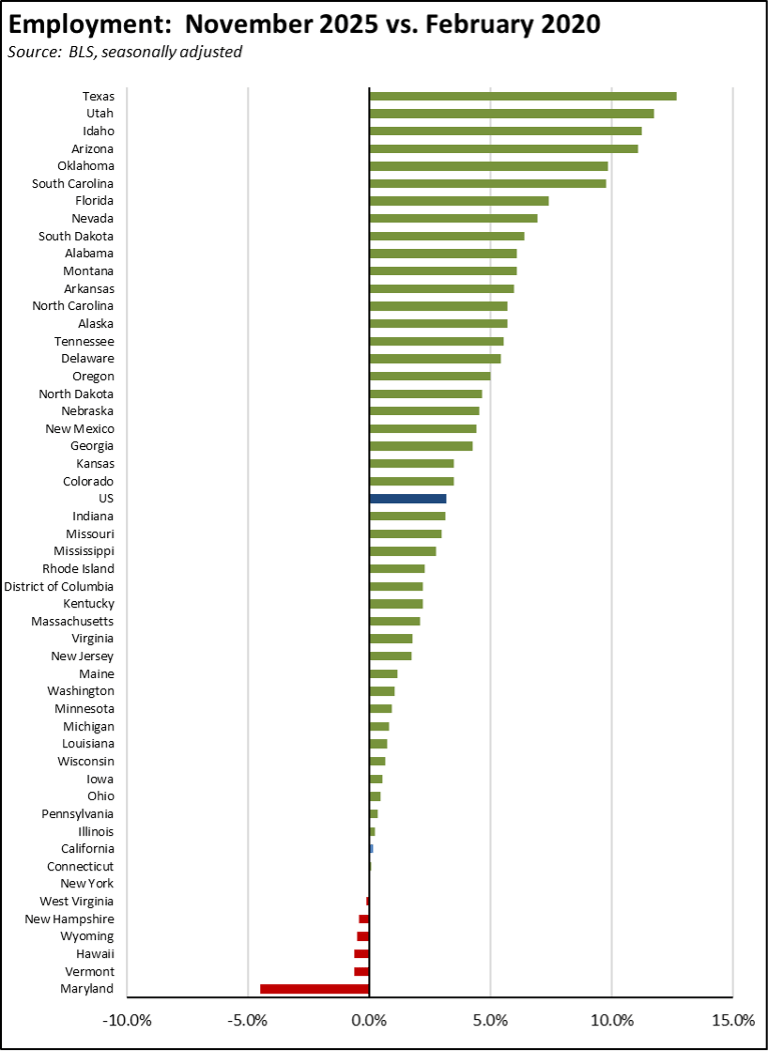
Employment Recovery Progress
Due to the weak labor force numbers, California edged back into recovery compared to its pre-pandemic employment levels. Adjusted by size, California’s performance was 43rd highest among the states and DC.
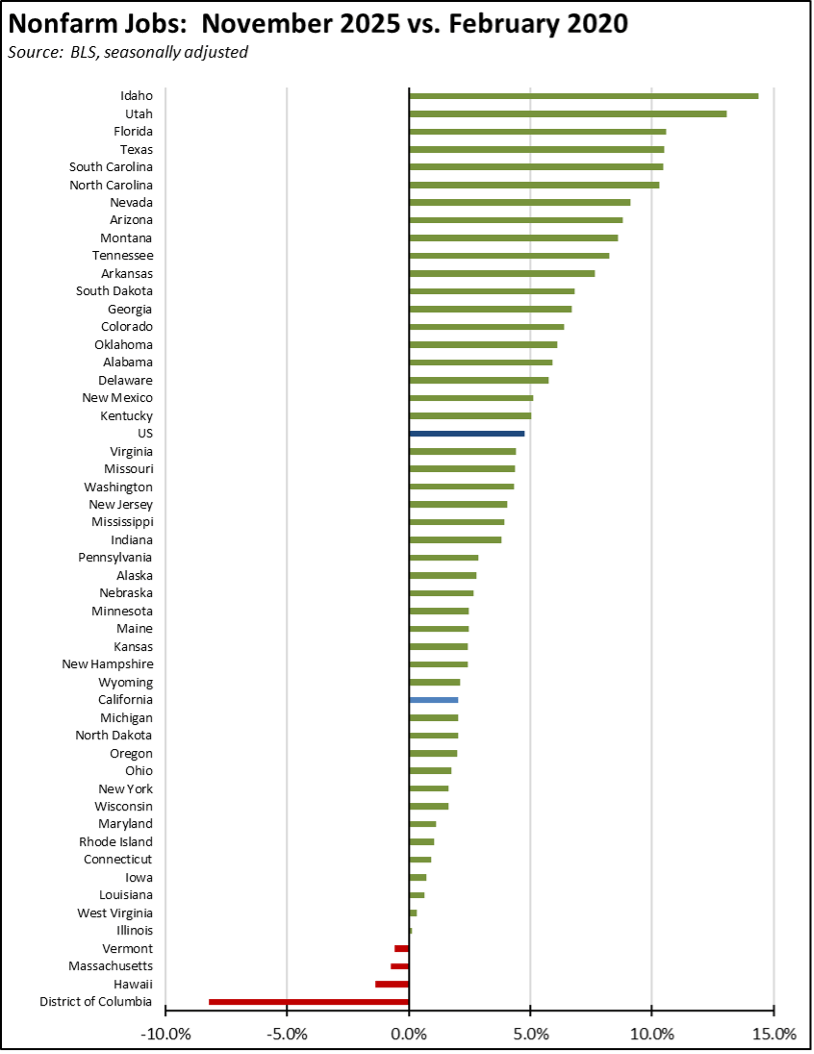
Nonfarm Jobs
Recovery Progress: CA Nonfarm Jobs vs. Other States
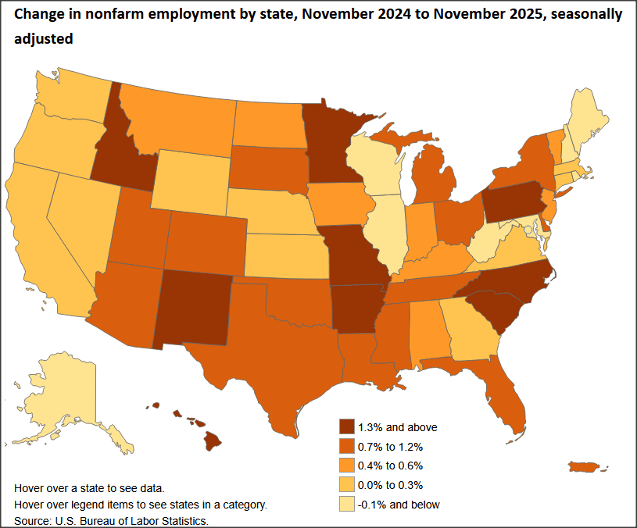
Interactive Original
https://www.bls.gov/charts/state-employment-and-unemployment/state-unemployment-rates-map.htm
Adjusted for size, California’s recovery level compared to the pre-pandemic peaks was the 34th highest, while only 3 states and DC have yet to show positive recovery.
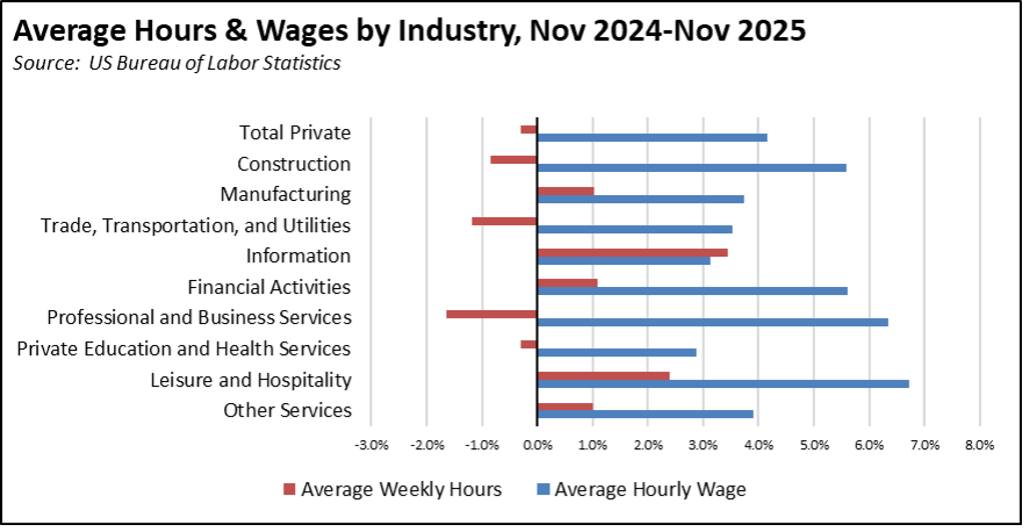
Wages & Hours