The Center for Jobs and the Economy has released our initial analysis of the September employment data. For additional information and data about the California economy visit www.centerforjobs.org/ca.
Highlights for policy makers:
- Nonfarm Jobs Fall 4,500
- Changes in the Monthly Estimates
- California Unemployment Rate Highest Among the States
- Employment Recovery Progress
- Nonfarm Jobs
- Recovery Progress: CA Nonfarm Jobs vs. Other States
- Wages & Hours
Nonfarm Jobs Fall 4,500
In the preliminary numbers, seasonally adjusted nonfarm jobs showed a small loss of 4,500, while the August numbers were changed to a loss of 10,300 from the preliminary gain of 3,800. Year-to-date, nonfarm jobs now show a loss of 39,800.
The September preliminary result was the 43rd highest among the states, with jobs led by Missouri with a gain of 18,300 followed by New Jersey with 10,900 and North Carolina at 10,200. In the year-to-date totals, California ranks the worst among the states and DC, which are led by Texas at 135,300, Pennsylvania at 72,100, and Ohio at 69,200.
Looking at net total nonfarm job gains compared to pre-pandemic peaks, California remained in 4th place behind much smaller North Carolina and with Georgia closing the spread. California now is ahead of Georgia by only 12,600 jobs.

By industry, job gains again relied on the public revenues generated by the state’s high tech industry, directly in government along with Health Care & Social Assistance largely driven by state spending on health care and social services. Combined, all other private industries showed a loss, although individual components showed a gain led by Arts, Entertainment & Recreation (2,800) and Accommodation & Food Services (2,800). Overall government and government-supported jobs showed a gain of 195,100 over the year, offset by combined losses of 133,300 in rest of the private sector.
Changes in the Monthly Estimates
In response to the growing concerns over the quality of the monthly job and labor force data, we are now providing a tracking of the various revisions as they occur. As summarized in the following chart:
- Preliminary Estimate is the first round of estimates announced in the monthly reports from EDD and BLS. The job numbers are based on a survey of establishments, but the initial response rates have been dropping sharply especially since the pandemic. As a result, they have been criticized increasingly for their accuracy, which in the case of California as shown, has been significantly overestimated. All other Change columns are based on a comparison of the subsequent revisions to these first preliminary looks.
- Monthly Revision reports the first adjustments to the numbers based on follow-up efforts that improve the overall survey response rates and that are reported for the prior month along with the preliminary monthly reports. As indicated, the revisions to the August numbers shifted the preliminary gains to a loss.
- Annual Revision is reported at the beginning of each year, with job models recalibrated (rebenched) primarily based on the March Quarterly Census of Employment & Wages (QCEW) count of actual wage and salary jobs, along with updates from various other data sources. In a reversal from previous years, the preliminary benchmark revision announced by BLS would increase the state’s March 2025 jobs by 20,700, but this number is not seasonally adjusted and will be affected by any changes to that calculation as well.
- Early Benchmark is a series maintained by the Philadelphia Federal Reserve Bank using the most recent QCEW data along with the overall method used by BLS to come up with an early look at likely revisions to the state numbers in the Annual Revision, including both the early benchmark estimated changes (shaded cells) and projections based on the more current monthly results. Using the just-released 2025 Q1 QCEW data, these estimates expect California’s 2024 numbers to be lowered by 175,100. This magnitude of a change would reduce the state’s total job gains in 2024 to only 75,600, or an anemic 6,300 per month.
California Unemployment Rate Highest Among the States
 Interactive Original
https://www.bls.gov/charts/state-employment-and-unemployment/state-unemployment-rates-map.htm
Employment has essentially shown no change over the past 5 months, with September experiencing a 6,500 loss (seasonally adjusted).
US employment rose by 251,000.
California unemployment rose by 11,300, while US unemployment rose by 219,000. California unemployment has been above 1 million for the past 21 months in a row, the highest levels since the pandemic period in 2021.
Employment Recovery Progress
Due to the weak labor force numbers, California again remained just shy of recovery to its pre-pandemic employment levels. Adjusted by size, California’s performance was 45th highest among the states and DC.

Nonfarm Jobs
Recovery Progress: CA Nonfarm Jobs vs. Other States
 Interactive Original
https://www.bls.gov/charts/state-employment-and-unemployment/state-unemployment-rates-map.htm
California’s monthly job performance in September was the 43rd highest among the states and DC. Adjusted for size, California’s recovery level compared to the pre-pandemic peaks was the 38th highest, while only 3 states and DC have yet to show positive recovery.

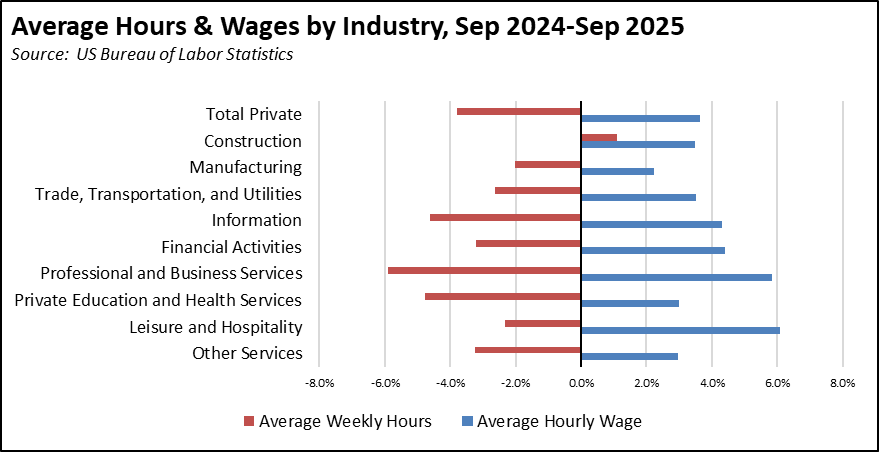
Wages & Hours