Highlights for policy makers:
- Unemployment Rate Declines to 7.0%; Total Employment Climbs 40,000
- Labor Force Participation Rate Stays Level but Remains at 1976 Levels
- One in Five Employed are in Part Time Work
- Nonfarm Jobs Increase 700
- Jobs Growth Adjusted for Population Near National Average
- 6 Industries Remain Below 2007 Pre-Recession Job Levels
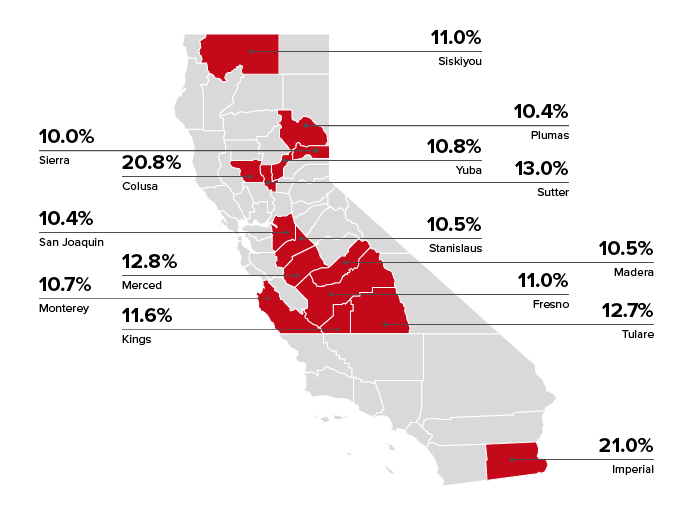
- 15 Counties Remain in Double-Digit Unemployment, Up from 12 in November
- Two-Tier Economy Persists
- Data Revisions and Updates
Unemployment Rate Declines to 7.0%; Total Employment Climbs 40,000
The Labor Force data for December 2014 (seasonally adjusted; California preliminary) is shown below, along with the change from the prior month:
The related not seasonally adjusted numbers (California preliminary), with the change from December 2013:
California Employment Development Department’s (EDD) latest release shows on a seasonally adjusted basis, total employment grew by 40,000, while the number of unemployed dropped by 28,500. California’s seasonally adjusted unemployment rate declined from 7.2% in November to 7.0% in December. The unadjusted rate decreased from 7.1% in November 2014 to 6.7% in December 2014.
By comparison, total US employment increased by 0.1% (seasonally adjusted increase of 111,000), while the number of unemployed dropped even more by 4.2% (seasonally adjusted decrease of 383,000)
California’s seasonally adjusted unemployment rate improved slightly, remaining at a level 25% higher than the national rate. California had the 3rd highest unemployment rate among the states, below District of Columbia (7.3%) and Mississippi (7.2%).
Between December 2013 and December 2014, Bureau of Labor Statistics (BLS) data shows the total number of employed in California increased by 435,969 (not seasonally adjusted). This increase was the highest among the states, ahead of Texas (325,098) and Florida (219,414). Adjusted for population size, California had the 18th highest employment increase rate (1447 additional employed per 100,000 Civilian Noninstitutional Population (Age 16+)), with Colorado (2745 per 100,000 population), North Dakota (2636 per 100,000 population), and Connecticut (2544 per 100,000 population) in the leading slots.
Labor Force Participation Rate Stays Level but Remains at 1976 Levels
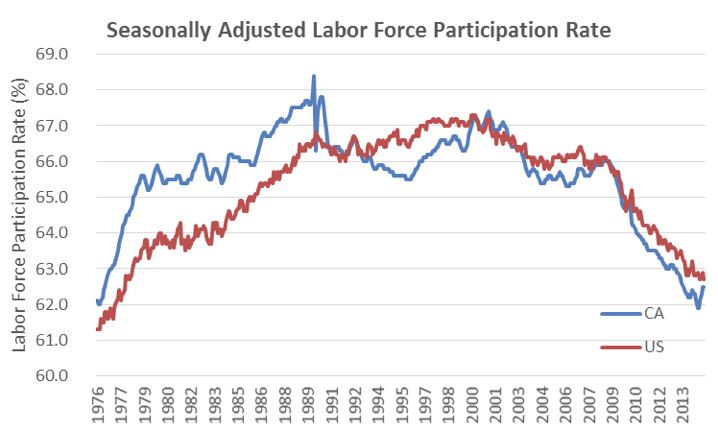
The state’s seasonally adjusted labor force participation rate stayed level at 62.5%, but still remains at levels last seen in 1976.
One in Five Employed are in Part Time Work
The percentage of part time in December increased slightly to 20.3% of total employment, with a slight decline to 6.9 % working part time for economic reasons (primarily the lack of full time jobs).
Nonfarm Jobs Increase 700
EDD reported that between November and December 2014, seasonally adjusted nonfarm payroll jobs essentially remained level, increasing by only 700. Not seasonally adjusted, nonfarm payroll jobs decreased by 2,700.
Looking at the not seasonally adjusted numbers, the change in nonfarm payroll jobs from November 2014 saw the largest increases in Retail Trade (18,800) as the holiday shopping season continued, Health Care & Social Services (12,700), Professional, Scientific & Technical Services (5,800), and Arts, Entertainment & Recreation (5,000). Biggest declines were in Construction (-21,500), Government (-14,000), and Educational Services (-8,100).
Jobs Growth Adjusted for Population Near National Average
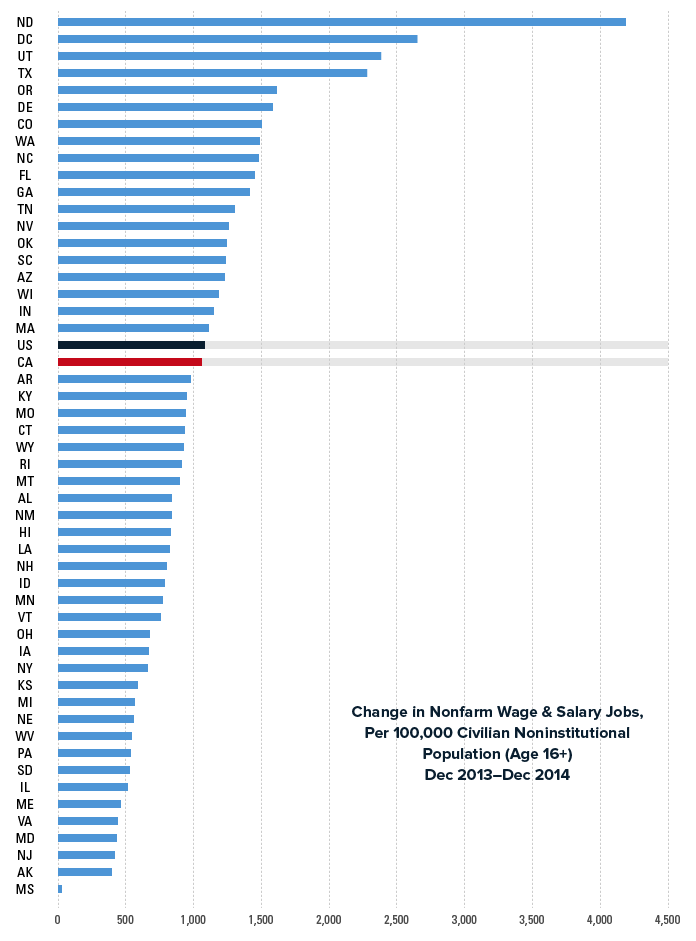
From December 2013 to December 2014, California had the 2nd highest increase in seasonally adjusted Nonfarm Wage &Salary Jobs, at 320,300 jobs or 12.0% of the US total. Texas had the highest, with 457,900 Nonfarm jobs or 17.1% of the US total.
Adjusted for population, however, California’s private job creation rate is just below the US average. A significant factor in California’s recent job growth is its sheer size. As the largest state (45% larger than the second largest state, Texas), California will normally be near the top in terms of total jobs created during any national recovery period. Adjusting for the labor force population base gives a better view of the state’s overall performance relative to the nation and other states.
The following chart shows Nonfarm jobs created per 100,000 Civilian Noninstitutional Population age 16 and over (the available labor force population base). Accounting for population size, California’s Nonfarm job performance for the 12 months was the 20th highest.
California has regained its total pre-recession job levels, but its continued performance near the national average job creation rate means the state has yet to match job creation with the population growth (about 5% according to Department of Finance data) that has occurred since the recession.
6 Industries Remain Below 2007 Pre-Recession Job Levels
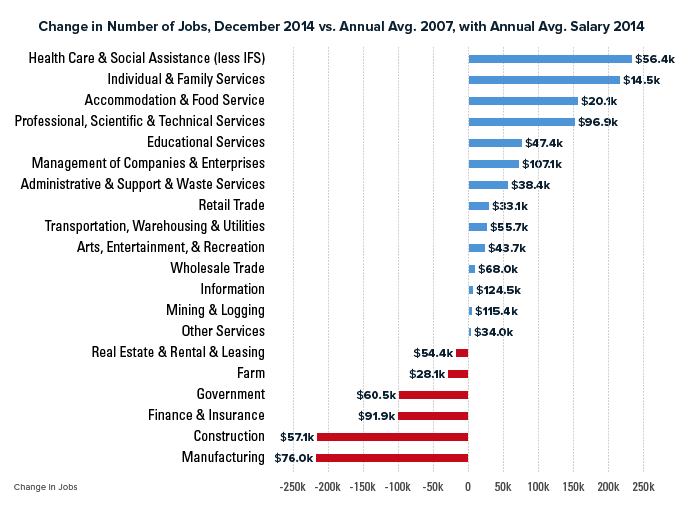
Comparing the number of jobs by industry in December 2014 (not seasonally adjusted), 6 industries remain below the 2007 pre-recession levels and the remaining are above. Looking at seasonally adjusted numbers, 6 industries (Retail Trade replaces Farm in this category) also remain below the 2007 pre-recession levels.
As indicated in the figure above, growth has been primarily in the lower wage and higher wage industries. Significant job growth in industries paying above $1,000 a week average wage has been limited to Professional, Scientific & Technical Services, Health Care Services, and Management of Companies & Enterprises. All other industries in this wage category remain near or significantly below the 2007 average employment levels.
15 Counties Remain in Double-Digit Unemployment, Up from 12 in November
Two-Tier Economy Persists
Unemployment rates and employment (all data is not seasonally adjusted) continue to vary widely across the state, with the spread between the unemployment rates by region increasing to 2.47.
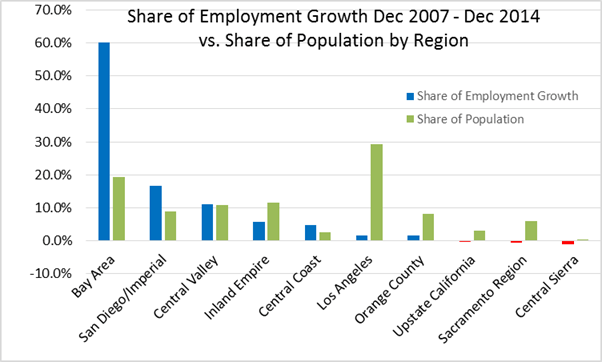
Net employment growth for the state as a whole is now positive, with a total increase of 468,500 between December 2007 and December 2014. However, this net growth has been heavily concentrated within the coastal regions, with the Bay Area alone accounting for 60% of the total.
By County:
Ratio of Highest to Lowest Rate: 6.18
By Legislative District:
Ratio of Highest to Lowest Rate: Senate 3.89
Ratio of Highest to Lowest Rate: Assembly 4.14
Data Revisions and Updates
Several of the data series in the Center’s Data Tool and Indicators are currently being updated and revised as a result of new population numbers released by Department of Finance and the 2009-2013 American Community Survey (ACS). These revisions cover a number of the data elements and in some cases extend back to 2009. Additional revisions will be made following the revised data releases from EDD scheduled to be completed by April.
Note that some of the estimated data series currently have points of discontinuity as a result of applying the new ACS factors. Data smoothing techniques will be applied later as appropriate following the final EDD releases.
