Highlights for policy makers:
- Unemployment Rate Eases to 5.2%; Total Employment Down 39,000
- Labor Force Participation Rate Level Down to 62.5%
- State Employment Growth Rankings
- Nonfarm Jobs Increase 3,700
- Five Industries Remain Below 2007 Pre-Recession Job Levels
- Two-Tier Economy Persists
- Eight California MSAs in the 10 Worst Unemployment Rates Nationally
- Legislative District Jobs Data Updated
Unemployment Rate Eases to 5.2%; Total Employment Down 39,000
The Labor Force data for December 2016 (seasonally adjusted; California preliminary) is shown below, along with the change from the prior month:
| Seasonally Adjusted | California | US | ||
|---|---|---|---|---|
| Dec 2016 | Change from Nov 2016 | Dec 2016 | Change from Nov 2016 | |
| Unemployment Rate | 5.2 | -0.1 | 4.7 | 0.1 |
| Labor Force | 19,386,000 | -0.3% | 159,640,000 | 0.1% |
| Participation Rate | 62.5 | -0.3 | 62.7 | 0.1 |
| Employment | 18,377,000 | -0.2% | 152,111,000 | 0.0% |
| Unemployment | 1,009,000 | -2.8% | 7,529,000 | 1.6% |
The related not seasonally adjusted numbers (California preliminary), with the change from December 2015:
| Not Seasonally Adjusted | California | US | ||
|---|---|---|---|---|
| Dec 2016 | Change from Dec 2015 | Dec 2016 | Change from Dec 2015 | |
| Unemployment Rate | 5.0 | -0.7 | 4.5 | -0.3 |
| Labor Force | 19,192,800 | 1.0% | 158,968,000 | 1.1% |
| Participation Rate | 61.9 | 0.0 | 62.4 | 0.0 |
| Employment | 18,228,600 | 1.8% | 151,798,000 | 1.4% |
| Unemployment | 964,200 | -11.4% | 7,170,000 | -4.9% |
California Employment Development Department’s (EDD) latest release shows on a seasonally adjusted basis, total employment dropped 39,000 from November, while the number of unemployed declined by 29,000. Most of the movement in the unemployment rate came as the labor force went down by 68,000.
California’s seasonally adjusted unemployment rate continued easing to 5.2%. California tied with Washington for the 11th highest unemployment rate among the states. The unadjusted rate dropped from 5.7% in December 2015 to 5.0%.
Total US employment saw a seasonally adjusted increase of 63,000 from November, while the number of unemployed increased by 120,000. The national unemployment rate rose 0.1 points to 4.7%.
Labor Force Participation Rate Level Down to 62.5%
California’s participation rate (seasonally adjusted) dropped to 62.5% in December, while the US rate rose marginally by 0.1 point to 62.7%. The California participation rate still remains near the previous lows from 1976, and well below the average pre-recession level of 65.6% in 2007.
State Employment Growth Rankings
| Rank | Number of Employed | Percentage Change | Population Adjusted (employment growth per 1,000 civilian noninstitutional population) |
|---|---|---|---|
| 1 | CA 499,000 | OR 4.9% | OR 28.6 |
| 2 | TX 278,800 | TN 4.8% | ND 28.5 |
| 3 | FL 225,300 | GA 4.4% | TN 26.9 |
| 4 | GA 199,400 | KY 4.3% | GA 25.5 |
| 5 | NC 154,400 | AZ 4.2% | CO 24.5 |
| 6 | TN 139,600 | ND 4.2% | WA 24.1 |
| 7 | WA 136,700 | WA 4.1% | UT 24.1 |
| 8 | AZ 125,000 | CO 3.8% | AZ 23.5 |
| 9 | MI 115,000 | UT 3.7% | KY 22.9 |
| 10 | MA 112,900 | NC 3.4% | MA 20.4 |
| 11 | CO 104,700 | MA 3.3% | NC 19.7 |
| 12 | OR 92,800 | SC 3.3% | HI 19.2 |
| 13 | KY 79,000 | ME 3.2% | ME 19.0 |
| 14 | SC 69,900 | HI 3.2% | SC 18.2 |
| 15 | IN 64,500 | CA 2.8% | DC 17.4 |
| 16 | MD 63,000 | AL 2.8% | CA 16.3 |
| 17 | AL 55,400 | DC 2.7% | MI 14.6 |
| 18 | UT 52,300 | MI 2.5% | AL 14.5 |
| 19 | IL 45,000 | FL 2.4% | NH 14.4 |
| 20 | WI 42,400 | TX 2.2% | FL 13.7 |
| 21 | VA 36,000 | NH 2.2% | TX 13.5 |
| 22 | CT 31,600 | MD 2.1% | MD 13.3 |
| 23 | HI 21,100 | IN 2.1% | IN 12.5 |
| 24 | ME 20,800 | CT 1.8% | CT 11.0 |
| 25 | NV 18,500 | NM 1.6% | WI 9.3 |
| US 2,081,000 | US 1.4% | US 8.2 |
Between December 2015 and December 2016, Bureau of Labor Statistics (BLS) data shows the total number of employed in California increased by 499,000 (seasonally adjusted), or 24.0% of the total net employment gains in this period for the US (17.0% of the total for those states showing positive employment gains in this period). Measured by percentage change in employment over the year, California dropped to 15th highest. Adjusted for population, California dropped to 16th.
Nonfarm Jobs Increase 3,700
EDD reported that between November and December 2016, seasonally adjusted nonfarm wage and salary jobs grew 3,700 in December. November’s gains were revised down slightly to 12,900 from the previously reported gain of 13,600.
Looking at the not seasonally adjusted numbers, hiring saw increases in all but three industries over the year. The change in total payroll jobs from December 2015 saw the largest increases in Government (63,500), Health Care & Social Assistance (54,700), and Professional, Scientific & Technical Services (46,500). Declines were in Manufacturing (-7,300), Mining & Logging (-2,200), and Administrative & Support & Waste Management Services (-1,600).
| Not Seasonally Adjusted Payroll Jobs | Nov 2016 | Dec 2016 | Change Dec 2016 – Nov 2016 | Change Dec 2016 – Dec 2015 |
|---|---|---|---|---|
| Total Farm | 401,100 | 356,300 | -44,800 | 2,100 |
| Mining & Logging | 25,000 | 24,500 | -500 | -2,800 |
| Construction | 783,900 | 762,300 | -21,600 | 18,700 |
| Manufacturing | 1,277,300 | 1,277,000 | -300 | -7,300 |
| Wholesale Trade | 741,200 | 747,700 | 6,500 | 16,100 |
| Retail Trade | 1,769,700 | 1,785,600 | 15,900 | 24,800 |
| Transportation, Warehousing & Utilities | 586,100 | 593,900 | 7,800 | 16,100 |
| Information | 503,800 | 497,900 | -5,900 | 7,100 |
| Finance & Insurance | 532,400 | 536,400 | 4,000 | 5,400 |
| Real Estate & Rental & Leasing | 282,600 | 285,100 | 2,500 | 9,300 |
| Professional, Scientific & Technical Services | 1,273,100 | 1,277,700 | 4,600 | 46,500 |
| Management of Companies & Enterprises | 234,400 | 235,300 | 900 | 3,300 |
| Administrative & Support & Waste Services | 1,110,900 | 1,099,500 | -11,400 | -1,600 |
| Educational Services | 387,300 | 386,200 | -1,100 | 24,300 |
| Health Care & Social Assistance | 2,212,000 | 2,214,100 | 2,100 | 54,700 |
| Individual & Family Services | 598,700 | 601,900 | 3,200 | 12,700 |
| Arts, Entertainment, & Recreation | 303,000 | 308,100 | 5,100 | 12,400 |
| Accommodation & Food Service | 1,600,400 | 1,605,300 | 4,900 | 44,900 |
| Other Services | 557,300 | 552,200 | -5,100 | 6,800 |
| Government | 2,574,200 | 2,561,200 | -13,000 | 63,500 |
| Total Nonfarm | 16,754,600 | 16,750,000 | -4,600 | 342,200 |
| Total Wage & Salary | 17,155,700 | 17,106,300 | -49,400 | 344,300 |
By total number of new jobs, California had the highest increase in seasonally adjusted nonfarm jobs among the states from December 2015 to December 2016, at 332,500 or 15.4% of the US net increase. By percentage growth in jobs, California dropped to 11th highest, and by population adjusted jobs growth, rose to 13th highest.
| Rank | Number of Jobs | Employment Growth (%) | Population Adjusted (job growth per 1,000 civilian noninstitutional population) |
|---|---|---|---|
| 1 | CA 332,500 | OR 3.3% | DC 30.8 |
| 2 | FL 251,400 | FL 3.1% | OR 18.0 |
| 3 | TX 210,200 | WA 3.0% | UT 17.6 |
| 4 | NY 114,700 | NV 3.0% | WA 16.9 |
| 5 | GA 103,300 | UT 2.8% | NV 16.5 |
| 6 | WA 97,400 | GA 2.4% | FL 15.0 |
| 7 | NC 85,200 | MO 2.3% | MA 13.5 |
| 8 | MA 75,000 | DC 2.3% | MO 13.5 |
| 9 | MI 75,000 | MA 2.1% | GA 13.0 |
| 10 | MO 64,500 | HI 2.1% | HI 11.9 |
| 11 | OR 59,400 | CA 2.0% | CO 11.2 |
| 12 | VA 49,600 | NC 2.0% | NC 10.7 |
| 13 | CO 48,800 | ID 1.9% | CA 10.7 |
| 14 | TN 48,300 | CO 1.9% | NH 10.5 |
| 15 | MN 43,600 | TX 1.8% | ID 10.4 |
| 16 | OH 41,800 | MI 1.7% | MN 10.1 |
| 17 | UT 39,000 | NH 1.7% | TX 9.9 |
| 18 | NV 38,300 | SC 1.7% | MI 9.5 |
| 19 | AZ 35,400 | TN 1.6% | SD 9.3 |
| 20 | SC 34,900 | MN 1.5% | TN 9.2 |
| US 2,157,000 | US 1.5% | US 8.5 |
Five Industries Remain Below 2007 Pre-Recession Job Levels
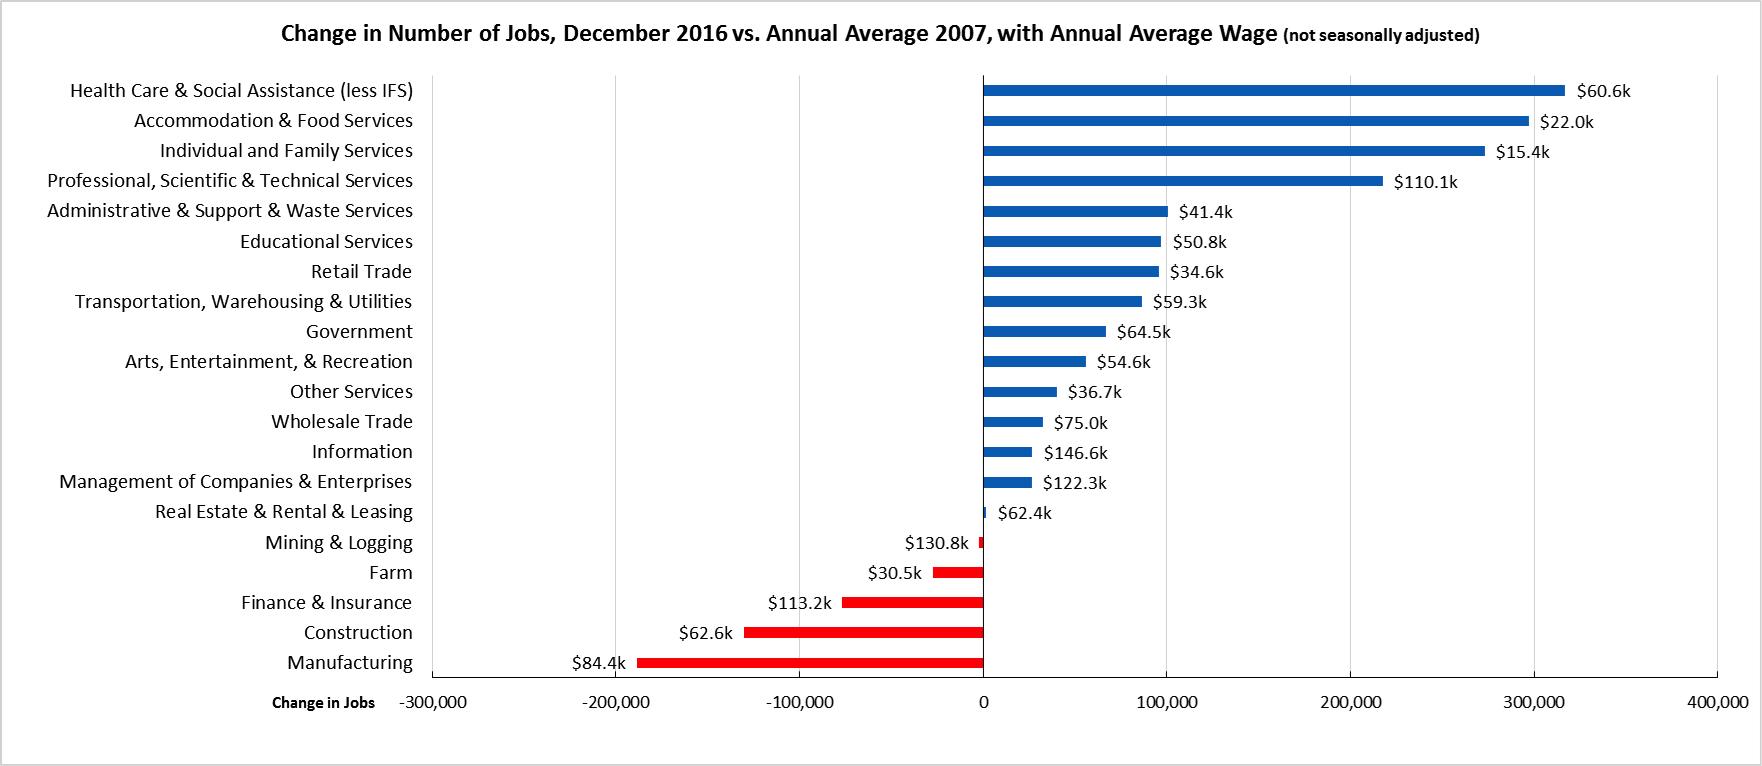
Comparing the number of jobs by industry in December 2016 (not seasonally adjusted), 5 industries had employment below the 2007 pre-recession levels. In the highest gain industries, Health Care & Social Assistance (less IFS) remained the leading industry, followed by the two lowest wage industries (Accommodation & Food Services and Individual & Family Services) and higher wage Professional, Scientific & Technical Services. Of the lagging industries, three—Manufacturing, Mining & Logging, and Construction—are blue collar middle class wage industries, while the higher wage Finance & Insurance also continued to lose ground.
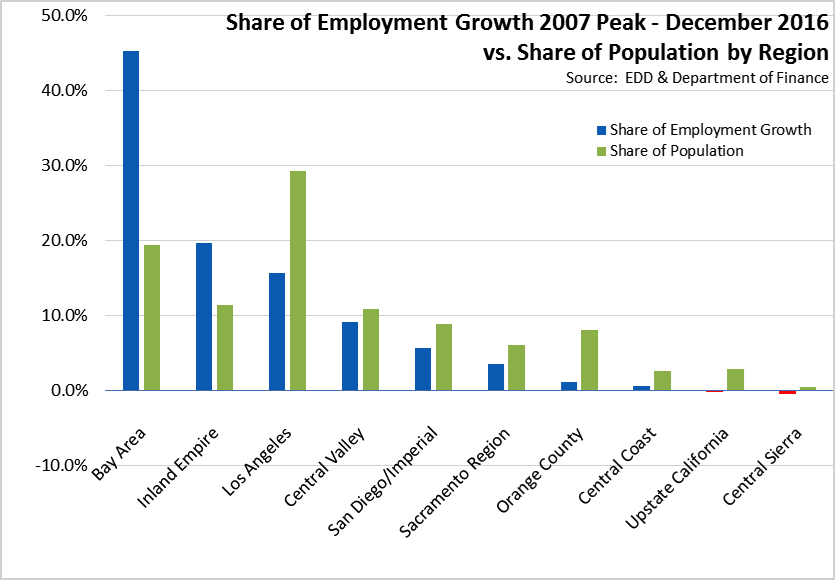
Two-Tier Economy Persists
Unemployment rates (all data is not seasonally adjusted) continue to vary widely across the state, ranging from 3.5% in the Bay Area to nearly three times as large at 9.5% in the Central Valley.
| Not Seasonally Adjusted | Unemployment Rate (%) December 2016 |
|---|---|
| California | 5.0 |
| Bay Area | 3.5 |
| Orange County | 3.5 |
| Los Angeles | 4.8 |
| San Diego/Imperial | 4.8 |
| Sacramento Region | 4.8 |
| Inland Empire | 5.2 |
| Central Sierra | 5.6 |
| Upstate California | 7.2 |
| Central Coast | 7.4 |
| Central Valley | 9.5 |
Containing just under 20% of the state’s population, the Bay Area was responsible for 45.2% of the net growth in employment since the pre-recession peak in 2007. Los Angeles Region, remaining in third place behind Inland Empire, has only 15.6% of net employment gains and just under 30% of the total population.
By Legislative District:
| Lowest 10 Unemployment Rates | |||||
|---|---|---|---|---|---|
| CD12 (Pelosi-D) | 2.8 | SD13 (Hill-D) | 2.6 | AD16 (Baker-R) | 2.5 |
| CD45 (Walters-R) | 2.8 | SD11 (Wiener-D) | 3.0 | AD22 (Mullin-D) | 2.5 |
| CD18 (Eshoo-D) | 2.9 | SD37 (Moorlach-R) | 3.0 | AD24 (Berman-D) | 2.7 |
| CD52 (Peters-D) | 3.0 | SD39 (Atkins-D) | 3.3 | AD28 (Low-D) | 2.8 |
| CD14 (Speier-D) | 3.0 | SD36 (Bates-R) | 3.3 | AD74 (Harper-R) | 3.0 |
| CD17 (Khanna-D) | 3.1 | SD26 (Allen-D) | 3.5 | AD17 (Chiu-D) | 3.0 |
| CD33 (Lieu-D) | 3.3 | SD15 (Beall-D) | 3.5 | AD77 (Maienschein-R) | 3.0 |
| CD48 (Rohrabacher-R) | 3.4 | SD07 (Glazer-D) | 3.6 | AD73 (Brough-R) | 3.0 |
| CD49 (Issa-R) | 3.5 | SD10 (Wieckowski-D) | 3.6 | AD19 (Ting-D) | 3.0 |
| CD39 (Royce-R) | 3.5 | SD29 (Newman-D) | 3.8 | AD68 (Choi-R) | 3.1 |
| Highest 10 Unemployment Rates | |||||
|---|---|---|---|---|---|
| CD44 (Barragán-D) | 6.5 | SD33 (Lara-D) | 5.5 | AD03 (Gallagher-R) | 8.0 |
| CD03 (Garamendi-D) | 6.7 | SD35 (Bradford-D) | 5.7 | AD34 (Fong-R) | 8.1 |
| CD09 (McNerney-D) | 7.3 | SD17 (Monning-D) | 5.9 | AD30 (Caballero-D) | 8.1 |
| CD10 (Denham-R) | 7.8 | SD04 (Nielsen-R) | 6.5 | AD23 (Patterson-R) | 8.5 |
| CD23 (McCarthy-R) | 8.6 | SD05 (Galgiani-D) | 7.8 | AD13 (Eggman-D) | 8.6 |
| CD20 (Panetta-D) | 8.7 | SD08 (Berryhill-R) | 7.9 | AD21 (Gray-D) | 10.5 |
| CD22 (Nunes-R) | 9.3 | SD40 (Hueso-D) | 8.1 | AD31 (Arambula-D) | 10.8 |
| CD51 (Vargas-D) | 9.6 | SD16 (Fuller-R) | 8.5 | AD56 (Garcia-D) | 10.9 |
| CD16 (Costa-D) | 10.8 | SD12 (Cannella-R) | 9.9 | AD26 (Mathis-R) | 11.2 |
| CD21 (Valadao-R) | 11.4 | SD14 (Vidak-R) | 12.3 | AD32 (Salas-D) | 11.9 |
Eight California MSAs in the 10 Worst Unemployment Rates Nationally
Of the 10 Metropolitan Statistical Areas (MSAs) with the worst unemployment rates nationally, 8 are in California. Of the 20 worst, 10 are in California.
| US Rank | MSA | November 2016 Unemployment Rate |
|---|---|---|
| 378 | Yuba City, CA Metropolitan Statistical Area | 8.8 |
| 379 | Madera, CA Metropolitan Statistical Area | 9.0 |
| 380 | Bakersfield, CA Metropolitan Statistical Area | 9.2 |
| 381 | Fresno, CA Metropolitan Statistical Area | 9.3 |
| 381 | Hanford-Corcoran, CA Metropolitan Statistical Area | 9.3 |
| 383 | Merced, CA Metropolitan Statistical Area | 9.5 |
| 384 | Ocean City, NJ Metropolitan Statistical Area | 10.5 |
| 385 | Visalia-Porterville, CA Metropolitan Statistical Area | 10.8 |
| 386 | Yuma, AZ Metropolitan Statistical Area | 16.7 |
| 387 | El Centro, CA Metropolitan Statistical Area | 20.3 |
Legislative District Jobs Data Updated
In his recently released Budget Proposal, the Governor highlighted the current pattern of jobs growth as one of the key factors behind the projected slowing revenues:
Much of the employment growth since the budget signing has come from workers newly entering or reentering the labor force. Combined with the recent increases in the minimum wage, this means a greater share of wages is now going to lower‑income workers. For example, over the last four years, the percentage of wage and salary growth from high‑wage sectors dropped from 50 percent to 36 percent of total growth. From an income distribution standpoint, this is a positive development. From a revenue standpoint, however, this is negative due to California’s progressive tax structure.
Analysis of the updated jobs data shows how this two-tier wage trend is playing out on the district level. Two comparisons are shown in the following tables: (1) the shorter term annual job change from 2015:Q1 to 2016:Q1 and (2) the longer term shift in the local jobs structure that has occurred, comparing the pre-recession levels in 2007:Q1 to 2016:Q1.
Looking at the annual changes between 2015:Q1 to 2016:Q1:
- Most Senate Districts had positive growth in the number of private jobs; 3 districts saw reductions. Sixty-four Assembly Districts had private job growth, while the other 16 saw losses.
- Growth, however, was highly concentrated. The top 5 Senate Districts contained 40% of the total jobs growth; the top two—SD 13 and SD 11—alone had 21%. The top 5 Assembly Districts contained 35% of total jobs growth; the top 2—AD 43 and AD 17—had 17%.
- Over the year, the total number of private establishments declined by 1,235. Only 14 Senate Districts and 34 Assembly Districts saw gains.
The longer term trends showing the structural changes from just prior to the recession fully illustrate the shift identified in the Governor’s Proposed Budget:
- Even with the gains over the past year, middle class blue collar jobs remained over 300,000 below the pre-recession level. Including the Social Assistance component of Healthcare, the lower wage industries paying near or at minimum wage accounted for nearly two-thirds of net jobs growth.
- Most Senate Districts saw new job growth, while 6 districts still had yet to recover. For the Assembly Districts, 65 saw growth and 15 remained below recovery.
- The top 5 Senate Districts contained 47% of net private jobs growth, while the top 2—SD 11 and SD 13—contained 30%. The top 5 Assembly Districts held 40% of net private jobs growth, while the top 2—AD 17 and AD 24—had 24%.
- The top 2 Senate Districts—SD 11 and SD 13—posted a net increase of 132,000 higher wage jobs, while the remaining 38 districts showed a net loss of 114,000. In the Assembly, the top 2 districts—AD 17 and AD 24—contained a net increase of 113,000 higher wage jobs, while the other 78 districts had a loss of 94,000.
As always, additional district data, including the Congressional District data, is available in the Employment Data Tool section of the Center’s web site.
View Updated Legislative District Jobs Data
Note: All data sources, methodologies, and historical data series available at CenterforJobs.org.