Download December 2018 Jobs Report
Highlights for policy makers:
- Unemployment Rises to 4.2%; Employment Up 68,700
- Labor Force Participation Rate Rises to 62.5%
- Employment Growth Ranking—California Stays in 2nd
- Nonfarm Jobs Up 24,500 for Month; California Remains Ranked #2 for 12-month Gain
- Jobs Change by Industry
- Structural Shifts in State’s Economy
- Unemployment Rates by Region
- Employment Growth by Region
- Unemployment Rates by Legislative District
- 10 MSAs with the Worst Unemployment Rates
- Chart of the Month: State Budget Reliance on Bay Area Revenues
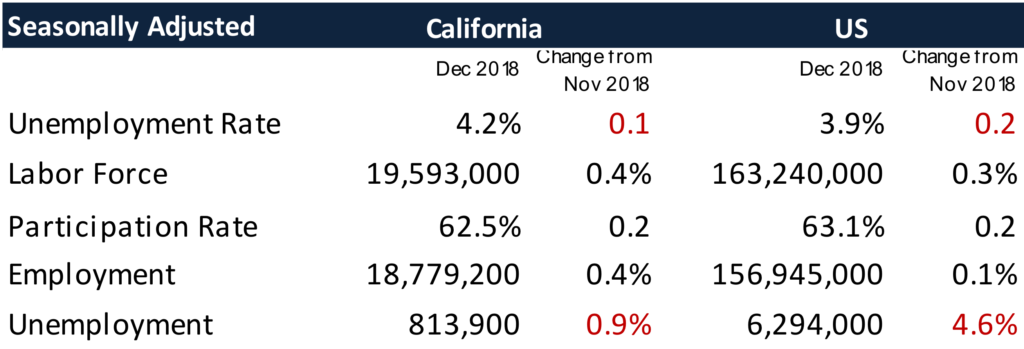
Unemployment Rises to 4.2%; Employment Up 68,700
The Labor Force data for December 2018 (seasonally adjusted; California preliminary) is shown below, along with the change from the prior month:
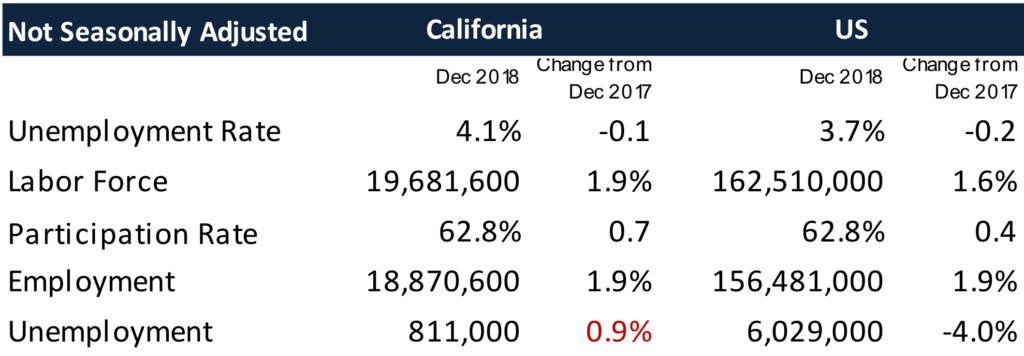
The related not seasonally adjusted numbers (California preliminary), with the change from December 2017:
Source: California Employment Development Department; US Bureau of Labor Statistics
EDD’s latest data shows total employment (seasonally adjusted; December preliminary) was up 68,700 from November, while the number of unemployed rose 7,200. Unemployment rate rose to 4.2% primarily as a result of some growth finally taking hold in the labor force. The unadjusted rate dipped 0.1 point from the year earlier to 4.1%.
California tied with Pennsylvania for the 13th highest unemployment rate.
Total US employment saw a seasonally adjusted gain of 142,000, with the number of unemployed rising 276,000. Similar expansion in the national labor force also saw the unemployment rate rising, to 3.9%.
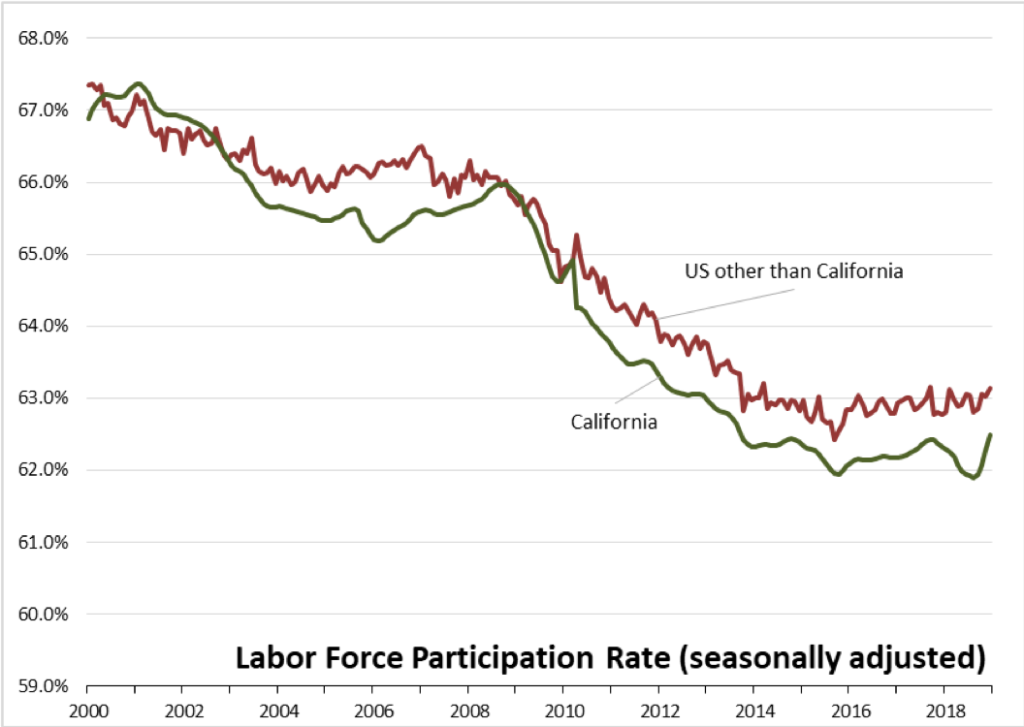
Labor Force Participation Rate Rises to 62.5%
Source: California Employment Development Department; US Bureau of Labor Statistics
California’s seasonally adjusted labor force participation rate rose to 62.5%, continuing a 3-month long improvement as additional workers reentered the workforce. Nationally, the participation rate showed a comparable rise. The state continues to experience lower than average participation rates in spite of having a relatively younger population than the rest of the US.
The state’s labor force is finally beginning to show some sustained expansion, with an increase of 206,600 (1.1%) over the 12 months ending December 2018. The rest of the US, however, had a greater draw, with the national labor force growing 2,604,000 (1.6%) in this same period.
California’s continued low rate has implications for future growth in the state, including the ability to sustain jobs expansion as fewer workers are available and continued effects on state and local budgets for higher social program spending compared to other states.
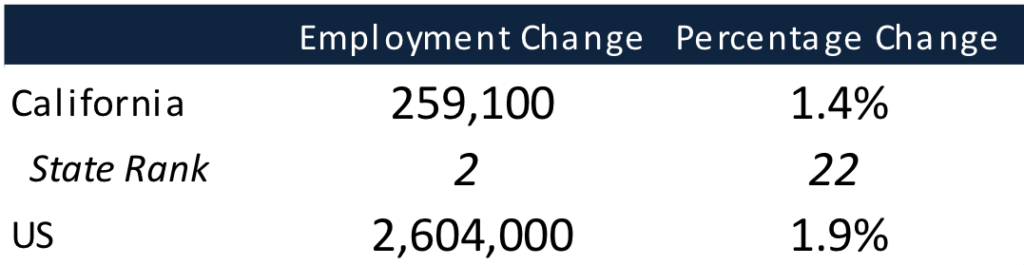
Employment Growth Ranking—California Stays in 2nd
Source: California Employment Development Department; US Bureau of Labor Statistics
Over the 12 months ending in December, the total number of persons employed (seasonally adjusted) grew by 259,100. California remained in 2nd place behind Texas, which saw an additional 334,000 persons employed over this period.
Based on percentage growth, California had a 1.4% expansion in employment, below the US average of 1.9%. Ranked among the states, California rose to 22nd place from 28th in November.
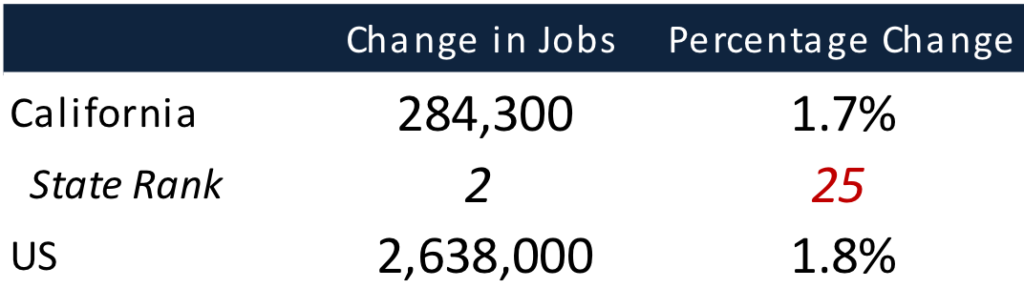
Nonfarm Jobs Up 24,500 for Month; California Remains Ranked #2 for 12-month Gain
Source: California Employment Development Department; US Bureau of Labor Statistics
Nonfarm jobs (seasonally adjusted) were up 24,500 from November. November’s gains were revised to 25,700 from the previously reported 30,700.
For the 12 months ending December, total jobs growth was 284,300, keeping the state in 2nd place behind Texas which gained 391,800 jobs in this period.
On a percentage basis, California dropped to 25th among the states, with a 12-month jobs growth rate of 1.7% vs. the US average of 1.8%.
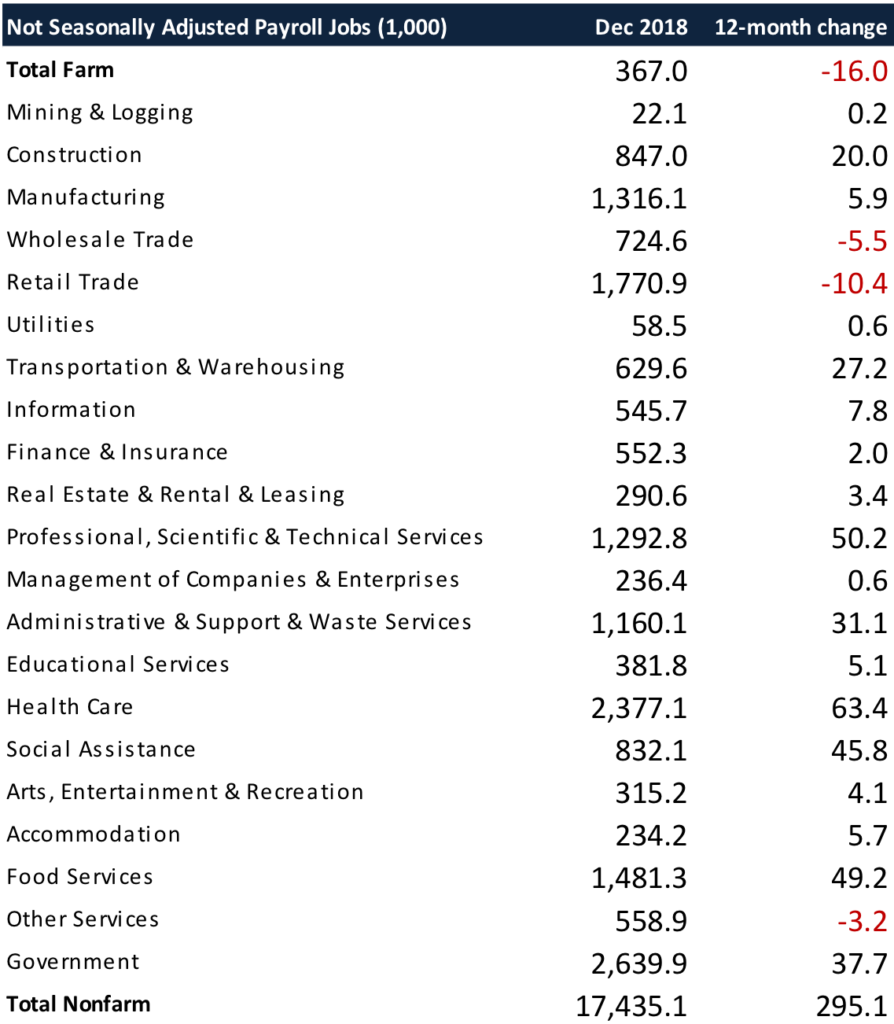
Jobs Change by Industry
Source: California Employment Development Department
In the unadjusted numbers that allow a more detailed look at industry shifts, hiring saw increases in all but 4 industries over the year.
Gains in payroll jobs were led by Health Care ($67.3k average annual wages), Professional, Scientific & Technical Services ($120.4k), and Food Services ($22.5k).
Declines were led by Farm ($33.9k), Retail Trade ($36.0k), and Wholesale Trade ($78.7k).
All wage data is from the most current 4-quarter average from the Quarterly Census of Employment & Wages.
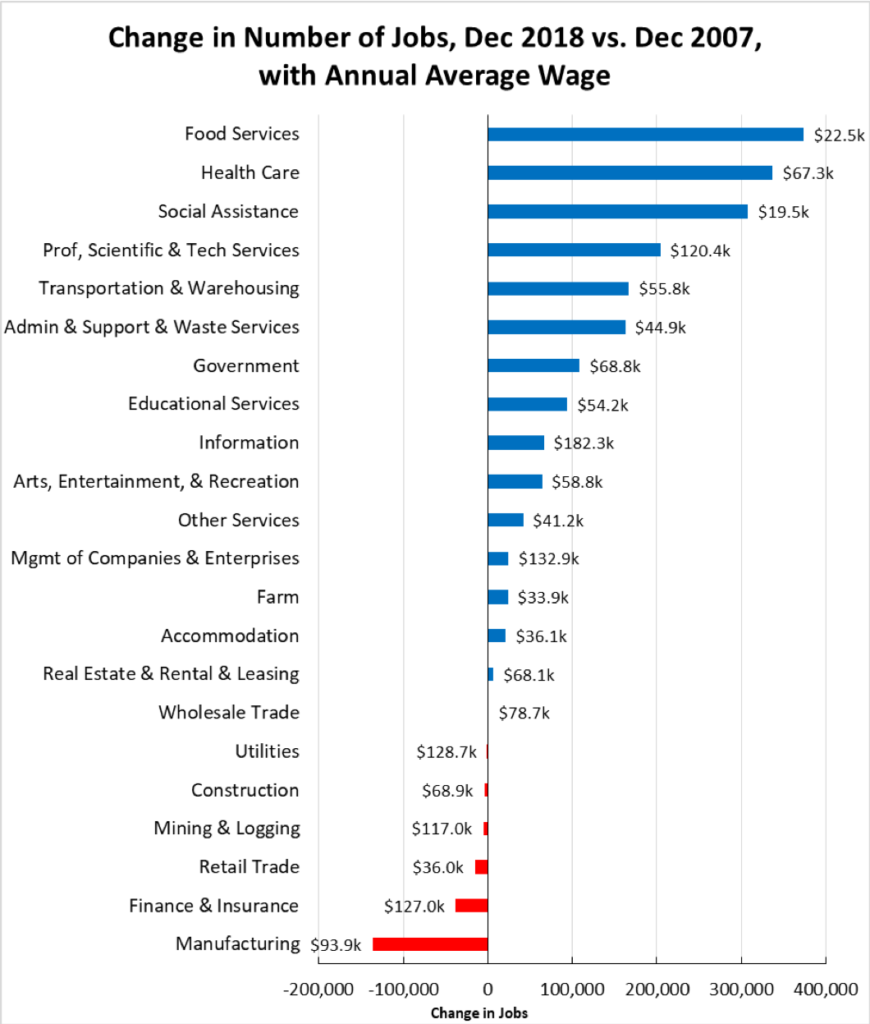
Structural Shifts in State’s Economy
Source: California Employment Development Department
Comparing current job numbers to the pre-recession levels in 2007 illustrates the structural shift in the state’s economy, with the primary jobs growth occurring in the higher and lower wage industries.
Jobs growth within the traditional middle class wage—especially blue collar industries such as Manufacturing, Construction, and Mining & Logging—continues to lag. Of these, Construction has gained ground in the past year as activity has picked up. However, construction jobs remain 72,800 below the 2007 peak—in part due to seasonal factors—and 199,300 (12%) below the pre-recession high in 2006.
Unemployment Rates by Region
| California | 4.1 |
| Bay Area | 2.6 |
| Orange County | 2.8 |
| Sacramento | 3.6 |
| San Diego/Imperial | 3.8 |
| Inland Empire | 4.0 |
| Central Sierra | 4.1 |
| Los Angeles | 4.5 |
| Central Coast | 5.7 |
| Upstate California | 5.7 |
| Central Valley | 7.4 |
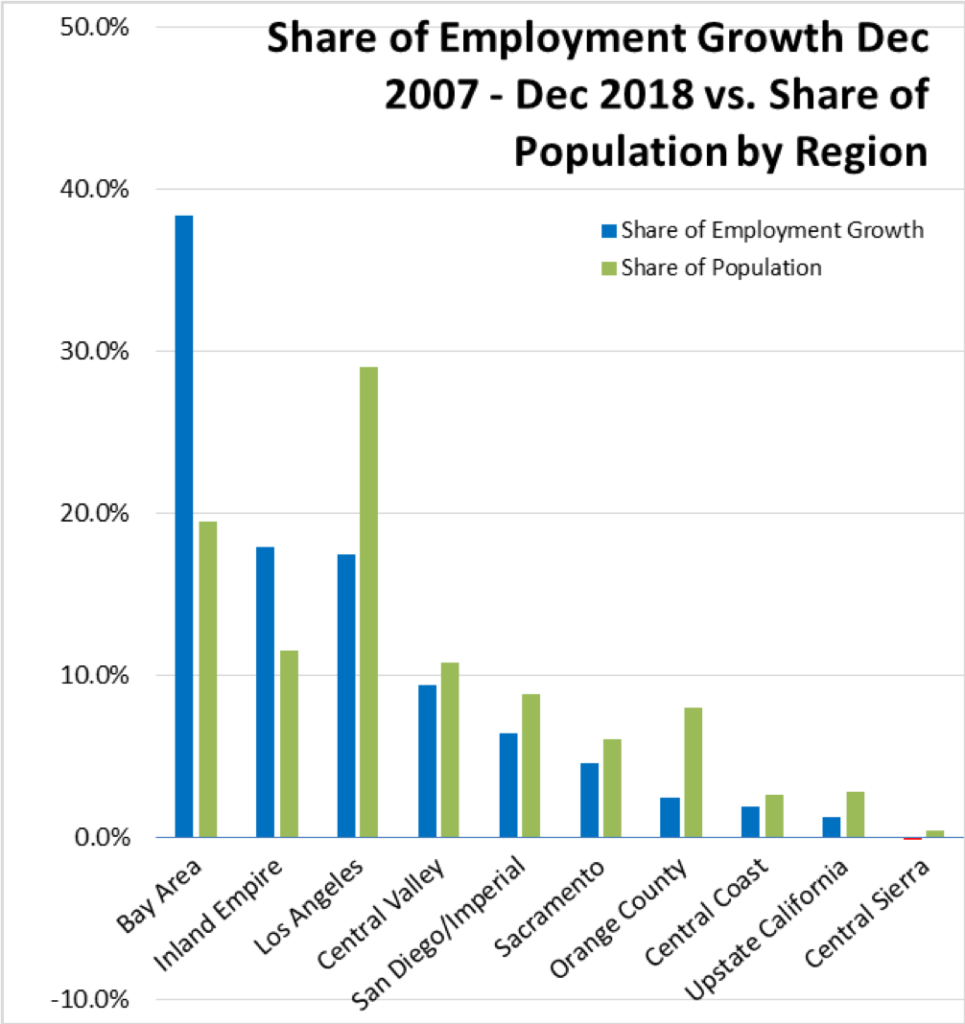
Employment Growth by Region
Source: California Employment Development Department
Containing 19.6% of the state’s population, the Bay Area has accounted for 38.4% of net employment growth compared to pre-recession levels.
Illustrating the significant effect of housing prices on commuting patterns and therefore energy and global warming emission levels, Inland Empire remained in second place at 18.0%.
Los Angeles Region, with 29.1% of the population, accounted for only 17.4% of net employment gains.
Unemployment Rates by Legislative District
| Lowest 10 Unemployment Rates | |||||
|---|---|---|---|---|---|
| CD18 (Eshoo-D) | 2.0 | SD13 (Hill-D) | 1.9 | AD22 (Mullin-D) | 1.8 |
| CD12 (Pelosi-D) | 2.0 | SD11 (Wiener-D) | 2.2 | AD16 (Bauer-Kahan-D) | 1.9 |
| CD17 (Khanna-D) | 2.2 | SD39 (Atkins-D) | 2.5 | AD24 (Berman-D) | 2.0 |
| CD52 (Peters-D) | 2.3 | SD36 (Bates-R) | 2.5 | AD28 (Low-D) | 2.1 |
| CD14 (Speier-D) | 2.3 | SD37 (Moorlach-R) | 2.5 | AD17 (Chiu-D) | 2.2 |
| CD15 (Swalwell-D) | 2.4 | SD15 (Beall-D) | 2.6 | AD25 (Chu-D) | 2.3 |
| CD45 (Porter-D) | 2.4 | SD10 (Wieckowski-D) | 2.6 | AD77 (Maienschein-D) | 2.3 |
| CD49 (Levin-D) | 2.5 | SD07 (Glazer-D) | 2.6 | AD19 (Ting-D) | 2.3 |
| CD48 (Rouda-D) | 2.6 | SD02 (McGuire-D) | 3.1 | AD73 (Brough-R) | 2.3 |
| CD19 (Lofgren-D) | 2.8 | SD34 (Umberg-D) | 3.1 | AD78 (Gloria-D) | 2.4 |
| Highest 10 Unemployment Rates | |||||
|---|---|---|---|---|---|
| CD43 (Waters-D) | 5.3 | SD33 (Lara-D) | 5.2 | AD30 (Rivas-R) | 6.1 |
| CD09 (McNerney-D) | 5.6 | SD24 (Durazo-D) | 5.2 | AD03 (Gallagher-R) | 6.4 |
| CD10 (Harder-D) | 5.9 | SD30 (Mitchell-D) | 5.4 | AD23 (Patterson-R) | 6.4 |
| CD44 (Barragán-D) | 6.4 | SD35 (Bradford-D) | 5.7 | AD64 (Gipson-D) | 6.6 |
| CD23 (McCarthy-R) | 6.7 | SD05 (Galgiani-D) | 5.9 | AD13 (Eggman-D) | 6.7 |
| CD20 (Panetta-D) | 6.9 | SD08 (Borgeas-R) | 5.9 | AD21 (Gray-D) | 8.1 |
| CD22 (Nunes-R) | 7.4 | SD16 (Grove-R) | 6.6 | AD31 (Arambula-D) | 8.9 |
| CD51 (Vargas-D) | 8.1 | SD40 (Hueso-D) | 6.9 | AD56 (Garcia-D) | 9.2 |
| CD16 (Costa-D) | 8.4 | SD12 (M. Caballero-D) | 7.8 | AD26 (Mathis-R) | 9.3 |
| CD21 (Valadao-D) | 9.2 | SD14 (Hurtado-D) | 10.2 | AD32 (Salas-D) | 9.5 |
10 MSAs with the Worst Unemployment Rates
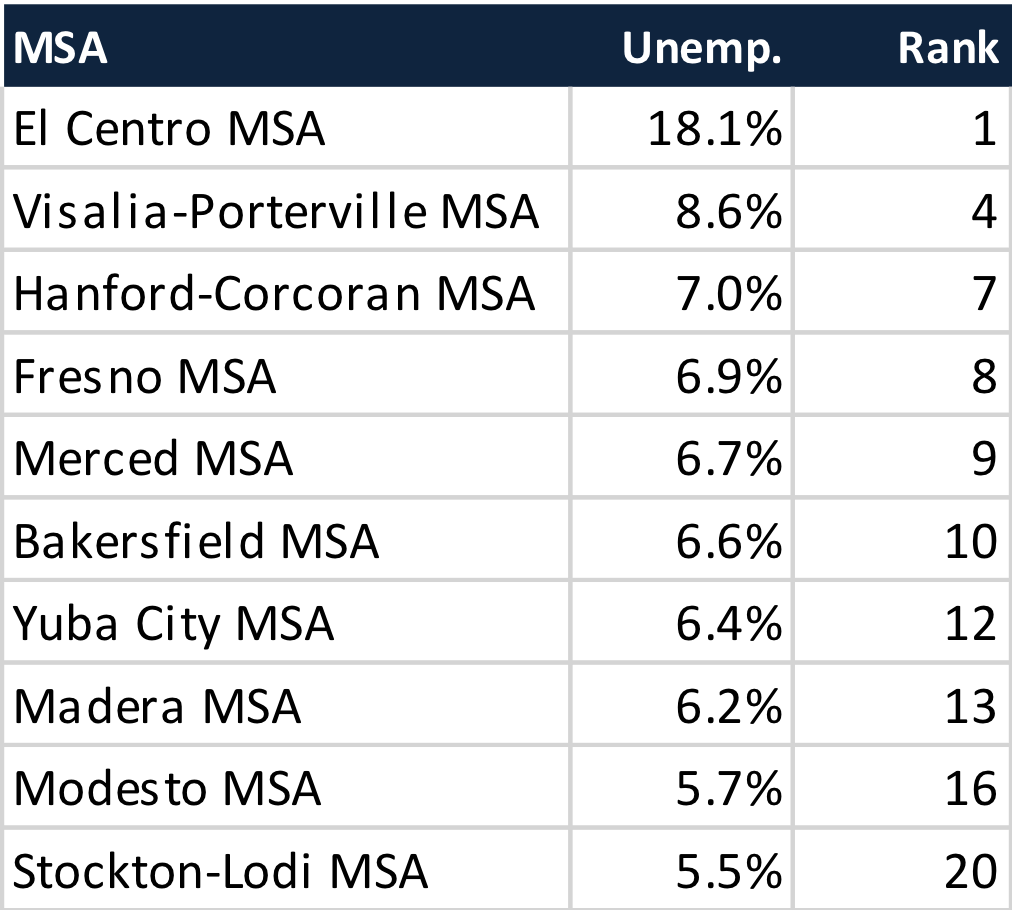
Of the 20 Metropolitan Statistical Areas (MSAs) with the worst unemployment rates in November 2018, 10 are in California, including El Centro MSA (Imperial County) with the highest unemployment in the country.
Chart of the Month: State Budget Reliance on Bay Area Revenues
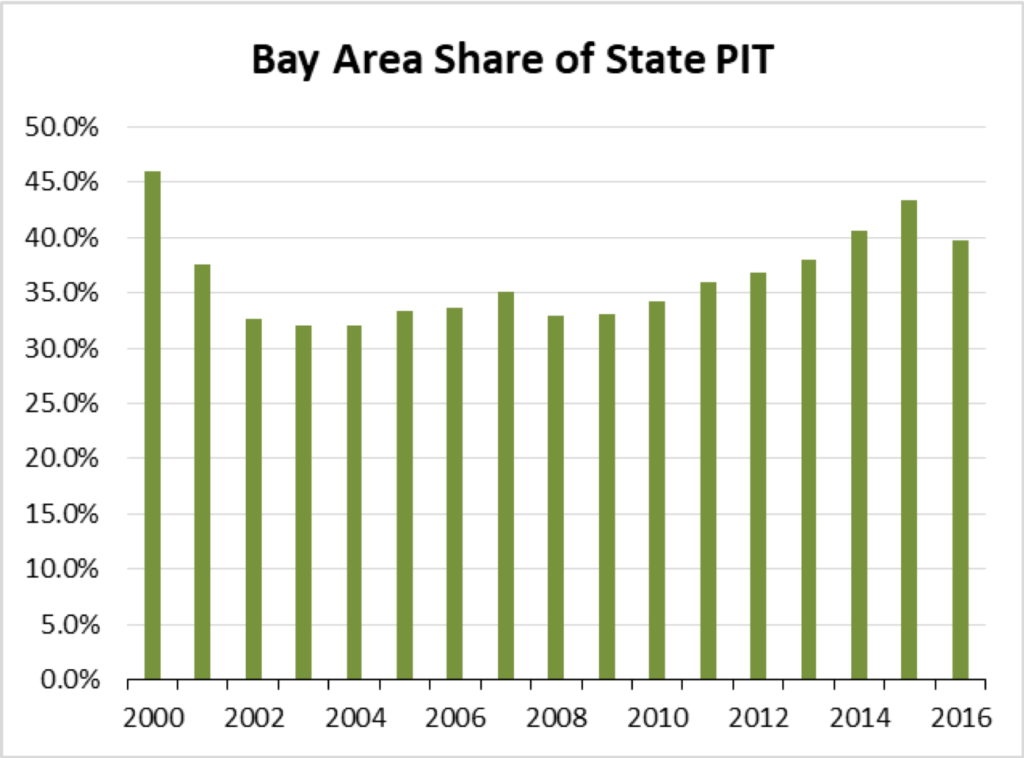
The recent release of the Governor’s Proposed Budget is a reminder of the increasing volatility of General Fund revenues due to their rising reliance on the state’s highly progressive personal income tax (PIT). Total PIT receipts have gone from 55% of the General Fund in 1999-2000 to an expected 69% in 2019-20.
Less discussed, however, is the General Fund’s growing dependence on a single geographic region, the Bay Area. In 1990, the Bay Area produced 27% of total state PIT, growing to 40% in the most recent 2016 results and peaking at 46% just before the Dot.Com Bust. As the state’s economic structure has evolved to higher wage jobs in this region and a preponderance of lower wage job growth elsewhere in the state, the financing structure for the state’s spending has followed as well.