Highlights for policy makers:
- COVID-19 and the State Economy
- Employment: 1.497 Million Below Recovery
- Labor Force Participation Rate Up at 60.6%
- Employment Growth Ranking
- Nonfarm Jobs: 1.460 Million Below Recovery
- Jobs Change by Industry
- Unemployment Rates by Region (not seasonally adjusted)
- Unemployment Rates by Legislative District (not seasonally adjusted)
- How Far Back Has the Economy in Each County Been Pushed?
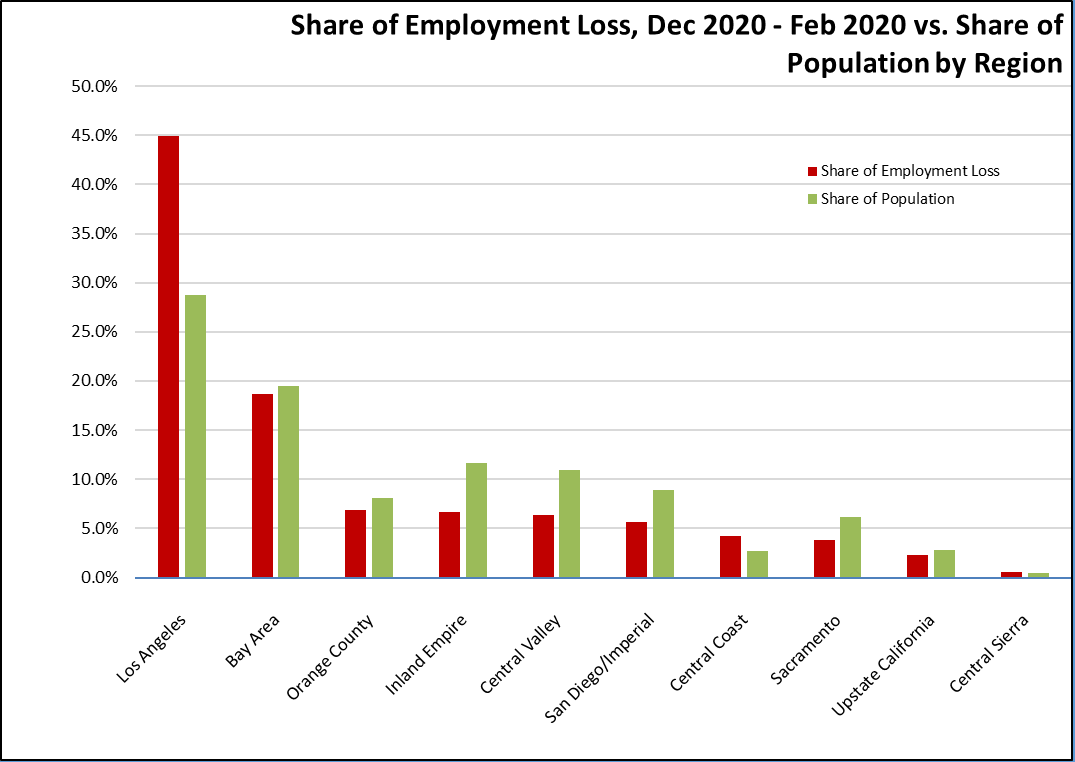
- Employment Share by Region
- MSAs with the Worst Unemployment Rates: Los Angeles Rises to 15th Worst in Nation
- Data Notes
COVID-19 and the State Economy
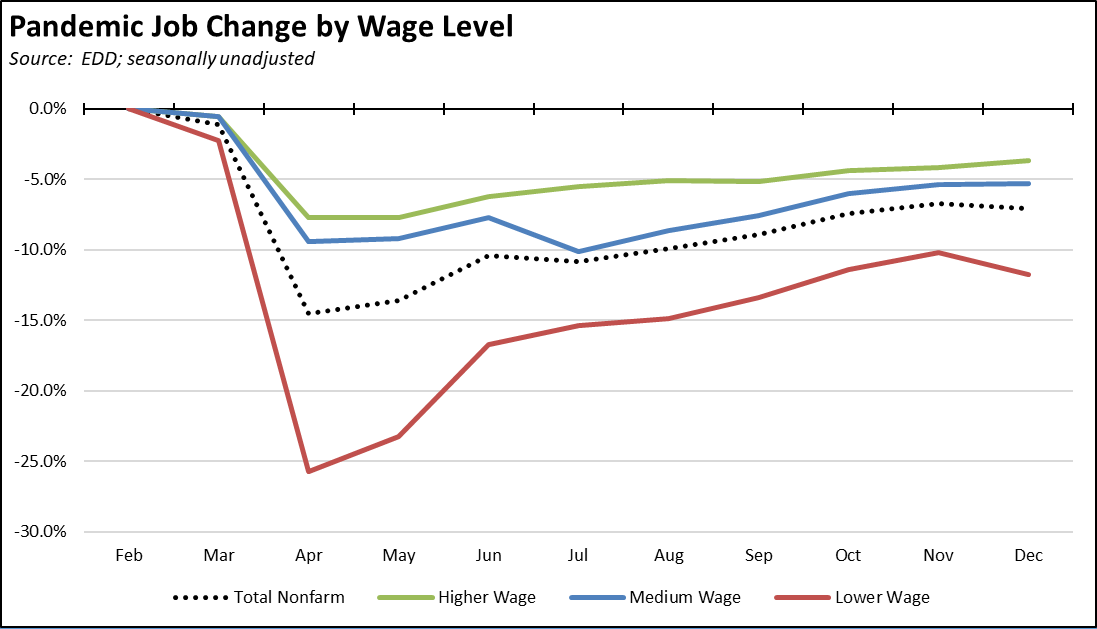
As a result of the state’s stay-at-home orders, the December results show a reversal in the state’s economic recovery during what in most other years is the peak period of jobs, sales, and cash flow essential to the continued viability of many retail and service businesses. Rather than producing the operating cash balances these businesses—especially small businesses—need to sustain operations through the coming year, the December job numbers indicate the continuing disparate effect of the state’s strategies. Jobs losses expanded within the industries already hit hardest in the current crisis, while an increasing number of higher wage industries have moved from recovery to jobs growth in large part due to the rapid shift to telecommuting. Because the surveys used to estimate the upcoming January jobs and employment data were done during the stay-at-home order period and because virtually all the unemployed are in counties that remain under the most restrictive Tier 1 classification, this trend is likely to continue in next month’s results.
Both high wage and medium wage jobs were largely unaffected by the state’s stay-at-home orders. Lower wage job industries contained nearly all of the monthly losses. In the chart, higher wage jobs are those industries with average annual wages above $100,000; medium wage is $50,000 to $100,000; and lower wage is below $50,000. Job data is drawn from the industry classifications, unadjusted job numbers, and wage levels shown in the regular report section below on Nonfarm Jobs.
December Numbers in Context: Recovery Delayed
In their most recent economic projections used to develop the recently released proposed budget, Department of Finance expects the pandemic recovery to repeat in many ways the long and shallow recovery period experienced by the state after the recession that began in 2008. Both employment and jobs recovery are not expected until after the projection period, likely sometime in 2025 or later.
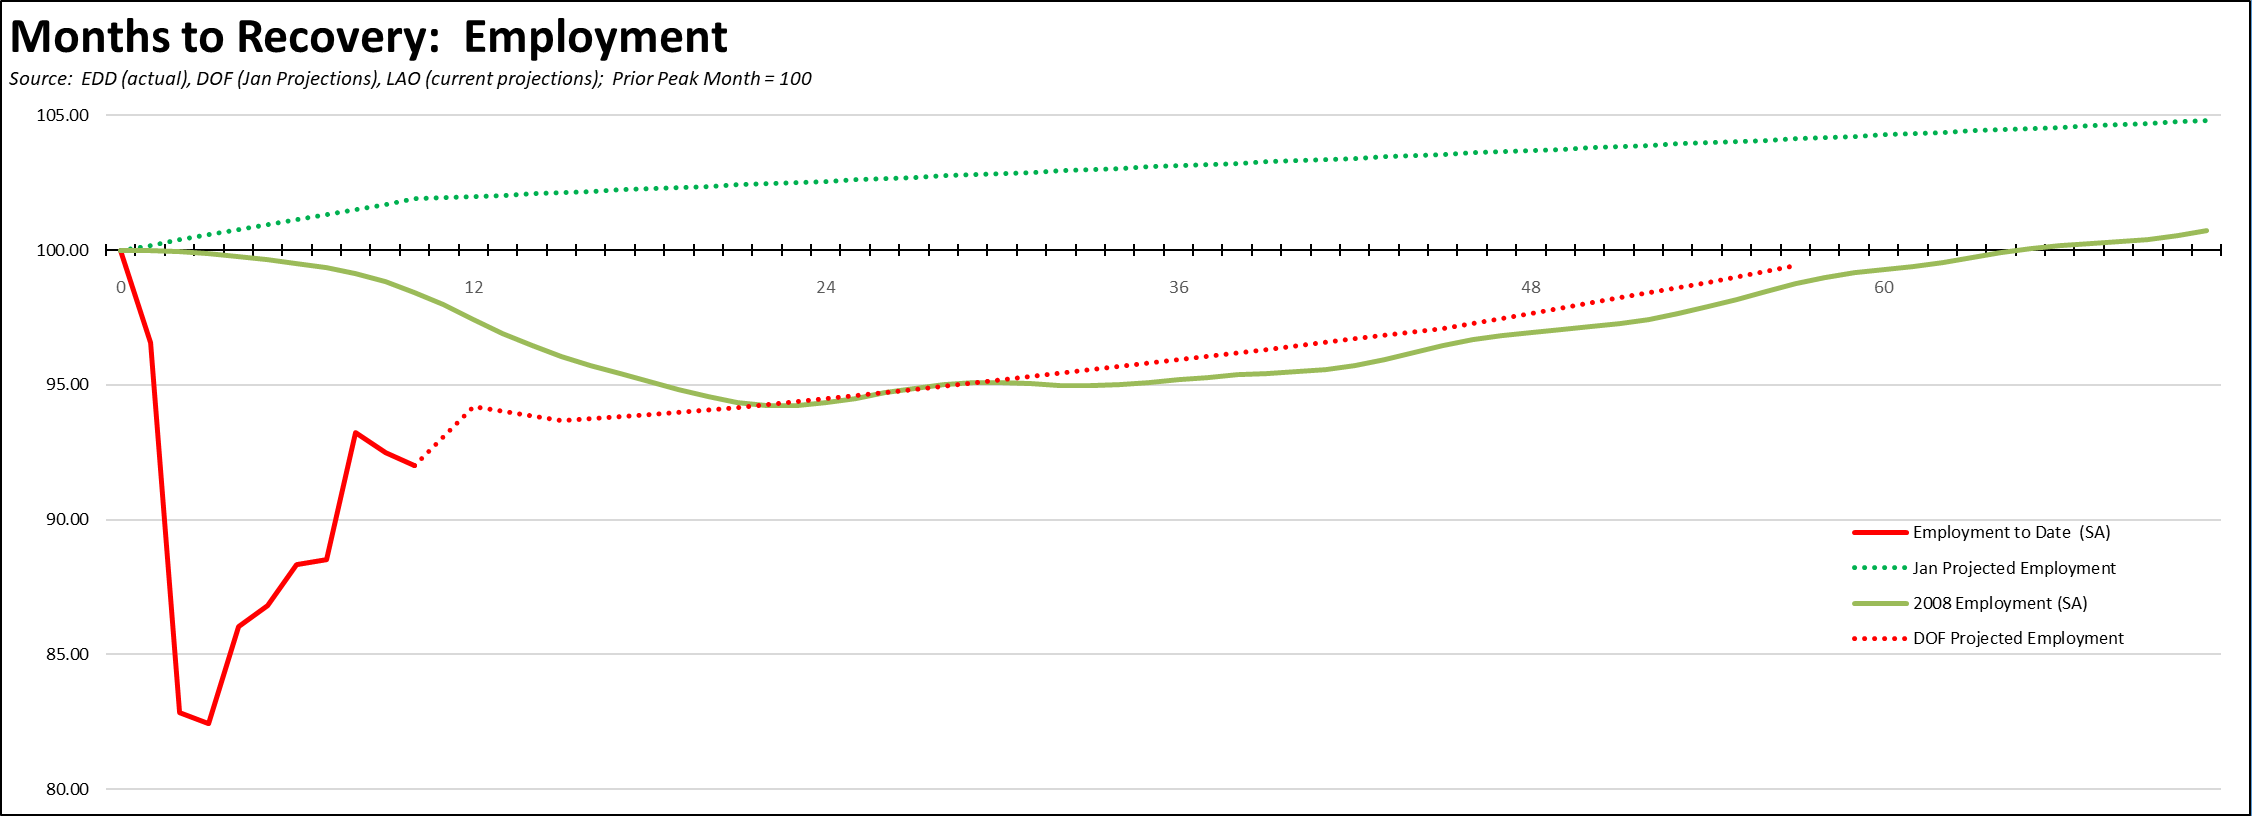
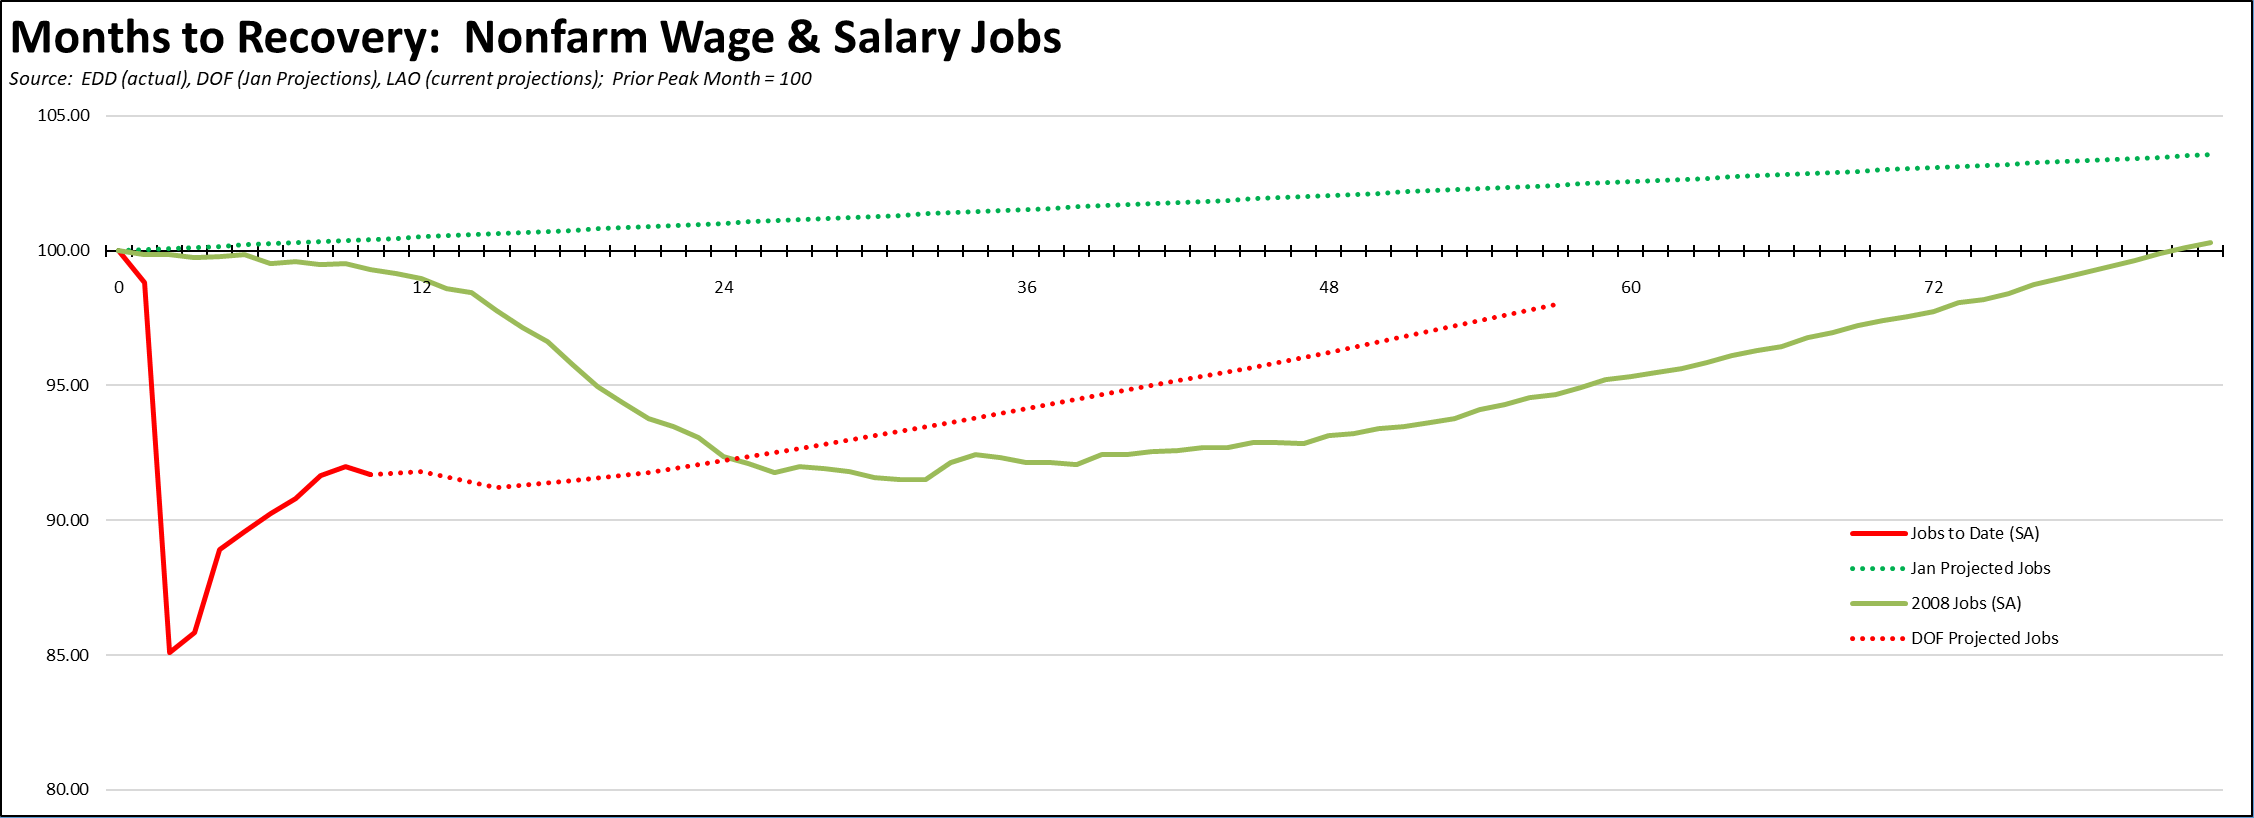
“Recovery” in this sense, however, only means returning to the pre-crisis highs in February 2020. In the charts above, a “pre-crisis trend” is provided from the comparable projections Finance made in January 2020 prior to the current downturn. True recovery should incorporate both the return to prior levels and a return to trend to account for population and foregone economic growth. From this perspective, full recovery will require even more time in the absence of state actions to accelerate that growth.
As shown in the charts, employment recovery in the period after the 2008 recession occurred about 16 months before jobs recovery was attained. In this period, many workers turned to self-employment as an income option especially as jobs growth remained low as compared to prior recovery phases. In the current circumstances, workers have far fewer such opportunities as the state previously destroyed many self-employment options through enactment of AB 5 (2019) and has maintained these restrictions even as the state suffered unprecedented jobs and income losses. The Finance projections consequently show employment and jobs recovery necessarily tracking much more closely. California workers in the current crisis instead must remain more reliant on government assistance such as unemployment insurance rather than pursuing self-employment on their own, and consequently have been more deeply affected by state mismanagement of that program to date.
The Finance projections, however, were completed in November during a period of stronger recovery numbers and prior to events that have reversed that course including the stay-at-home orders, a surge in California infections, delays in state administration of the vaccines, and the discovery of new variants of the virus. The combined effects are likely to extend the projected recovery dates further, but additional insights from the upcoming months will be addressed in the updated projections to be released along with the May Revise later this year.
Economic uncertainty, however, remains, and while the recently released proposed budget at least begins to address the need for actions to facilitate faster recovery, the emphasis remains on income assistance rather than jobs and income restoration.
December Numbers in Context: Employment Gains & Losses in the First Half of 2020
The Business Employment Dynamics (BED) series measures the flow of wage and salary jobs over the course of each quarter based on data from the Census of Employment & Wages. Unlike the monthly data that is estimated based on surveys, this data reflects actual counts drawn from employment tax filings. The monthly data is also a point-in-time estimate, while the BED data accounts for all hirings and separations within each quarter—the flow of employment gains and losses rather than a single point estimate. Data is provided only for private sector jobs. Consequently, government, self-employment, and other non-wage and salary employment are not included in the totals.
The most recent data provides a comparison for the first half of 2020, incorporating job losses due to the crisis beginning in March.
The first table shows private sector establishments categorized by whether they gained or lost jobs within the two quarters, and whether those job changes were the result of openings and expansions or closings and contractions. As shown, there were 69,000 fewer establishments increasing jobs in the first half of 2020 compared to the same period in 2019, and 158,000 more reducing jobs. This period of state restrictions also saw an additional 50,000 establishment closings over what would otherwise be expected from seasonal factors and a more typical pattern of business failures. Note that “establishment” is not the same as a business, and individual firms may operate more than one establishment within the state, either at different locations or dissimilar operations at the same location. Also note that the establishment data covers essentially the same universe twice and sums their responses in each of the two quarters.
The private job flows are shown in the second table. Overall, private businesses created 324,000 fewer jobs than for the same period in 2019, while job losses were 1.6 million higher. In total, the first half of 2020 saw a net loss of 1.9 million private jobs during this beginning period of the state restrictions.
California Establishment Data, Business Employment Dynamics for Q1 & Q2
California Employment Data, Business Employment Dynamics for Q1 & Q2
Califormers: Migration and Its Implications to Recovery
The recent announcement of the Align Technology move to Arizona is one of the latest in a series of businesses, in particular Silicon Valley firms, shifting operations out of the state. The apparent increase of companies leaving California combined with anecdotal and other evidence of a surge in individuals leaving as well suggests longer term implications to the state’s economic competitiveness. The characteristics of which businesses and which individuals are migrating has even stronger implications to the sustainability of the state’s current fiscal structure.
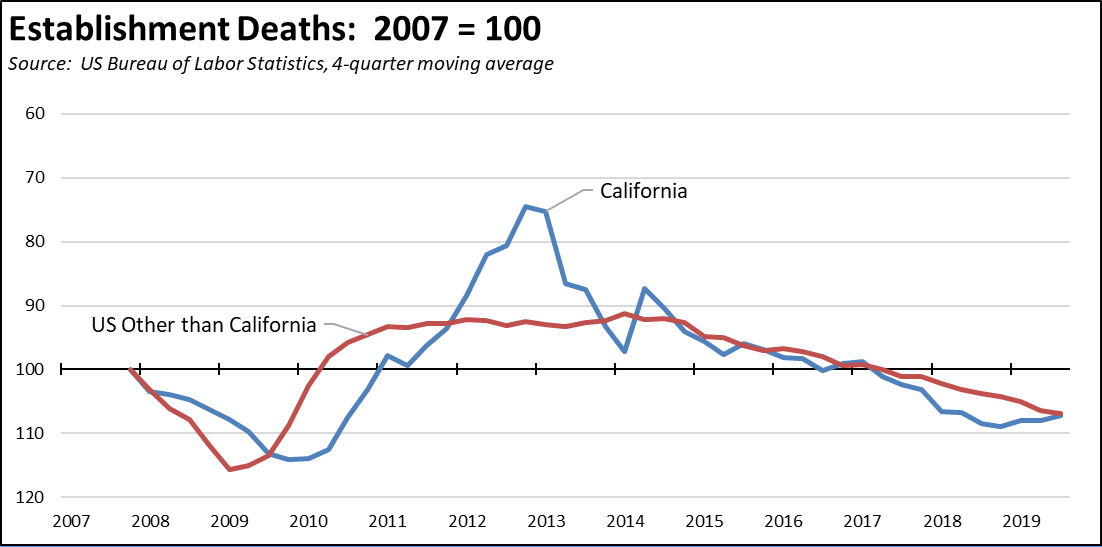
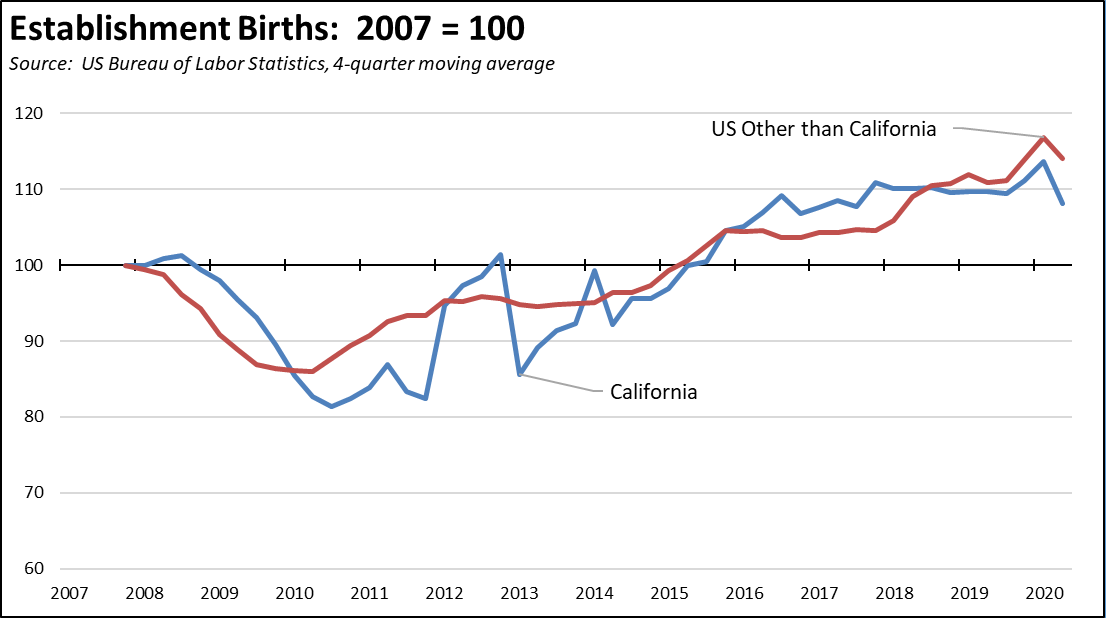
The BED series provides some generalized data on these issues. While the number of closing and opening establishments shown in the tables includes those doing so for seasonal or other temporary reasons, comparisons of the payroll data over more than one quarter are also used to identify establishment deaths and births. Due to the nature of the data, establishment death results lag the birth numbers by three quarters.
Beginning in 2014, the relative level of establishment deaths in California tracked closely with those in the other states. Following the recovery of housing prices in 2017 and 2018 that made migration more financially viable for businesses and their employees, there was an upsurge in California relative to the rest of the US through the first half of 2019. Compared to pre-housing recovery 2016, the 2018 results alone show 14,000 more establishment deaths in the state. This number is relatively small compared to the 1.6 million total private establishments in California, but it does show that even prior to the current crisis, there was some movement in the number of businesses no longer operating in the state whether because they had moved or for other reasons. At the same time, the relative pace of establishment births stalled beginning the second half of 2017 while showing a strong growth phase in the rest of the country.
Official Response #1: We’re California; They Will Come. The continual expectation in California, however, is that even if some businesses leave, there will always be more to take their place. California generally has been fortunate in this regard. In other states, the closure of an industry has often meant a sustained period of economic distress, as evidenced by more than one city in the nation’s northeast.
Since its initial dependence on gold mining, California instead has constantly renewed itself, with older industries receding in importance or dominance, and new ones constantly being born—other than the film industry which initially moved in part to escape over regulation in New York, being born here not moving here—to replace those jobs and advance the economy even further. California was the place where new ideas and businesses were free to grow. The costs of living for each surge of employees were low, and the state offered them paths to wealth creation through both home ownership and entrepreneurship and generational advancement through education.
The current circumstances are different, and the key change is in how that growth has emerged over the past two decades. Previous rounds of expansion, whether led by agriculture, trade, film, manufacturing, aerospace, computers, or any of the many other smaller groupings in which the state has led, generally began in a central location. Jobs then spread to the surrounding regions as support and supply businesses grew up around those centers and spawned similar geographic expansions on their own. When one industry began to contract within the state, many engineers, technicians, managers, and business owners chose to stay and formed the entrepreneurial core leading to the next round of economic innovation, creating new businesses and doing so over a broader swath of the state.
For the past two decades, California’s economic growth instead has been dominated by the tech industry, and in sharp contrast to historical growth patterns, that industry has been heavily concentrated within a single region. The Bay Area has been the center of this high-wage job growth due to the agglomeration economies formed by that region’s research universities, the high-skilled workforce, and until recently the same degree of concentration in the venture capital driving that growth. The related job growth in support, supply, and ancillary operations such as manufacturing bypassed other regions in California and instead went to lower cost locations in other states and other countries.
In the process, the tech industry began recreating the Bay Area competitive conditions not in other parts of the state, but other cities in other states. Competing centers now offer many of the same agglomeration economies of ties to local universities and a growing skilled tech workforce, but at far lower costs to the tech businesses and to their employees. These are the centers to which Bay Area tech headquarters and venture capital are now moving.
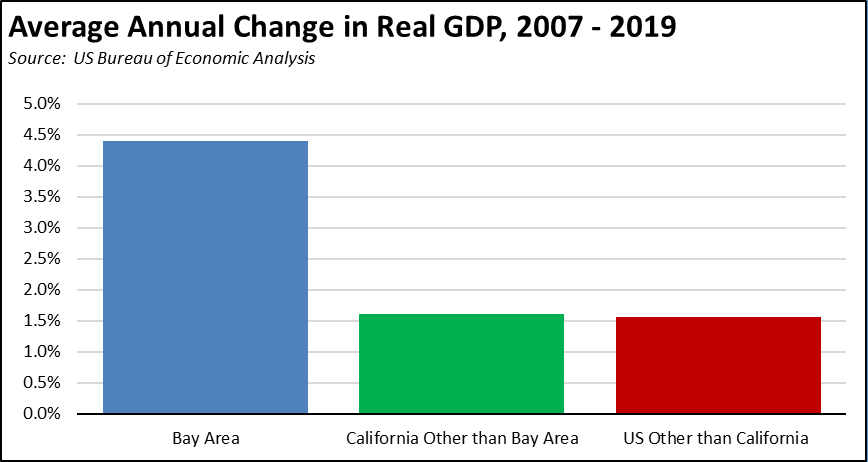
Official Response #2: High Taxes & High Regulation Are Compatible with a Resilient Economy. The other core expectation has been that California’s growth has so outperformed the US overall that it proves that high taxes and high levels of regulation are not an impediment to jobs growth, that increasing regulation can be done without consideration of the cumulative costs to businesses and households and still somehow result in a “resilient economy.” This is the view from the Bay Area, and it is a view made possible solely by the outsized performance of that region. The rest of California shows economic results that are no better than the other states.
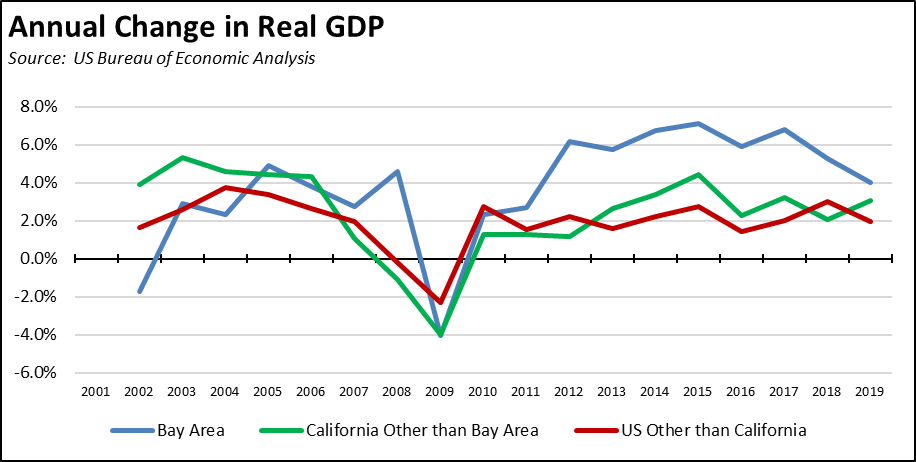
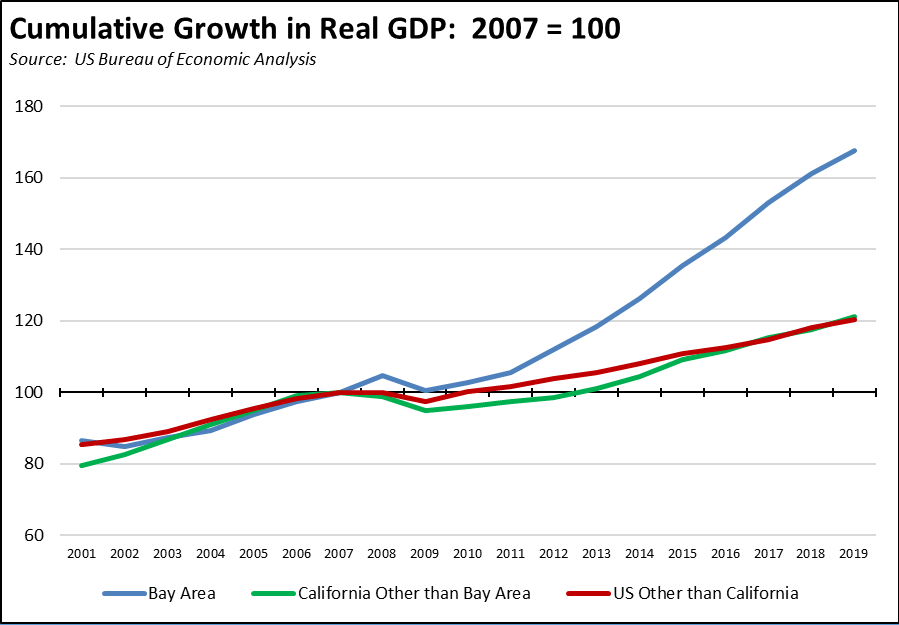
For the last two decades, the overall economic performance of California has largely been determined by the results coming out of the Bay Area. At the beginning of this period, the economic downturn coming from the Dot.Com crash was largely restricted to this region, while the rest of the state evidenced continued growth coming off the regulatory and tax reforms in the 1990s. Using the previous economic peak in 2007 as the base, average annual real GDP growth in California outside the Bay Area has matched the average in the other states. The Bay Area in sharp contrast was nearly 3 times as large.
Looking at the cumulative real GDP growth in the third chart, the rest of California in fact lagged the rest of the states in the previous recovery from the recession that began in 2008, as the state chose to increase substantially its regulatory and tax burdens on jobs creation and household costs of living even during a nearly unprecedented economic downturn. That far larger portion of the state did not catch up to the rest of the nation until 2017 and has grown in tandem since then. Again in sharp contrast, relative real GDP growth in the Bay Area was nearly 50 percent higher by 2019. Prior to 2007, the three areas shown moved more closely together. After 2007, the state’s growing regulatory and tax burdens held much of the state back economically, while the Bay Area—powered by a tech industry that is far less subject to regulation than the state’s traditional businesses—soared.
Why does this matter?
- Without the Bay Area, California’s economic performance has been no different than the other states. Factoring in income inequality coming from the job mix able to grow in the other regions under the state’s high regulation and tax burdens and as it is intensified each year by the state’s high and growing costs of living, California has done far worse. Just meeting the average is not sufficient if those gains are continually outmatched by growing costs for housing, commuting, energy, childcare, and every other basic living need that are being driven by state policies. The Bay Area has experienced outsized growth because the tech industry is far less subject to the state’s growing regulatory structure, and in fact components now run by billionaires have been created by those regulations and their shift of the associated costs from investors to ordinary consumers. The other 80% of the state instead has seen income gains swamped by cost increases, and the current business climate in the state offers few incentives for yet another phase of innovation and job growth of the types that will turn this situation around for them. California may still be the place where the jobs of the future are created and designed. The performance of 80 percent of the state in the last two decades suggests this may not be where they are grown, and increasing business migration—if sustained—is a leading indicator they will not.
- The economic performance of the Bay Area is now the primary determinant of the state’s fiscal health as well as its economy. As discussed in previous months’ reports, that region’s high incomes and capital gains combined with the state’s extremely progressive tax rates have seen the Bay Area produce about 40% of total personal income tax (42% in the most recent 2018 data), which in turn makes up two-thirds of the general fund revenues. This region also produces a similarly high share of corporate income tax and somewhat higher share of sales and use tax, the other two primary components of the general fund revenues. As indicated in the first GDP chart, the budget crisis in 2002 was solely because of a collapse in revenues from the Bay Area—the rest of the state continued to evidence economic growth. The state’s current revenue and expenditure structure relies on continued high growth in the Bay Area. If high tech firms or their employees through telecommuting move out of the state in numbers, that structure quickly crumbles. If that structure crumbles, the state’s approach of trying to respond to the growing costs of its regulatory policies through subsidies and other public assistance crumbles as well. The state’s budget structure crashed at the beginning of the 2000s due to changes in the Bay Area. It happened before, and it can happen again.
- The current situation is different. The industries and jobs waiting in the wings that could take the place of jobs now leaving the state are likely to come from the entrepreneurial base that is now leaving along with them—components of companies and future innovators that are now freed from the geographic groundings that generated that state’s economic rebirth cycles in the past. The state’s economic growth in the last decade far surpassed the nation’s due to the unique advantages found in the Bay Area. Soaring costs driven by the state’s policies forced businesses to recreate them elsewhere after years of warning that changes to those policies had to be made.
- The current situation is different. The rapid embrace of telecommuting has moved business migration decisions from solely the firm level to encompass individuals as well. Telecommuting as a standard form of employment coming out of the current crisis can undermine skilled labor as one of the key underpinnings of the Bay Area’s past agglomeration economies. Firms can now access the skills they need from anywhere. Workers with those skills can now be anywhere and chose what they are willing to pay for housing, commuting, energy, taxes, and the other costs of living state policies have set for them in the past.
In their most recent survey of companies in their portfolio of tech companies, Initialized found only 26.5% planned to return to a primary office structure. Another 37.3% planned a “hub and spoke” arrangement with multiple smaller offices in different areas, and 36.1% planned to go fully decentralized with little or no office usage. In 2020, the Bay Area was still the leading choice (41.6%) as the best place to start a company. In 2021, starting a company fully in the cloud led by 42.1%, with the Bay Area coming in as a distant second at 28.4%.
In a recent survey of San Francisco tech companies by sf.citi, 63% plan to or already have downsized their office space as workers are shifted more to telecommuting.
In a similar survey by West Monroe that covered a much broader range of industries and focused on companies with sales of over $250 million, only 9% plan to return to work fully on-site and another 38% mostly on-site with some remote work. In contrast to the tech industry results, 1% plan to be fully remote and 9% mostly remote, but 43% plan to split their workforce between on-site and remote. More importantly, 25% of the responding companies indicated they are considering moving their business operations, with costs of living and the resulting effect on wages cited as the primary reason by 39% of those considering a move, taxes by 21%, real estate costs by 16%, and regulations by 8%. In other words from this survey, direct regulation on an industry is not the primary driver causing businesses to consider a move. It is the overall effects of the full body of a state’s regulations on the costs of operating a business and costs of living affecting their employees that is sparking this growing trend.
Official Response #3: As a Percent of the Total, Few Firms Have Left the State. As indicated in the earlier BED data, up to an additional 14,000 establishments left the state or otherwise closed in 2018. For most states, this is a large number. For California, it’s large but still represents only 1% of the total.
Physically moving an entire company is not the only path business migration takes. Smaller and even some medium sized companies may do so, but few companies of size move all of their operations out of the state. California’s size means few companies are willing to abandon this market share to their competitors unless forced to do so by costs. Even for tech industries, the Bay Area remains the central hub, and some level of connections must be retained to keep current with emerging technology and investment trends.
Business migration can occur in several ways:
- The entire company can be moved. Especially for small and medium sized companies, the rebound in housing and other property values beginning in 2017 and 2018 meant property again can be sold in California, and yield gains that are large enough to finance both a move and often updates and expansion to production capacity as well in the new, lower cost locations. Employees similarly are able to finance their own moves, acquire higher quality housing or even afford to buy for the first time, and secure a substantial increase in their real incomes through lower costs of living. Migration of this type often means more than the loss of the jobs actually moved. The state also gives up on future jobs growth from more efficient and competitive companies and their supply and marketing chains.
- Operating units can be moved. An increasing number of larger companies have faced the question of: if employees don’t have to be in California to do their job, can they be moved to another, lower cost state? In the process, whole companies have not left the state, but many of their operating units have, in particular back office operations and other support units including many that individually or as a second jobholder provided middle class income levels to households in the state. The rapid advance of remote work in the current crisis now expands this option to a broader range of operations. In a recent example, Charles Schwab did not make a single decision to move to Texas. Individual units were moved over a period of years, and the company was quite public about the fact it was doing it and the disadvantages in California that were causing it to do it. The disadvantages continued unchanged, and at some point moving the headquarters became the obvious business decision as well. The company’s headquarters move announcement should not have been a surprise; that decision was in the makings and could have been addressed for many years.
- Expansion can occur in other states. California’s economy was resilient in the past because its businesses invested and grew in the surrounding regions. The Bay Area experienced outsized growth because it was where tech firms had to invest in order to grow. The high costs of operating a business in California now mean many expansion investments are going to other states. The high costs of living now mean the necessary labor force and skills can only be found in those states or would prefer to live in those states. California will still grow the lower wage jobs found in population serving services because they need to be where the population is. Lower wage tourism jobs will grow because the features in the state attracting tourists likely will not move. But the investments required to grow middle-class and higher wage jobs may go elsewhere because that is where they need to be in order to be economic and attract the necessary labor skills.
- As discussed previously, telecommuting now democratizes business migration decisions from the company to the individual worker level. In California, telecommuting is primarily an option for higher wage workers ($100,000 or more average annual wage)—of which about 70% work in jobs that can be done entirely working from home and others that can be done working at least some portion of the time from home—and to a somewhat lower degree (56% entirely from home) for middle wage workers ($50,000 – $100,000). Based on the 2019 data, another 2 million plus lower wage workers are in jobs that could be done working entirely from home, but the lack of flexibility in state regulations limits this option for most of them—not the regulations themselves but the lack of flexibility in how they are applied that is now given only to government workers at this wage level.
Critiques that attempt to counter claims of business flight from California’s high regulations, taxes, and living costs generally focus exclusively on the first component, in part because it is the easiest to measure and for the affected communities, often the most immediately noticeable. The other three, although far more difficult to measure, likely exceed the first in terms of total jobs and foregone tax revenues required to support the state’s expanding social programs. The BED data will continue to provide some level of insights on the first point. As discussed in prior month reports, the upcoming Census numbers will only provide population information relative to the fourth point as of April 2020, and a more complete picture of population and worker loss from telecommuting likely will not become available until release of the American Community Survey data in 2022. Data on the other two forms of migration are less available, but will be reflected in the future pace of job creation at the middle and higher wage levels and the extent to which workers continue to move to other states for these jobs.
Recent announcements, however, suggest an accelerating pace of business migrations out of the Bay Area. While by no means comprehensive, the following list covers some of these recent announcements along with other notable businesses who have moved to other states in recent years.
Califormers (Partial List)
| wdt_ID | Companies | From | To | Reason | Source |
|---|---|---|---|---|---|
| 2 | 8VC | San Francisco | New VC office in Austin | ||
| 3 | Aeromax | Canoga Park | Texas | HQ move | |
| 4 | Airbnb | San Francisco | Subleasing current office space | Read More | |
| 5 | AJ+ | San Francisco | Washington, DC | HQ move | |
| 6 | Al Frank Asset Management | Los Angeles | Texas | HQ move | |
| 7 | Align Technology | San Jose | Tempe | HQ move | Read More |
| 8 | Alphabet | Mountain View | Austin, Texas | Expanding or plans to expand | Read More |
| 9 | Amazon | Various | Austin, Texas | Expanding or plans to expand | Read More |
| 10 | Apple | Cupertino | Austin, Texas | $1 billion campus | Read More |
| 11 | ASGN Incorporated | Calabasas | Texas | HQ move | |
| Companies | From | To | Reason | Source |
| wdt_ID | High Income Taxpayers | Company | To |
|---|---|---|---|
| 2 | David Blumberg | Blumberg Capital | Miami |
| 6 | Larry Ellison | Oracle | Hawaii |
| 10 | Drew Houston | Dropbox | Austin |
| 14 | Naveen Jain | Tari co-founder | Nashville |
| 18 | Joe Lonsdale | Palantir | Austin |
| 22 | Douglas Merritt | Splunk | Austin |
| 26 | Elon Musk | Tesla, others | Austin |
| 30 | Paul Petrovich | Petrovich Development Co. | Austin |
| 34 | Keith Rabois | Founders Fund | Miami |
| 38 | Ron Suber | Fintech investor | Boulder |
Official Response #4: Green/Clean Energy Jobs Can Replace What the State is Losing. The January proposed budget again highlights spending on the state’s climate change programs as the largest component of actions presumably being taken to accelerate economic recovery and job creation, in particular $1.5 billion to promote zero emission vehicles. The entry for Tesla in the Califormers list, however, indicates that even though the spending may be in the state, the jobs are going elsewhere.
In July 2020, Tesla announced its plans for a $1.1 billion gigafactory with 5,000 jobs building its new Cybertruck, Model Y vehicles, and the required batteries in Austin. The factory is planned to begin operation in 2021.
In other words, by moving this investment out of state, Tesla is able to permit, construct, and begin operation in the same amount of time a similar facility planned in California would likely be only entering the scoping phase of its environmental impact report, while facing another 3-5 years and likely more of EIR completion, CEQA legal challenges—both actual and those threatened by various interest groups to negotiate agreements related to greater and lesser degree to the actual vehicle production—and completion of the multi-agency permitting process, each one requiring its own separate administrative and legal appeal procedures. As in other economic downturns, the state and now the Biden Administration hold out the promise of ‘green’ or ‘clean energy’ jobs as a path of jobs restoration and economic advancement. But even companies like Tesla that came into being and were sustained in its formative years almost solely by the state’s regulations need to compete on the world stage. If they cannot scale up production to compete with an industry now largely concentrated in low cost and coal-fueled China, they cannot survive. California remains competitive—although at a diminishing rate as these companies expand and create tech hubs in other states—for the design component of this sector. In some cases, California can also attain those green jobs it is willing to pay through high subsidies—both direct from state funds and indirect as the costs are instead shifted relentlessly onto households through regulation—but those jobs will remain only so long as the subsidies to overcome the state’s high costs remain in place. With the state’s growing regulatory, tax, and cost of living burdens causing businesses and skilled workers to leave the state, this approach is unlikely to succeed any better than it did as a centerpiece of the $830 billion American Recovery & Reinvestment Act of 2009 (ARRA) during the Great Recession or the state’s repeated efforts to drive it over the past two decades.
Employment: 1.497 Million Below Recovery
EDD reported that employment (seasonally adjusted; December preliminary) dropped 97,700 from the revised November numbers, while the number of unemployed grew 163,700. The reported unemployment rate rose 0.9 point to 9.0%. The unadjusted rate was 5.1 points worse than the year earlier at 8.8%.
California’s situation grew worse relative to the rest of the states, rising to the 3rd highest unemployment rate.
Total US employment was largely unchanged with a seasonally adjusted rise of 21,000. The number of unemployed also was essentially unchanged with a rise of only 8,000. The reported unemployment rate remained level at 6.7%.
Figure Sources: California Employment Development Department; US Bureau of Labor Statistics
Compared to the February 2020 numbers (seasonally adjusted) just prior to the current crisis and not accounting for population changes, the employment shortfall in California grew to 1.497 million.
Labor Force Participation Rate Up at 60.6%
California’s seasonally adjusted labor force participation rate rose 0.2 point to 60.6%. Nationally, the participation rate was unchanged at 61.5%.
For the 12 months ending December 2020, the seasonally adjusted data shows the California labor force was down 555,600 workers (-2.8% loss) compared to the rest of the US loss of 3,325,400 (-2.3%).
Employment Growth Ranking
The total number of persons employed (seasonally adjusted) over the 12 months ending in December was down 1,469,000. California had the lowest level among the states in terms of absolute employment loss over the year.
Adjusted to account for differences in the size of each state economy, California over the year showed a 7.8% contraction, worse than the rest of the US with a loss of 5.3%. Ranked among the states, California remained at the 7th worst loss rate.
Figure Source: US Bureau of Labor Statistics
Nonfarm Jobs: 1.460 Million Below Recovery
The trend for Nonfarm jobs (seasonally adjusted) reversed with a loss of 52,200 (seasonally adjusted) in December, compared to the revised gains in November to 5,200 from the previously reported 57,100.
Nonfarm jobs were down 1,410,000 over the year. Adjusting for population, California loss rate notched down to 43rd among the states. The 12-month jobs loss rate was -8.0% compared to the rest of the US at -5.9%.
Figure Sources: California Employment Development
Department; US Bureau of Labor Statistics
Compared to the February 2020 numbers (seasonally adjusted) just prior to the current crisis and not accounting for population changes, nonfarm wage and salary jobs in California dropped to 1.460 million short of recovery.
Jobs Change by Industry
The unadjusted numbers that allow a more detailed look at industry shifts illustrate the continuing disparate effects of the state’s chosen but continuously shifting pandemic strategies. Comparing over a 12-month period, 5 industries in fact show expansions in spite of the weakening in the overall numbers. All others continue to post job losses. Industries showing the greatest contractions over the year were led by Food Services, Government, Retail Trade, and Other Services.
| Not Seasonally Adjusted Payroll Jobs (1,000) | December 2020 | 12-month change | Nonfarm Growth Rank | % 12-month Change | Avg. Annual Wage |
|---|---|---|---|---|---|
| Total Farm | 320.0 | -48.7 | -13.2% | $37.4k | |
| Mining & Logging | 21.0 | -1.4 | 6 | -6.3% | $111.7k |
| Construction | 879.1 | 1.8 | 3 | 0.2% | $74.1k |
| Manufacturing | 1,218.5 | -99.0 | 16 | -7.5% | $101.0k |
| Wholesale Trade | 660.9 | -31.7 | 9 | -4.6% | $82.4k |
| Retail Trade | 1,618.7 | -113.5 | 18 | -6.6% | $39.5k |
| Utilities | 57.1 | 0.1 | 4 | 0.2% | $142.5k |
| Transportation & Warehousing | 684.2 | 0.1 | 4 | 0.0% | $61.6k |
| Information | 530.9 | -45.0 | 12 | -7.8% | $199.8k |
| Finance & Insurance | 555.9 | 11.0 | 1 | 2.0% | $140.1k |
| Real Estate & Rental & Leasing | 298.6 | -7.0 | 7 | -2.3% | $74.8k |
| Professional, Scientific & Technical Services | 1,356.8 | 2.7 | 2 | 0.2% | $131.2k |
| Management of Companies & Enterprises | 240.9 | -15.8 | 8 | -6.2% | $138.9k |
| Administrative & Support & Waste Services | 1,098.0 | -54.6 | 13 | -4.7% | $49.7k |
| Educational Services | 337.9 | -60.2 | 14 | -15.1% | $58.6k |
| Health Care | 1,571.5 | -35.3 | 10 | -1.4% | $71.3k |
| Social Assistance | 814.8 | -39.5 | 11 | -4.6% | $22.1k |
| Arts, Entertainment & Recreation | 216.6 | -110.6 | 17 | -33.8% | $66.2k |
| Accommodation | 146.1 | -93.3 | 15 | -39.0% | $41.3k |
| Food Services | 1,070.4 | -405.6 | 21 | -27.5% | $24.5k |
| Other Services | 460.4 | -117.7 | 19 | -20.4% | $44.0k |
| Government | 2,459.0 | -200.0 | 20 | -7.5% | $74.8k |
| Total Nonfarm | 16,297.3 | -1,414.5 | -8.0% | ||
| Total Wage & Salary | 16,617.3 | -1,463.2 | -8.1% | ||
Figure Source: California Employment Development Department;
Wages based on most recent Quarterly Census of Employment & Wages
Unemployment Rates by Region (not seasonally adjusted)
Unemployment rates continued to reflect the regional mix of jobs that have been retained through telework compared to relative shares of lower wage services and tourism jobs that have been hit the hardest by the state-ordered closures and other restrictions.
| wdt_ID | Region | Unemployment Rates |
|---|---|---|
| 2 | California | 8.8 |
| 6 | Bay Area | 6.8 |
| 10 | Orange County | 7.4 |
| 14 | Sacramento | 7.8 |
| 18 | San Diego/Imperial | 8.4 |
| 22 | Central Sierra | 8.5 |
| 26 | Upstate California | 8.8 |
| 30 | Inland Empire | 9.1 |
| 34 | Central Coast | 9.2 |
| 38 | Los Angeles | 10.3 |
| 39 | Central Valley | 10.8 |
Figure Source: California Employment Development Department
Unemployment Rates by Legislative District (not seasonally adjusted)
Lowest
| wdt_ID | Congressional District | Unemployment Rate |
|---|---|---|
| 2 | CD18 (Eshoo-D) | 5.0 |
| 3 | CD17 (Khanna-D) | 5.8 |
| 4 | CD49 (Levin-D) | 6.2 |
| 5 | CD52 (Peters-D) | 6.4 |
| 6 | CD02 (Huffman-D) | 6.5 |
| 7 | CD12 (Pelosi-D) | 6.1 |
| 9 | CD15 (Swalwell-D) | 6.5 |
| 10 | CD14 (Speier-D) | 6.5 |
| 12 | CD48 (Rouda-D) | 6.8 |
| 13 | CD19 (Lofgren-D) | 6.9 |
| wdt_ID | Senate District | Unemployment Rate |
|---|---|---|
| 2 | SD13 (Becker-D) | 5.3 |
| 3 | SD15 (Cortese-D) | 6.4 |
| 4 | SD36 (Bates-R) | 6.4 |
| 5 | SD10 (Wieckowski-D) | 6.5 |
| 6 | SD39 (Atkins-D) | 6.6 |
| 7 | SD01 (Dahle-R) | 6.8 |
| 8 | SD11 (Wiener-D) | 6.6 |
| 9 | SD02 (McGuire-D) | 6.8 |
| 10 | SD37 (Min-D) | 6.9 |
| 11 | SD07 (Glazer-D) | 7.2 |
| wdt_ID | Assembly District | Unemployment Rate |
|---|---|---|
| 2 | AD28 (Low-D) | 5.1 |
| 3 | AD16 (Bauer-Kahan-D) | 5.2 |
| 4 | AD22 (Mullin-D) | 5.3 |
| 5 | AD24 (Berman-D) | 5.2 |
| 6 | AD78 (Ward-D) | 6.2 |
| 7 | AD10 (Levine-D) | 6.0 |
| 8 | AD25 (Lee-D) | 5.8 |
| 9 | AD06 (Kiley-R) | 5.8 |
| 10 | AD73 (Davies-R) | 6.3 |
| 11 | AD17 (Chiu-D) | 6.3 |
Highest
| wdt_ID | Congressional District | Unemployment Rate |
|---|---|---|
| 2 | CD37 (Bass-D) | 10.7 |
| 3 | CD08 (Cook-R) | 11.0 |
| 4 | CD43 (Waters-D) | 11.3 |
| 5 | CD16 (Costa-D) | 12.1 |
| 6 | CD34 (Gomez-D) | 11.5 |
| 7 | CD29 (Cardenas-D) | 11.2 |
| 9 | CD40 (Roybal-Allard-D) | 12.6 |
| 10 | CD21 (Cox-D) | 12.9 |
| 12 | CD51 (Vargas-D) | 13.7 |
| 13 | CD44 (Barragan-D) | 14.1 |
| wdt_ID | Senate District | Unemployment Rate |
|---|---|---|
| 2 | SD05 (Talamantes Eggman-D) | 10.2 |
| 3 | SD12 (Caballero-D) | 11.1 |
| 4 | SD18 (Hertzberg-D) | 11.2 |
| 5 | SD33 (Gonzalez-D) | 12.1 |
| 6 | SD24 (Durazo-D) | 11.8 |
| 7 | SD21 (Wilk-R) | 11.8 |
| 9 | SD30 (vacant) | 12.1 |
| 10 | SD35 (Bradford-D) | 12.3 |
| 12 | SD40 (Hueso-D) | 12.4 |
| 13 | SD14 (Hurtado-D) | 14.0 |
| wdt_ID | Assembly District | Unemployment Rate |
|---|---|---|
| 2 | AD80 (Gonzalez-D) | 12.1 |
| 3 | AD31 (Arambula-D) | 12.3 |
| 4 | AD46 (Nazarian-D) | 12.4 |
| 5 | AD63 (Rendon-D) | 13.1 |
| 6 | AD56 (Garcia-D) | 13.0 |
| 7 | AD36 (Lackey-R) | 12.8 |
| 9 | AD32 (Salas-D) | 13.4 |
| 10 | AD51 (Carrillo-D) | 13.4 |
| 12 | AD64 (Gipson-D) | 13.6 |
| 13 | AD59 (Jones-Sawyer-D) | 14.0 |
How Far Back Has the Economy in Each County Been Pushed?
As an indication of the severity of the current economic downturn, the following chart illustrates how much economic ground each county has lost using employment levels as the measure. Based on annual averages, the chart below indicates the last year each county saw the December employment numbers. Because the current series only goes back to 1990 for most counties, several of the entries indicate “Before 1990.” Los Angeles County is the exception, with data going back to 1976. The “Change” column indicates the change from April, the month reflecting the effects of the initial round of closures.
Download Full Table</compare-button mt-3>
| wdt_ID | County | Last Year Employment Equal To or Less Than April | Last Year Employment Equal to or Less Than December | Change |
|---|---|---|---|---|
| 2 | Alameda County | 2009 | 2013 | 4 |
| 3 | Alpine County | 2009 | 2018 | 9 |
| 4 | Amador County | 1997 | 2013 | 16 |
| 5 | Butte County | 1998 | 1999 | 1 |
| 6 | Calaveras County | 2012 | 2014 | 2 |
| 7 | Colusa County | 1999 | 2003 | 4 |
| 8 | Contra Costa County | 1997 | 2013 | 16 |
| 9 | Del Norte County | 1992 | 1993 | 1 |
| 10 | El Dorado County | 1999 | 2016 | 17 |
| 11 | Fresno County | 2012 | 2015 | 3 |
| County | Last Year Employment Equal To or Less Than April | Last Year Employment Equal to or Less Than December | Change |
MSAs with the Worst Unemployment Rates: Los Angeles Rises to 15th Worst in Nation
California had 6 MSAs among the 25 regions with the worst unemployment rates in November. As a result of a pattern of jobs growth in recent years that concentrated on the hardest-hit lower wage, population-serving and tourism service industries in Los Angeles County, Los Angeles-Long Beach-Anaheim MSA (Los Angeles and Orange Counties) had the 15th worst in the nation.
| wdt_ID | MSA | November Unemployment Rate | US Rank out of 389 |
|---|---|---|---|
| 1 | El Centro MSA | 16.4 | 389 |
| 2 | Visalia-Porterville MSA | 9.8 | 376 |
| 3 | Los Angeles-Long Beach-Anaheim MSA | 9.6 | 374 |
| 4 | Bakersfield MSA | 9.4 | 371 |
| 5 | Merced MSA | 9.0 | 364 |
| 6 | Stockton-Lodi MSA | 9.0 | 364 |
Data Notes
This month begins the annual revision process for the labor force and establishment data series. The US labor force numbers reflect revisions in the seasonally adjusted series beginning in 2016. Upcoming revisions: (1) March 12—revised industry employment, hours, and earnings 1990-2020; revised labor force for California and Los Angeles Metro Division 1990-2020; revised labor force for counties 2020; (2) March 26—revised labor force for counties 2010-2019. While monthly reports will reflect the most recent data as it is reported, our historical estimates for the legislative districts will be revised based on the 2019 American Community Survey factors following the March 26th release. Comparisons between geographic levels should take note of these differences during the revision period.

