The Center for Jobs and the Economy has released our initial analysis of the December Employment Report from the California Employment Development Department.
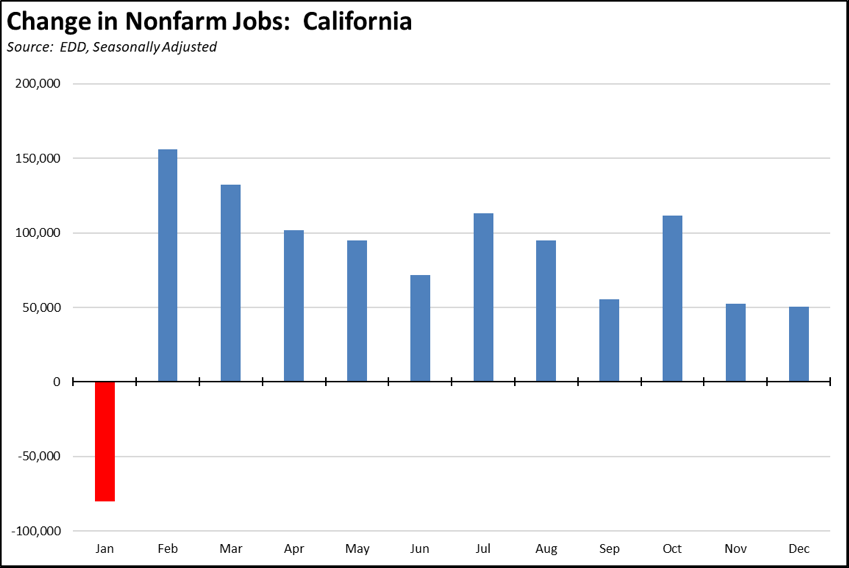
The December job and employment numbers were mixed. Nonfarm jobs (seasonally adjusted) were up 50,700, the lowest monthly total in 2021 since the loss posted at the beginning in January. California’s performance was essentially the same as Texas (50,000) and New York (45,300). The underlying unadjusted number showed a weaker rise of 32,400, although this number was somewhat higher than comparable periods in 2018 and 2019.
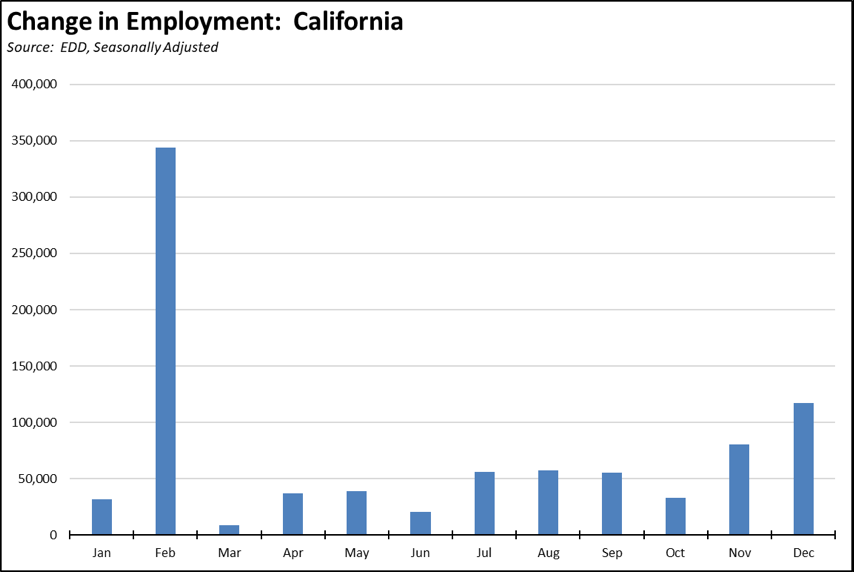
The employment numbers were better, showing a seasonally adjusted increase of 116,900. The unadjusted numbers showed a loss of 32,900, still somewhat better performance than the same period in 2018 and 2019.
Full performance over the year indicates a general slowing in the recovery progress. For nonfarm jobs, the strong job numbers in February essentially replaced the second round of losses in January and the previous December. Subsequent progress was dampened by an extended easing of the previous county tier system, followed by an initial upsurge as the state officially “reopened” in June.
The employment numbers have been more consistently positive as workers have turned to self-employment even in the face of AB 5 and starting their own businesses. The two series, however, continue to show a strong disconnect due to continued efforts to adjust the seasonal adjustment formulas to conditions overwhelmed by pandemic factors. The upcoming annual revisions in March will provide more clarity in the numbers overall.
California’s adjusted unemployment rate improved 0.5 point to 6.5%, the strongest improvement since February. Improvement in the rate, however, came from movement within the labor force numbers from unemployed to employed. The labor force movement improved somewhat over the lackluster numbers in the prior two months, but still showed only a 1.9% increase on an annualized basis.
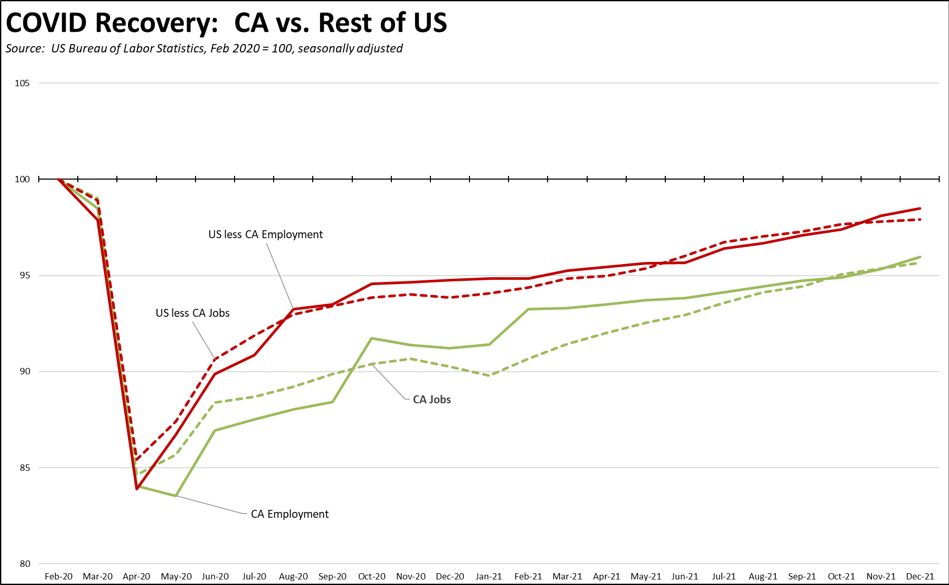
California’s overall recovery remains below the rest of the states, although the December numbers show some closure in the jobs progress. Note that the chart below reflects revisions in the 2021 job numbers and 2017-2021 employment numbers for the US. The revised California numbers will be available in March.
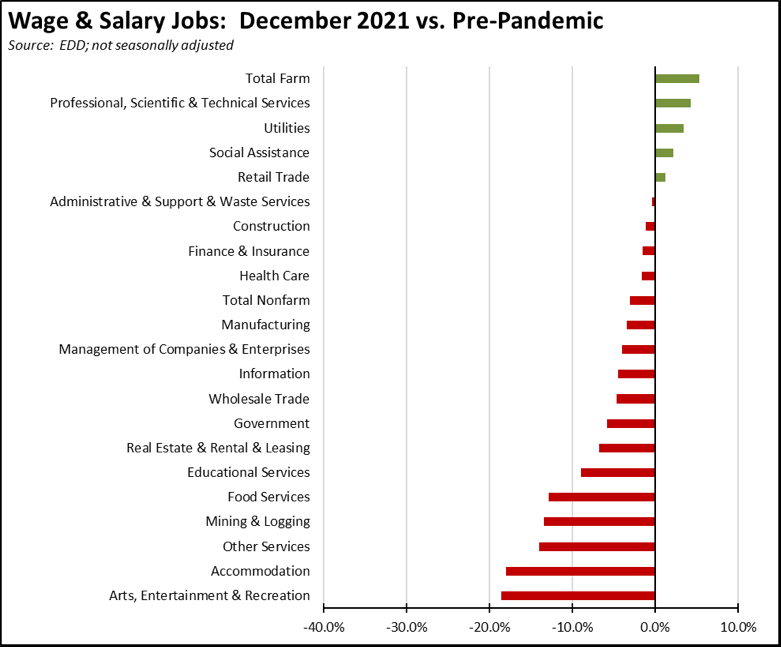
Most parts of the state’s economy remain in the recovery stage. Efforts to resolve the current supply chain disruptions continue to boost strong gains in Transportation & Warehousing, while Professional, Scientific & Professional Services continue their relatively stronger performance throughout the pandemic period. Lower wage employment in Arts, Entertainment & Recreation, Accommodation & Food Services, and Other Services continue to lead the lag, while much higher wage Mining & Logging reflects increasing state policy pressures to shrink these industries in the state.
CA Unemployment Rate
Rate
California’s reported unemployment rate (seasonally adjusted) in December improved 0.5 point to 6.5%, the best since March 2020 (4.5%) at the beginnings of the pandemic.
The December numbers show the number of unemployed down by 86,800. Employment rose 116,900. As a result, the labor force showed only a minor rise of 30,200, again reflecting continuing labor shortages.
US Unemployment Rate
Rate
The reported national numbers show US unemployment rate (seasonally adjusted) improving 0.3 point to 3.9%, just 0.4 point above the revised February 2020 level at the beginnings of the pandemic. Employment was up 651,000, while unemployment dropped 483,000. The labor force also showed only minor improvement, up 168,000.
Nonfarm Jobs
Change
Nonfarm wage and salary jobs rose 50,700 (seasonally adjusted) in December, while the gains in November were revised up 6,500 to 52,200.
Nonfarm jobs nationally were up 199,000.
As of the December numbers, California has regained 72% of the nonfarm jobs lost to the state shutdowns. The rest of the states combined regained 86% of the jobs lost in the pandemic period.
California job increases were led by Accommodation & Food Services (12,000), Professional, Scientific & Technical Services (8,900), and Transportation, Warehousing & Utilities (7,200). Losses were in Retail Trade (-7,300) and Management of Companies & Enterprises (-100).
Job Openings
the end of September
From the new Bureau of Labor Statistics Job Openings & Labor Turnover Survey (JOLTS) estimates by state, the number of unfilled job openings were down only 40,000 to 1.118 million, the highest of any state.
The number of workers quiting jobs rose slightly to 415,000, a level that still remains elevated and indicates that workers are able to do so while seeking high wages and/or better benefits in their jobs. Hirings improved as well, continuing a 7-month rise to 709,000.
Counties with Double-Digit Unemployment
Unemployment
Above 10%
The number of counties with an unemployment rate at 10% or more remained at to 2. The unadjusted rates ranged from 2.7% in Marin to 14.7% in Imperial.
On an MSA basis in November, California had 10 of the 25 MSAs with the worst unemployment rates in the country, ranging from Los Angeles-Long Beach-Anaheim MSA at 6.4% (#367 out of 389) to El Centro MSA at 15.5% (worst in the country at #389).
The highest ranked California region was again San Jose-Sunnyvale-Santa Clara MSA at 3.2% (13-way tie for #160), meaning 152 urban areas in the country were performing better than those in California.