Highlights for policy makers:
Unemployment Rate Declines to 6.7%; Total Employment Climbs 48,000
The Labor Force data for February 2015 (seasonally adjusted; California preliminary) is shown below, along with the change from the prior month:
Seasonally Adjusted California US
Feb 2015 Change from Jan 2015 Feb 2015 Change from Jan 2015
Unemployment Rate 6.7 -0.3 5.5 -0.2
Labor Force 18,943,400 0.0% 157,002,000 -0.1%
Employment 17,668,300 0.3% 148,297,000 0.1%
Unemployment 1,275,100 -3.2% 8,705,000 -3.1%
Source: California Employment Development Department; US Bureau of Labor Statistics
The related not seasonally adjusted numbers (California preliminary), with the change from February 2014:
Seasonally Adjusted California US
Feb 2015 Change from Feb 2014 Feb 2015 Change from Feb 2014
Unemployment Rate 6.8 -1.5 5.8 -1.2
Labor Force 18,910,200 0.9% 156,213,000 0.8%
Employment 17,618,700 2.6% 147,118,000 2.1%
Unemployment 1,291,500 -17.4% 9,095,000 -16.5%
Source: California Employment Development Department; US Bureau of Labor Statistics
California Employment Development Department’s (EDD) latest release shows on a seasonally adjusted basis, total employment grew by 48,000 in February, while the number of unemployed dropped by 42,200. California’s seasonally adjusted unemployment rate declined from 7.0% in January to 6.7% in February. The unadjusted rate decreased from 8.3% in February 2014 to 6.8% in February 2015.
By comparison, total US employment increased by 0.1% (seasonally adjusted increase of 96,000), while the number of unemployed dropped by 3.1% (seasonally adjusted decrease of 274,000).
On a seasonally adjusted basis, improvement to the unemployment rates for both the US and the state came as more unemployed found jobs, rather than drawing more workers back into the labor force. The labor force in each case remained essentially unchanged.
Note that all these numbers continue to be affected by EDD’s ongoing revisions to the data as part of their annual benchmarking process. Rebenching of the labor force data is producing revisions in the data through 1976.
Nonfarm Jobs Increase 29,400
EDD reported that between January and February 2015, seasonally adjusted nonfarm payroll jobs increased by 29,400. Not seasonally adjusted, nonfarm payroll jobs increased by 106,600.
Looking at the seasonally adjusted numbers, the change in nonfarm payroll jobs saw the largest increases in Accommodation & Food Services (13,200), Construction (11,200), Professional, Scientific & Technical Services (8,900), and Wholesale Trade (7,100). Biggest declines were in Government (-8,400), Information (-5,000), Transportation, Warehousing & Utilities (-2,600), and Finance & Insurance (-2,100).
Feb 2015 Jan 2015 Change Feb 2015–Jan 2015
Total Farm 418,200 410,200 8000
Mining & Logging 30,800 30,600 200
Construction 708,300 697,100 11,200
Manufacturing 1,271,000 1,266,800 4,200
Wholesale Trade 733,200 726,100 7,100
Retail Trade 1,650,500 1,652,200 -1,700
Transportation, Warehousing and Utilities 534,700 537,300 -2,600
Information 470,400 475,400 -5000
Finance and Insurance 522,900 525,000 -2,100
Real Estate and Rental and Leasing 275,200 271,900 3,300
Professional, Scientific & Technical Services 1,232,300 1,223,400 8,900
Management of Companies and Enterprises 229,100 229,300 -200
Administrative & Support & Waste Services 1,044,100 1,043,600 500
Educational Services 363,400 364,200 -800
Health Care and Social Assistance 2,094,700 2,091,800 2,900
Arts, Entertainment, and Recreation 278,600 279,200 -600
Accommodation and Food Service 1,530,900 1,517,700 13,200
Other Services 548,600 549,300 -700
Government 2,430,500 2,438,900 -8,400
Total Nonfarm 15,949,200 15,919,800 29,400
Total Wage & Salary 16,367,400 16,330,000 37,400
Source: California Employment Development Department, Seasonally Adjusted
One in Five Remain Employed in Part Time Work
The percentage of part time workers in February remained unchanged for California at 20.3% of total employment, with a slight decline to 6.8 % working part time for economic reasons (primarily the lack of full time jobs).
Feb 2015 Jan 2015 Feb 2015 Jan 2015
Total Part Time Employed 20.3 20.3 18.2 18.2
Part Time Employed for Economic Reasons 6.8 6.9 4.8 4.9
Source: California Employment Development Department; US Bureau of Labor Statistics, 12-month moving average
7 Industries Remain Below 2007 Pre-Recession Job Levels
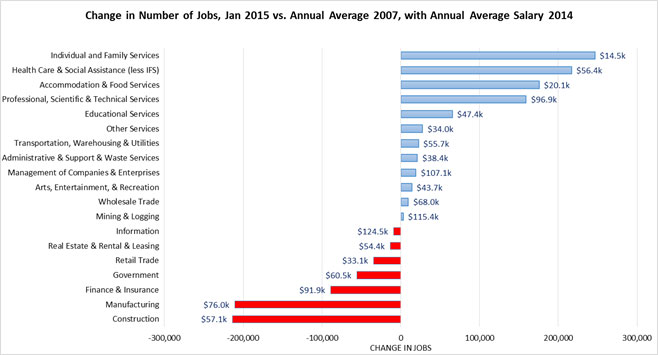
Source: US Bureau of Labor Statistics, Wage & Salary Jobs (not seasonally adjusted), Average Annual Wage (Q2 2014)
While the full data revisions are still being completed by EDD, US Bureau of Labor Statistics (BLS) has released the revised industry employment data through January 2015. The current benchmark revision incorporates both data adjustments and some methodology changes. In general, the revisions affected the California numbers by lowering prior jobs estimates for years before 2011, and increasing the jobs estimates for the years following, with the highest revisions in 2013 (2.9% increase in March 2013 numbers) and 2014 (1.4% increase in December 2014 numbers).
The February 2015 job numbers will be released by BLS on March 27. The chart above instead shows the newly revised January 2015 numbers compared to the 2007 average. As indicated, 7 industries continue to be below the 2007 pre-recession levels and the remaining are above.
The revised numbers reinforce the pattern of two-tier job recovery in the state. The leading 4 growth industries include the 2 lowest wage industries (Individual & Family Services and Accommodation & Food Services), but also include a net growth of 159,000 jobs in the fourth highest wage industry—Professional, Scientific & Technical Services which has led the economic expansion in some of the state’s coastal areas. Individual & Family Services—the industry containing state-funded In-Home Supportive Services (IHSS) jobs—previously ranked as the second highest growth industry under the 2013 benchmark data, but now ranks as the highest under the new 2014 benchmark data.
The lagging industries remain dominated by middle-class wage industries, including Construction, Manufacturing, and Government. However, the lagging industries also include the higher wage Finance & Insurance, an industry that remains in recovery from the housing-bust but also an industry that continues to locate middle-class wage back office operations in other states with lower costs and regulations that better accommodate worker preferences and employer operating needs, including flexible work weeks.
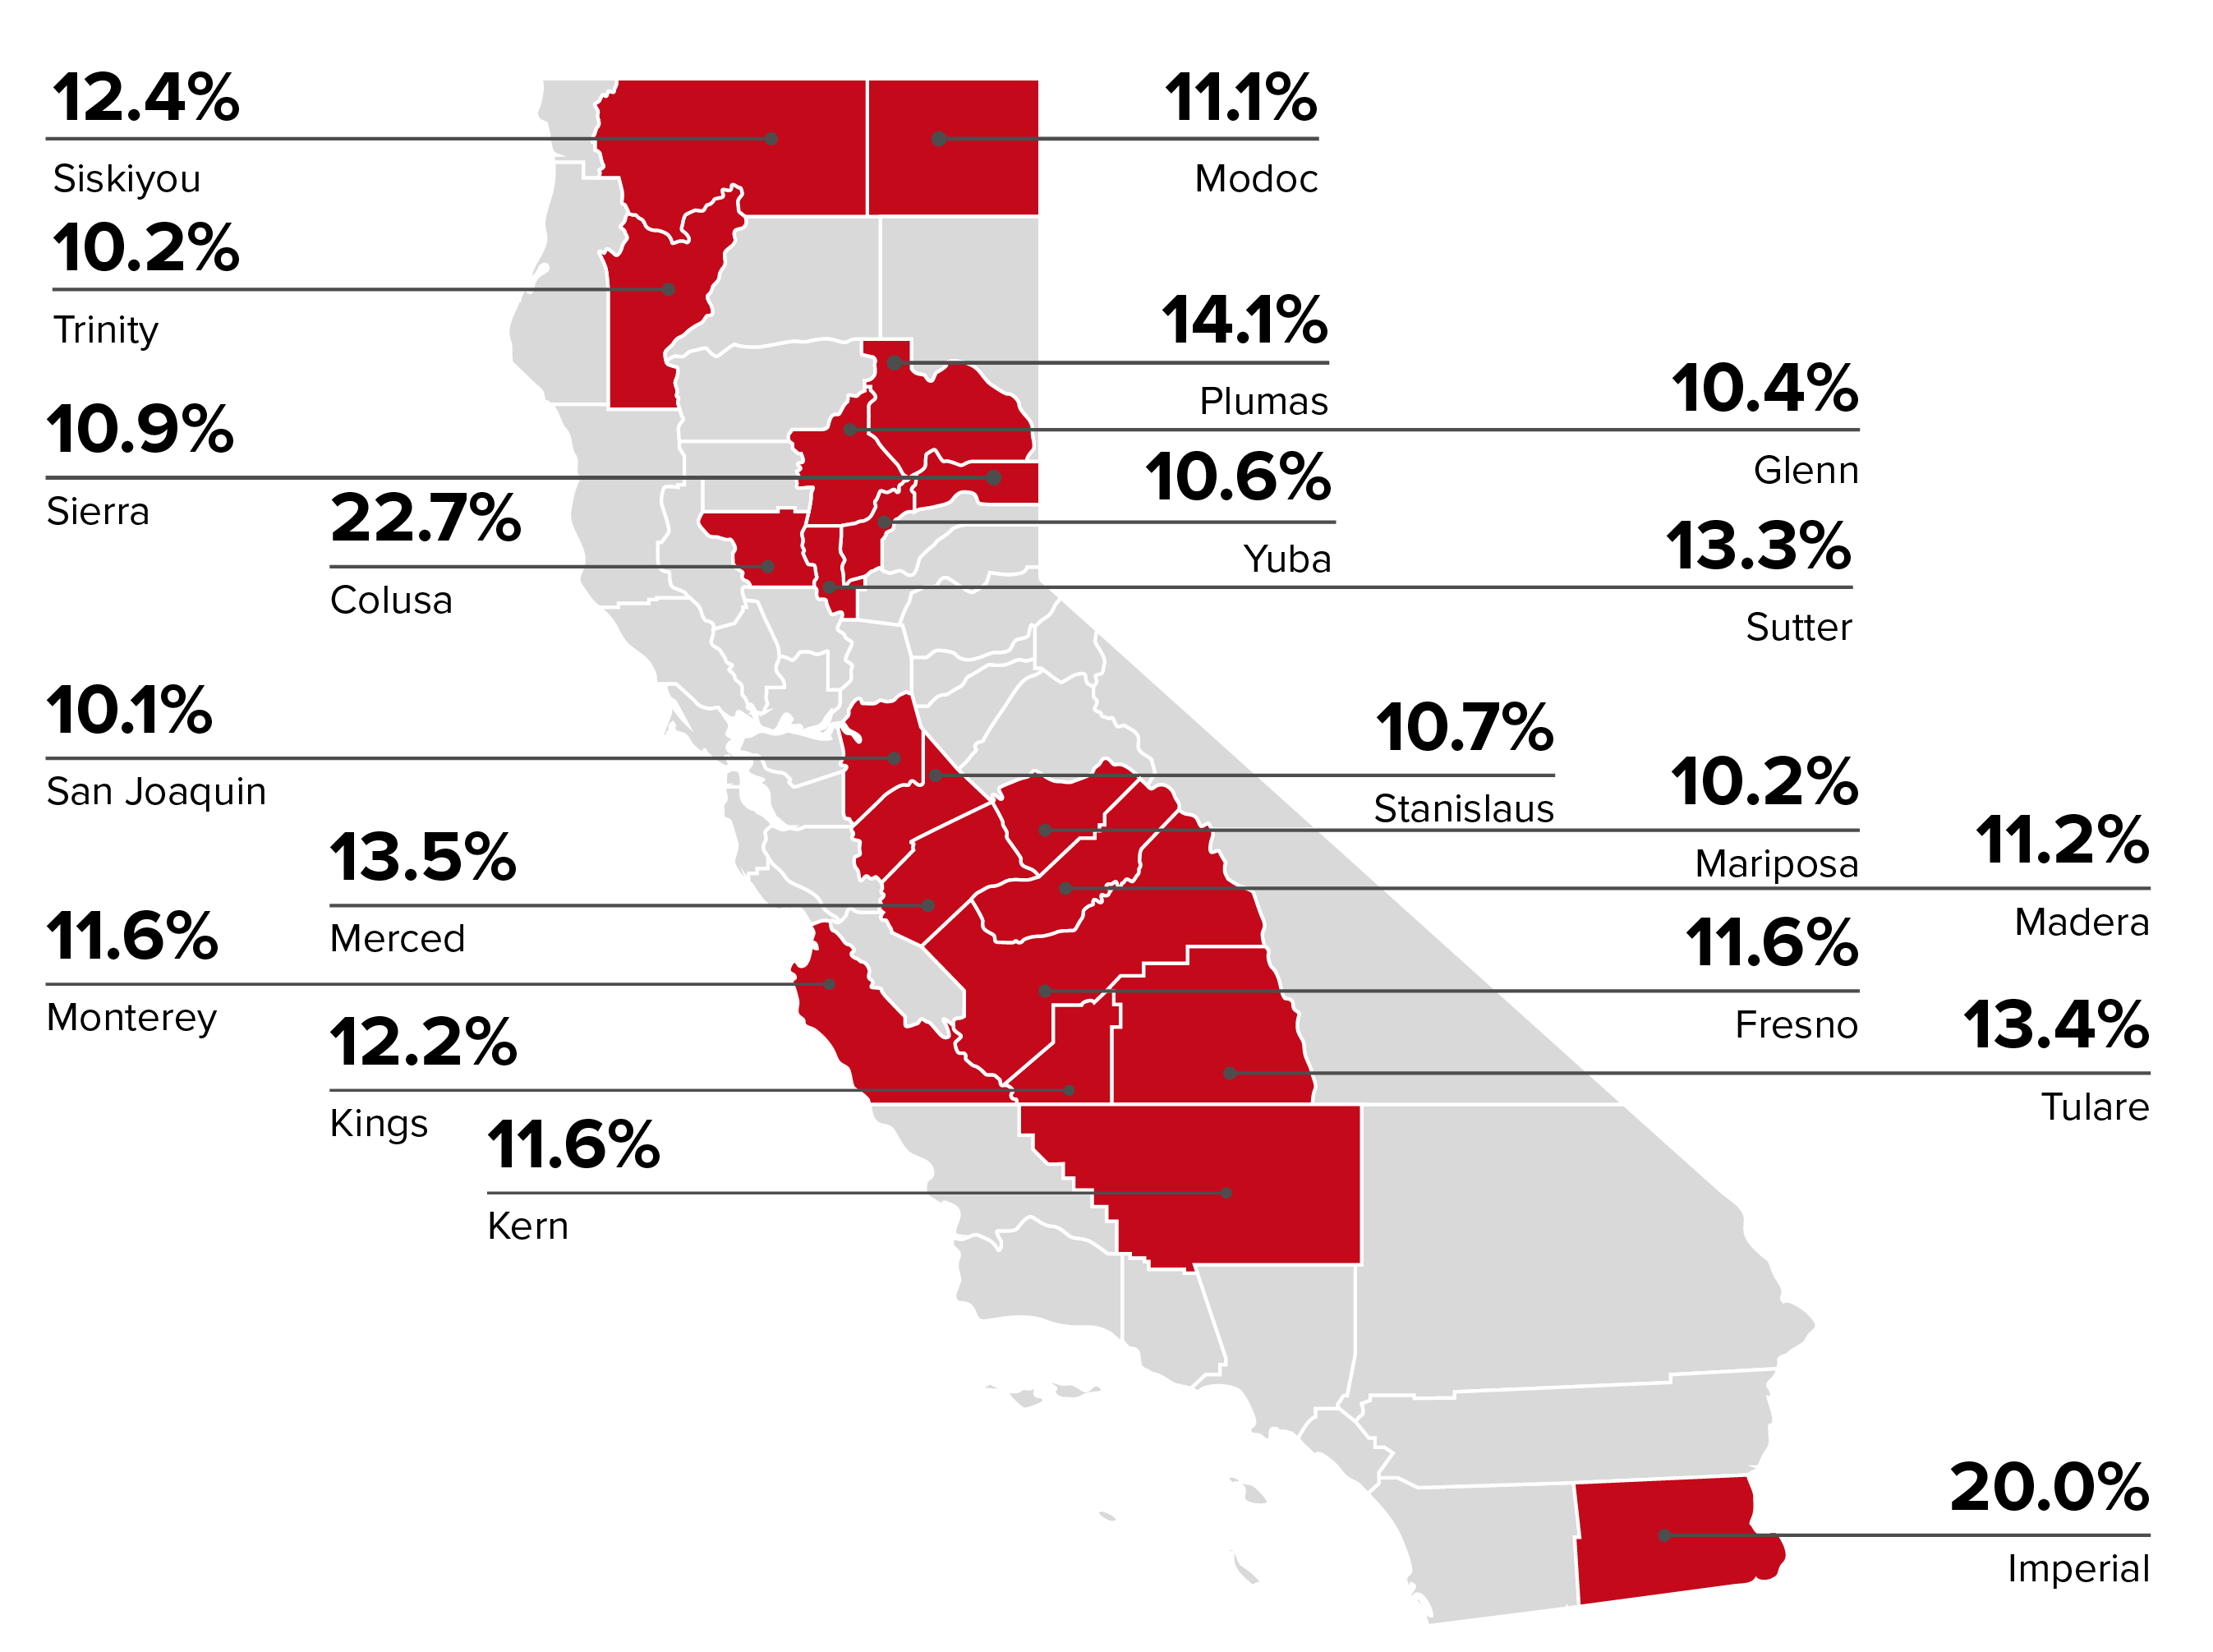
20 Counties Remain in Double-Digit Unemployment, Up from a Revised 22 in January
Wage Growth in Q3 2014
BLS has released the Quarterly Census of Employment and Wages (QCEW) for the third quarter of 2014. On an equivalent annual basis, average wages—data that incorporates both hours worked and hourly wage—increased in all but 4 counties for Private wage and salary workers. Increases occurred in all but 7 counties for Government workers.
Counties with the highest Private wages were led by Santa Clara County ($107,536), San Mateo County ($97,396), and San Francisco County ($86,996). The lowest were Trinity County ($25,220), Mariposa County ($27,404), and a tie between Del Norte and Imperial Counties ($28,080 each).
Overall, wages increased 3.8% between Q3 2013 and Q3 2014 for Private workers in California, and 3.5% for Government workers.
Average Annual Wages, 2013 & 2014
Q3 2014 Q3 2013 Change 2013-2014 (%)
Private Government Private GovernmentPrivate Government
California $55,952 $63,069 $53,924 $60,9593.8 3.5
Alameda County 63,544 73,067 60,892 70,6944.4 3.4
Alpine County 65,468 50,186 61,724 49,0056.1 2.4
Amador County 34,944 50,672 33,748 50,4503.5 0.4
Butte County 34,788 44,657 34,008 43,9542.3 1.6
Calaveras County 29,588 55,921 29,536 54,0700.2 3.4
Colusa County 36,660 44,081 35,412 42,3763.5 4.0
Contra Costa County 59,228 60,496 58,032 58,8742.1 2.8
Del Norte County 28,080 42,342 27,300 41,6292.9 1.7
El Dorado County 39,988 53,030 40,040 51,753-0.1 2.5
Fresno County 36,192 52,454 35,152 51,0873.0 2.7
Glenn County 33,852 42,249 32,864 41,0323.0 3.0
Humboldt County 33,800 43,076 33,540 42,4800.8 1.4
Imperial County 28,080 56,215 28,652 55,198-2.0 1.8
Inyo County 33,228 49,300 29,744 49,77811.7 -1.0
Kern County 39,364 58,502 38,116 55,0693.3 6.2
Kings County 35,204 46,301 34,320 44,7732.6 3.4
Lake County 31,044 40,788 30,264 40,0122.6 1.9
Lassen County 32,448 52,406 29,796 48,8278.9 7.3
Los Angeles County 52,000 67,236 50,700 63,3402.6 6.2
Madera County 34,008 47,989 33,176 48,4792.5 -1.0
Marin County 56,628 69,770 54,964 64,4073.0 8.3
Mariposa County 27,404 48,781 26,468 44,8523.5 8.8
Mendocino County 32,396 45,008 32,084 43,1111.0 4.4
Merced County 34,060 47,688 32,708 47,8284.1 -0.3
Modoc County 30,368 46,501 28,392 44,6897.0 4.1
Mono County 28,548 55,010 27,352 56,9334.4 -3.4
Monterey County 37,752 63,287 37,544 61,1520.6 3.5
Napa County 45,240 57,776 44,304 54,0412.1 6.9
Nevada County 37,752 55,498 37,700 53,2180.1 4.3
Orange County 53,924 61,799 52,364 62,0293.0 -0.4
Placer County 47,684 57,137 46,332 55,1362.9 3.6
Plumas County 33,644 46,909 34,060 45,515-1.2 3.1
Riverside County 36,608 50,913 35,776 48,9112.3 4.1
Sacramento County 47,944 71,278 47,372 68,8081.2 3.6
San Bernardino County 38,948 52,881 38,116 50,3912.2 4.9
San Benito County 36,660 55,668 35,204 53,0254.1 5.0
San Diego County 51,324 65,563 51,272 62,6990.1 4.6
San Francisco County 86,996 91,290 79,456 87,6079.5 4.2
San Joaquin County 38,844 56,453 38,376 55,3951.2 1.9
San Luis Obispo County 38,480 52,565 37,596 52,5362.4 0.1
San Mateo County 97,396 64,239 90,792 62,1567.3 3.4
Santa Barbara County 44,772 57,642 43,680 56,3992.5 2.2
Santa Clara County 107,536 70,042 99,528 67,1678.0 4.3
Santa Cruz County 41,444 54,703 43,264 52,802-4.2 3.6
Shasta County 35,568 52,121 35,100 48,1201.3 8.3
Sierra County 38,064 43,259 33,696 41,94813.0 3.1
Siskiyou County 32,760 49,936 32,136 45,6961.9 9.3
Solano County 48,464 56,301 46,592 53,0804.0 6.1
Sonoma County 45,656 52,977 44,512 53,3662.6 -0.7
Stanislaus County 39,988 51,903 39,104 51,2852.3 1.2
Sutter County 35,620 51,480 33,748 48,7435.5 5.6
Tehama County 36,920 41,572 35,828 40,4003.0 2.9
Trinity County 25,220 50,788 24,180 47,9334.3 6.0
Tulare County 31,720 46,773 30,628 44,9533.6 4.0
Tuolumne County 34,892 45,400 34,112 46,0592.3 -1.4
Ventura County 47,424 61,461 46,592 59,2291.8 3.8
Yolo County 43,160 65,044 42,900 58,6290.6 10.9
Yuba County 39,884 50,104 38,428 47,5973.8 5.3
Source: US Bureau of Labor Statistics, Quarterly Census of Employment & Wages
As with employment, the wage increase has been dominated by the Bay Area, which accounts for nearly half of the total wage increase in both periods.
Region Share of Total Wage Growth(%)
Q3 2013 – Q3 2014 Q3 2007 – Q3 2014
Bay Area47.3 49.3
Central Coast1.0 1.6
Central Sierra0.2 0.1
Central Valley4.9 5.5
Inland Empire6.1 2.4
Los Angeles20.5 17.8
Orange County6.7 5.4
Sacramento3.8 3.8
San Diego/Imperial4.0 7.6
Upstate California1.0 0.6
Unallocated4.5 6.0
Total100.0 100.0
Source: US Bureau of Labor Statistics, Quarterly Census of Employment & Wages; current dollars
By industry, Professional & Technical Services (15.5%) accounted for the largest share of wage growth in the most recent 12-month period, followed by Government (13.4%), Information (12.9%), and Manufacturing (11.2%). Two industries—Mining and Utilities—saw total wages drop in the 12-month period, while three—Construction, Finance and Insurance, and Other Services—have yet to recover to their pre-recession wage levels.
Industry Share of Total Wage Growth(%)
Q3 2013 – Q3 2014 Q3 2007 – Q3 2014
Agriculture, Forestry, Fishing and Hunting1.3 2.2
Mining, Quarrying, & Oil & Gas Extraction-0.1 0.7
Utilities-0.4 1.0
Construction5.2 -3.6
Manufacturing11.2 5.8
Wholesale Trade3.6 4.0
Retail Trade4.5 1.0
Transportation & Warehousing2.4 2.1
Information12.9 14.3
Finance & Insurance3.5 -0.8
Real Estate & Rental & Leasing1.7 1.1
Professional & Technical Services15.5 21.9
Management of Companies & Enterprises2.7 5.1
Administrative & Waste Services3.8 4.4
Educational Services1.4 3.6
Health Care & Social Assistance7.6 18.7
Arts, Entertainment & Recreation1.8 1.8
Accommodation & Food Services4.4 4.8
Other Services2.2 -0.2
Government13.4 11.8
Unallocated1.5 0.3
Total100.0 100.0
Source: US Bureau of Labor Statistics, Quarterly Census of Employment & Wages; current dollars
Two-Tier Economy Persists
Unemployment rates and employment (all data is not seasonally adjusted) continue to vary widely across the state, with the spread between the unemployment rates by region increasing slightly to 2.50.
Not Seasonally Adjusted Unemployment Rate (%) Feb 2015
California 6.8
Bay Area4.6
Orange County4.6
San Diego/Imperial6.1
Sacramento Region6.3
Inland Empire6.8
Central Sierra7.5
Los Angeles7.5
Central Coast9.2
Upsate California9.3
Central Valley11.4
Ratio of Highest to Lowest Rate2.50
By County:
Lowest 3 Unemployment Rates
San Mateo County 3.5
Marin County 3.7
San Francisco County 3.8
Highest 3 Unemployment Rates
Plumas County 14.1
Imperial County 20.0
Colusa County 22.7
Ratio of Highest to Lowest Rate: 6.49
By Legislative District:
Lowest 10 Unemployment Rates
SD 13 (Hill – D) 3.4 AD 22 (Mullin – D) 3.3
SD 11 (Leno – D) 3.8 AD 16 (Baker – R) 3.5
SD 37 (Moorlach – R) 3.9 AD 24 (Gordon – D) 3.5
SD 39 (Block – D) 4.4 AD 28 (Low – D) 3.6
SD 36 (Bates – R) 4.4 AD 77 (Maienschein – R) 3.8
SD 15 (Beall – D) 4.5 AD 19 (Ting – D) 3.8
SD 07 (DeSaulnier – D) 4.8 AD 17 (Chiu – D) 3.8
SD 10 (Wieckowski – D) 4.8 AD 74 (Harper – R) 3.9
SD 38 (Anderson – R) 5.2 AD 73 (Brough – R) 3.9
SD 29 (Huff – R) 5.2 AD 68 (Wagner – R) 3.9
Highest 10 Unemployment Rates
SD 30 (Mitchell – D) 8.7 AD 03 (Gallagher – R) 10.0
SD 33 (Lara – D) 8.9 AD 23 (Patterson – R) 10.0
SD 24 (de León – D) 9.0 AD 30 (Alejo – D) 10.4
SD 35 (Hall – D) 9.0 AD 13 (Eggman – D) 10.6
SD 40 (Hueso – D) 9.6 AD 64 (Gibson – D) 11.1
SD 08 (Berryhill – R) 9.7 AD 56 (Garcia – D) 12.8
SD 16 (Fuller – R) 9.8 AD 26 (Mathis – R) 13.0
SD 05 (Galgiani – D) 9.9 AD 21 (Gray – D) 13.3
SD 12 (Cannella – R) 12.4 AD 32 (Salas – D) 13.4
SD 14 (Vidak – R) 14.4 AD 31 (Perea – D) 13.5
Ratio of Highest to Lowest Rate: Senate 4.26
Ratio of Highest to Lowest Rate: Assembly 4.12
Data Revisions and Updates
EDD indicates their final data revisions will be provided along with the March labor force data on April 17.
Note: All data sources, methodologies, and historical data series available at CenterforJobs.org.