Highlights for policy makers:
- Unemployment Rate Drops to 5.0%; Total Employment Up 13,800
- Labor Force Participation Rate Eased to 62.1%
- State Employment Growth Rankings – California Drops to 2nd Place Behind Flordia
- Nonfarm Jobs Increase 22,900
- 6 Industries below 2007 Pre-Recession Job Levels
- Job Gains by Wage Level
- Two-Tier Economy Persists – Central Valley Unemployment Nearly 3 Times as High as Bay Area
- 6 California MSAs in the 10 Unemployment Rates Nationally
Unemployment Rate Drops to 5.0%; Total Employment Up 13,800
The Labor Force data for February 2017 (seasonally adjusted; California preliminary) is shown below, along with the change from the prior month:
| Seasonally Adjusted | California | US | ||
|---|---|---|---|---|
| Feb 2017 | Change from Jan 2017 | Feb 2017 | Change from Jan 2017 | |
| Unemployment Rate | 5.0 | -0.2 | 4.7 | -0.1 |
| Labor Force | 19,155,700 | 0.0% | 160,056,000 | 0.2% |
| Participation Rate | 62.1 | -0.1 | 63.0 | 0.1 |
| Employment | 18,189,700 | 0.1% | 152,528,000 | 0.3% |
| Unemployment | 965,900 | -2.2% | 7,528,000 | -1.4% |
The related not seasonally adjusted numbers (California preliminary), with the change from February 2016:
| Not Seasonally Adjusted | California | US | ||
|---|---|---|---|---|
| Feb 2017 | Change from Feb 2016 | Feb 2017 | Change from Feb 2016 | |
| Unemployment Rate | 5.2 | -0.6 | 4.9 | -0.3 |
| Labor Force | 19,120,600 | 0.4% | 159,482,000 | 0.8% |
| Participation Rate | 62.0 | -0.3 | 62.7 | 0.0 |
| Employment | 18,120,300 | 1.0% | 151,594,000 | 1.0% |
| Unemployment | 1,000,300 | -8.8% | 7,887,000 | -4.0% |
California Employment Development Department’s (EDD) latest release shows on a seasonally adjusted basis, total employment rose 13,800 from January, while the number of unemployed dropped by 22,000. The labor force remained substantially unchanged with a decline of 8,200.
California’s seasonally adjusted unemployment rate continued easing to 5.0% from January’s revised level of 5.2%. California tied with Florida and Pennsylvania for the 15th highest unemployment rate among the states. The unadjusted rate dropped from 5.9% in February 2016 to 5.2%.
Total US employment saw a seasonally adjusted increase of 447,000 from January, while the number of unemployed dropped by 107,000. The national unemployment rate eased 0.1 to 4.7%. The national labor force numbers continued expanding by 340,000, another indication that at least nationally, the economy still has room to grow to get to full employment.
Labor Force Participation Rate Level Eased to 62.1%
California’s participation rate (seasonally adjusted) eased to 62.1% in February, while the US rate rose marginally by 0.1 to 63.0%. The California participation rate still remains near the previous lows from 1976, and well below the average pre-recession level of 65.6% in 2007.
Compared to November 2016, growing business and consumer confidence has seen the national labor force grow by 600,000 and the participation rate by 0.4 percentage points as workers have been drawn back in. In California, the labor force has remained essentially unchanged (net gain of 9,000), while the rate has dropped 0.2 points.
State Employment Growth Rankings – California Drops to 2nd Place Behind Flordia
| Rank | Number of Employed | Percentage Change | Population Adjusted (employment growth per 1,000 civilian noninstitutional population) |
|---|---|---|---|
| 1 | FL285,200 | UT3.9% | UT25.7 |
| 2 | CA253,700 | KY3.3% | GA18.3 |
| 3 | TX213,500 | AZ3.2% | AZ18.1 |
| 4 | GA143,900 | GA3.1% | WA18.0 |
| 5 | NC104,400 | FL3.1% | KY18.0 |
| 6 | WA102,500 | WA3.0% | FL17.3 |
| 7 | AZ96,700 | OR2.8% | OR16.5 |
| 8 | MI83,600 | ME2.7% | ME16.0 |
| 9 | MA68,000 | ID2.6% | ID16.0 |
| 10 | VA67,000 | NV2.5% | CO14.9 |
| 11 | CO64,000 | HI2.4% | NV14.7 |
| 12 | KY62,100 | CO2.3% | HI14.6 |
| 13 | TN59,800 | NC2.3% | NC13.3 |
| 14 | UT56,000 | SC2.2% | SC12.6 |
| 15 | OR53,700 | TN2.0% | MA12.3 |
| 16 | MD51,600 | MA2.0% | DC12.2 |
| 17 | SC48,800 | MS1.9% | TN11.5 |
| 18 | NY34,000 | DC1.9% | MD10.9 |
| 19 | NV33,500 | MI1.8% | ND10.6 |
| 20 | NJ32,100 | MD1.7% | MI10.6 |
| 21 | WI31,300 | TX1.7% | TX10.3 |
| 22 | AL30,700 | VA1.7% | VA10.3 |
| 23 | CT24,200 | ND1.5% | MS10.1 |
| 24 | MS23,000 | AL1.5% | CT8.4 |
| 25 | PA21,900 | CA1.4% | CA8.3 |
| US1,485,000 | US1.0% | US5.8 |
Between February 2016 and February 2017, Bureau of Labor Statistics (BLS) data shows the total number of employed in California increased by 253,700 (seasonally adjusted), or 17.1% of the total net employment gains in this period for the US. In another sign of California’s slowing growth, for the first time since 2012, California dropped to 2nd place behind Florida (which has a civilian working age population only 55% as large as California’s) at 285,200. Measured by percentage change in employment over the year, California dropped to 25th highest. Adjusted for population, California also dropped to 25th.
Nonfarm Jobs Increase 22,900
EDD reported that between January and February 2017, seasonally adjusted nonfarm wage and salary jobs grew by 22,900. January’s gains were revised up to 15,300 from the previously reported gain of 9,700.
Industries in the table below have been modified somewhat from previous reports to allow tracking as business climate changes occur in the state, in particular potential federal and state budget shifts and the impact of individual policies such as last year’s minimum wage increase. In particular, Social Assistance—which contains roughly 80% IHSS workers funded by state/federal sources and about 10% child care which also relies heavily on state funding—is broken out separately. Accommodation and Food Services are also listed separately. Both industries are heavily affected by minimum wage changes, but Food Services is more sensitive to this policy and has been one of the dominant sources of jobs growth since the recession. Transportation & Warehousing—one of the state’s key blue collar, middle class wage industries—will be tracked to gauge responses to increasing costs through the state’s climate change regulations and recent rules shifts in the South Coast Air Quality Management District.
Looking at the not seasonally adjusted numbers, hiring saw increases in all but three industries over the year. The change in total payroll jobs from February 2016 saw the largest increases in Government (48,200), Health Care (40,300), and Food Services (39,400). Declines were in Manufacturing (-9,700), Mining & Logging (-3,000), and Utilities (-400).
| Not Seasonally Adjusted Payroll Jobs | Feb 2017 | Jan 2017 | Change Feb 2017- Jan 2017 | Change Feb 2017 – Feb 2016 |
|---|---|---|---|---|
| Total Farm | 367,900 | 361,500 | 6,400 | 7,500 |
| Mining and Logging | 22,100 | 22,300 | -200 | -3,000 |
| Construction | 767,000 | 747,000 | 20,000 | 18,700 |
| Manufacturing | 1,288,100 | 1,286,100 | 2,000 | -9,700 |
| Wholesale Trade | 735,000 | 730,000 | 5,000 | 18,700 |
| Retail Trade | 1,659,500 | 1,688,500 | -29,000 | 5,200 |
| Utilities | 58,300 | 58,400 | -100 | -400 |
| Transportation & Warehousing | 528,400 | 530,500 | -2,100 | 20,600 |
| Information | 528,300 | 516,900 | 11,400 | 11,500 |
| Finance & Insurance | 547,000 | 547,800 | -800 | 7,900 |
| Real Estate & Rental & Leasing | 279,700 | 279,600 | 100 | 6,900 |
| Professional, Scientific & Technical Services | 1,238,000 | 1,226,600 | 11,400 | 24,700 |
| Management of Companies & Enterprises | 227,500 | 226,900 | 600 | 2,800 |
| Administrative & Support & Waste Services | 1,074,800 | 1,069,600 | 5,200 | 5,000 |
| Educational Services | 380,500 | 353,900 | 26,600 | 16,900 |
| Health Care | 1,476,800 | 1,476,300 | 500 | 40,300 |
| Social Assistance | 744,700 | 739,100 | 5,600 | 28,600 |
| Arts, Entertainment & Recreation | 291,000 | 287,200 | 3,800 | 3,800 |
| Accommodation | 221,600 | 219,200 | 2,400 | 2,800 |
| Food services | 1,381,000 | 1,362,500 | 18,500 | 39,400 |
| Other services | 563,000 | 554,800 | 8,200 | 14,100 |
| Government | 2,561,200 | 2,537,900 | 23,300 | 48,200 |
| Total Nonfarm | 16,573,500 | 16,461,100 | 112,400 | 303,000 |
| Total Wage and Salary | 16,941,400 | 16,822,600 | 118,800 | 310,500 |
By total number of new jobs, California had the highest increase in seasonally adjusted nonfarm jobs among the states from February 2016 to February 2017, at 315,800 or 13.4% of the US net increase. By percentage growth in jobs, California was 13th highest, and by population adjusted jobs growth, 18th highest.
| Rank | Number of Jobs | Employment Growth (%) | Population Adjusted (job growth per 1,000 civilian noninstitutional population) |
|---|---|---|---|
| 1 | CA315,800 | ID3.6% | UT20.6 |
| 2 | FL248,800 | UT3.3% | ID19.0 |
| 3 | TX222,400 | NV3.2% | NV17.7 |
| 4 | NY135,200 | FL3.0% | WA15.2 |
| 5 | GA114,000 | WA2.7% | FL 14.8 |
| 6 | WA87,900 | GA2.6% | GA14.3 |
| 7 | MI82,600 | MT2.4% | MT13.6 |
| 8 | NC76,800 | TN2.2% | TN12.6 |
| 9 | PA74,000 | OR2.2% | MD12.2 |
| 10 | NJ73,700 | AZ2.2% | OR12.0 |
| 11 | TN66,100 | TN2.1% | TN11.5 |
| 12 | AZ58,200 | CO1.9% | MO11.3 |
| 13 | MD57,800 | CA1.9% | CA10.7 |
| 14 | MA57,700 | MI1.9% | TX10.5 |
| 15 | MO54,000 | MO1.9% | MI10.4 |
| 16 | VA53,500 | TX1.9% | MA10.4 |
| 17 | CO50,300 | NJ1.8% | NJ10.4 |
| 18 | IL47,000 | NC1.8% | CA10.2 |
| 19 | UT45,900 | NH1.7% | NH10.2 |
| 20 | OH45,400 | MA1.6% | NC9.7 |
| US2,350,000 | US1.6% | US9.2 |
6 Industries Below 2007 Pre-Recession Job Levels
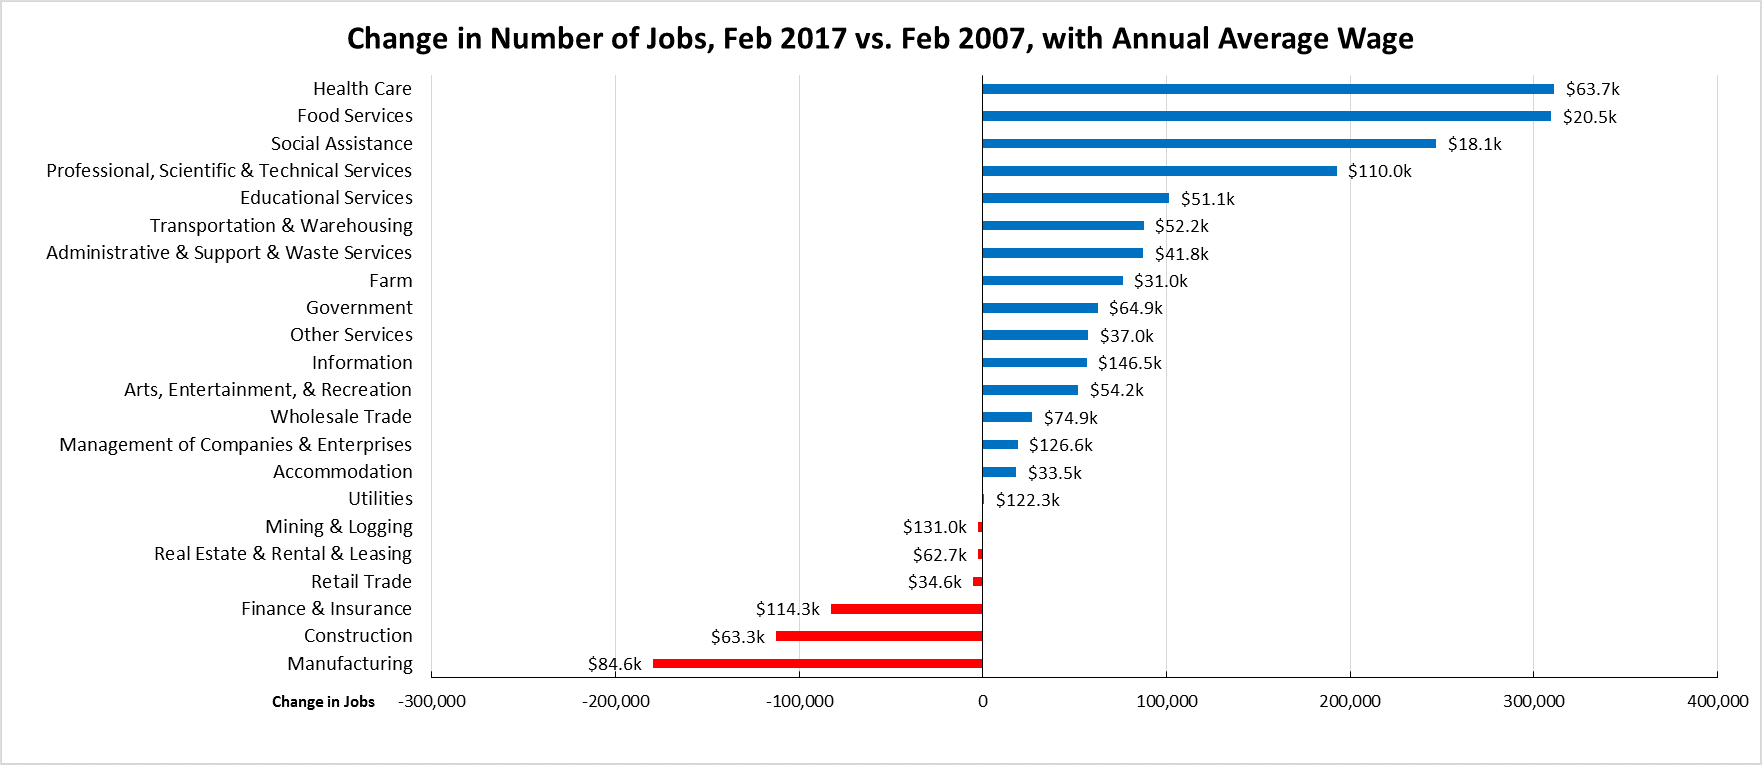
Comparing the number of jobs by industry in February 2017 (not seasonally adjusted), 6 industries had employment below the 2007 pre-recession levels. In the highest gain industries, Health Care remained the leading industry, followed by the two lowest wage industries (Food Services and Social Assistance) and higher wage Professional, Scientific & Technical Services. Of the lagging industries, three—Manufacturing, Mining & Logging, and Construction—are blue collar middle class wage industries, while the higher wage Finance & Insurance also continued to lose ground.
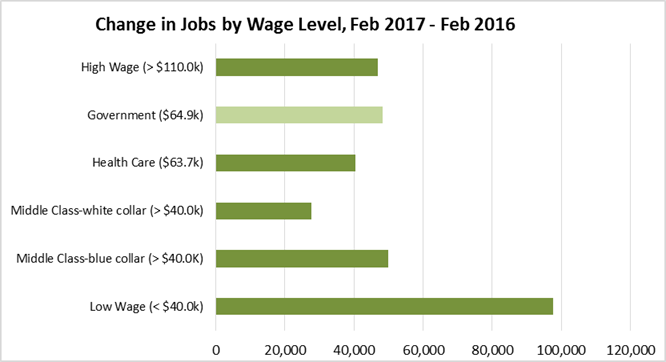
Job Gains By Wage Level
In the January budget proposal, the Governor identified the increasing dominance of lower wage slots in total jobs growth as one of the key factors slowing state revenues growth. The following chart illustrates this trend, according to the industry wage classification used previously in other Center analyses of this issue. In the chart below, Private sector jobs are shown in the dark green bands, while Government is shown in the lighter. As indicated, nearly one-third of jobs growth over the past 12 months has been in the low wage industries.
Two-Tier Economy Persists – Central Valley Unemployment Nearly 3 Times as High as Bay Area
Unemployment rates (all data is not seasonally adjusted) continue to vary widely across the state, ranging from 3.6% in the Bay Area to nearly three times as large at 10.2% in the Central Valley.
| Not Seasonally Adjusted | Unemployment Rate (%) February 2017 |
|---|---|
| California | 5.2 |
| Bay Area | 3.6 |
| Orange County | 3.7 |
| Los Angeles | 4.8 |
| San Diego/Imperial | 5.1 |
| Sacramento Region | 4.9 |
| Inland Empire | 5.3 |
| Central Sierra | 5.8 |
| Upstate California | 8.0 |
| Central Coast | 7.8 |
| Central Valley | 10.2 |
By Legislative District:
| Lowest 10 Unemployment Rates | |||||
|---|---|---|---|---|---|
| CD12 (Pelosi-D) | 2.9 | SD13 (Hill-D) | 2.7 | AD22 (Mullin-D) | 2.5 |
| CD18 (Eshoo-D) | 3.0 | SD11 (Wiener-D) | 3.1 | AD16 (Baker-R) | 2.5 |
| CD52 (Peters-D) | 3.0 | SD37 (Moorlach-R) | 3.3 | AD24 (Berman-D) | 2.8 |
| CD45 (Walters-R) | 3.1 | SD39 (Atkins-D) | 3.3 | AD28 (Low-D) | 2.9 |
| CD14 (Speier-D) | 3.1 | SD36 (Bates-R) | 3.4 | AD17 (Chiu-D) | 3.0 |
| CD17 (Khanna-D) | 3.3 | SD26 (Allen-D) | 3.5 | AD77 (Maienschein-R) | 3.1 |
| CD49 (Issa-R) | 3.4 | SD10 (Wieckowski-D) | 3.7 | AD19 (Ting-D) | 3.1 |
| CD33 (Lieu-D) | 3.4 | SD07 (Glazer-D) | 3.7 | AD73 (Brough-R) | 3.1 |
| CD15 (Swalwell-D) | 3.4 | SD15 (Beall-D) | 3.7 | AD78 (Gloria-D) | 3.2 |
| CD48 (Rohrabacher-R) | 3.6 | SD32 (Mendoza-D) | 3.9 | AD74 (Harper-R) | 3.2 |
| Highest 10 Unemployment Rates | |||||
|---|---|---|---|---|---|
| CD01 (LaMalfa-R) | 6.9 | SD21 (Wilk-R) | 5.7 | AD03 (Gallagher-R) | 8.6 |
| CD03 (Garamendi-D) | 7.3 | SD35 (Bradford-D) | 5.8 | AD34 (Fong-R) | 8.7 |
| CD09 (McNerney-D) | 7.5 | SD17 (Monning-D) | 6.4 | AD30 (Caballero-D) | 8.8 |
| CD10 (Denham-R) | 8.3 | SD04 (Nielsen-R) | 6.9 | AD13 (Eggman-D) | 8.9 |
| CD23 (McCarthy-R) | 9.3 | SD05 (Galgiani-D) | 8.1 | AD23 (Patterson-R) | 9.0 |
| CD20 (Panetta-D) | 9.5 | SD40 (Hueso-D) | 8.2 | AD56 (Garcia-D) | 10.7 |
| CD51 (Vargas-D) | 9.6 | SD08 (Berryhill-R) | 8.4 | AD26 (Mathis-R) | 11.7 |
| CD22 (Nunes-R) | 9.7 | SD16 (Fuller-R) | 9.0 | AD21 (Gray-D) | 11.8 |
| CD16 (Costa-D) | 12.0 | SD12 (Cannella-R) | 10.8 | AD31 (Arambula-D) | 11.8 |
| CD21 (Valadao-R) | 12.6 | SD14 (Vidak-R) | 13.7 | AD32 (Salas-D) | 13.4 |
6 California MSAs in the 10 Worst Unemployment Rates Nationally
Of the 10 Metropolitan Statistical Areas (MSAs) with the worst unemployment rates nationally, 6 are in California. Of the 20 worst, 12 are in California.
| Metropolitan Area | January 2017 Rate | Rank |
|---|---|---|
| Danville, IL Metropolitan Statistical Area | 8.6 | 369 |
| Kennewick-Richland, WA Metropolitan Statistical Area | 8.7 | 370 |
| Stockton-Lodi, CA Metropolitan Statistical Area | 8.7 | 370 |
| Modesto, CA Metropolitan Statistical Area | 8.9 | 372 |
| Santa Cruz-Watsonville, CA Metropolitan Statistical Area | 8.9 | 372 |
| McAllen-Edinburg-Mission, TX Metropolitan Statistical Area | 9.0 | 374 |
| Farmington, NM Metropolitan Statistical Area | 9.5 | 375 |
| Madera, CA Metropolitan Statistical Area | 10.0 | 376 |
| Yuba City, CA Metropolitan Statistical Area | 10.5 | 377 |
| Fresno, CA Metropolitan Statistical Area | 10.6 | 378 |
| Bakersfield, CA Metropolitan Statistical Area | 11.1 | 379 |
| Rockford, IL Metropolitan Statistical Area | 11.1 | 379 |
| Yakima, WA Metropolitan Statistical Area | 11.1 | 379 |
| Salinas, CA Metropolitan Statistical Area | 11.2 | 382 |
| Hanford-Corcoran, CA Metropolitan Statistical Area | 11.7 | 383 |
| Visalia-Porterville, CA Metropolitan Statistical Area | 12.4 | 384 |
| Merced, CA Metropolitan Statistical Area | 12.6 | 385 |
| Ocean City, NJ Metropolitan Statistical Area | 14.0 | 386 |
| Yuma, AZ Metropolitan Statistical Area | 14.3 | 387 |
| El Centro, CA Metropolitan Statistical Area | 19.6 | 388 |
Note: All data sources, methodologies, and historical data series available at CenterforJobs.org