Download February 2019 Jobs Report
Highlights for policy makers:
- Unemployment Level at 4.2%; Employment Up 18,000
- Labor Force Participation Rate Rises to 62.8%
- Labor Force by Age
- Employment Growth Ranking—California Remains 1st
- Nonfarm Jobs Up 14,600 for Month; California Remains Ranked #2 for 12-month Gain
- Jobs Change by Industry
- Structural Shifts in State’s Economy
- Unemployment Rates by Region
- Unemployment Rates by Legislative District
- Employment Growth by Region
- 20 MSAs with the Worst Unemployment Rates
- Chart of the Month: Manufacturing Employment
Unemployment Level at 4.2%; Employment Up 18,000
EDD reported total employment (seasonally adjusted; February preliminary) was up 18,000 from January, while the number of unemployed rose 6,500. Unemployment rate stayed at 4.2%. The unadjusted rate was down 0.2 point from the year earlier to 4.4%.
California had the 11th highest unemployment rate.
Total US employment saw a seasonally adjusted gain of 255,000, with the number of unemployed dropping 300,000. The unemployment rate dropped to 3.8%.
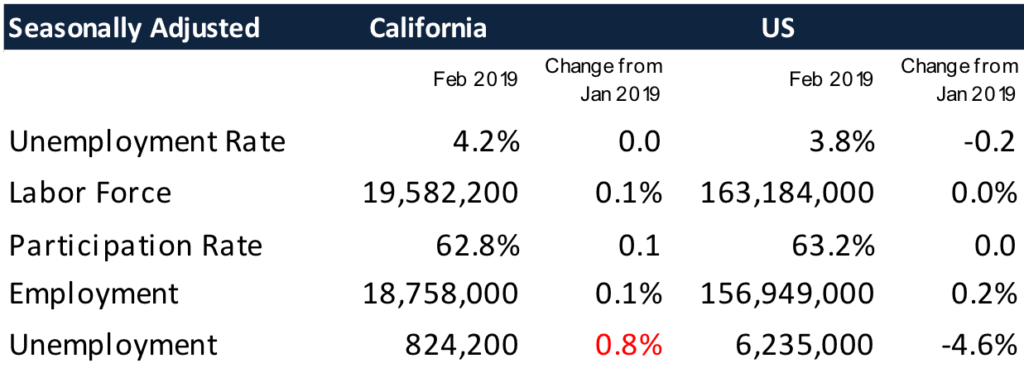
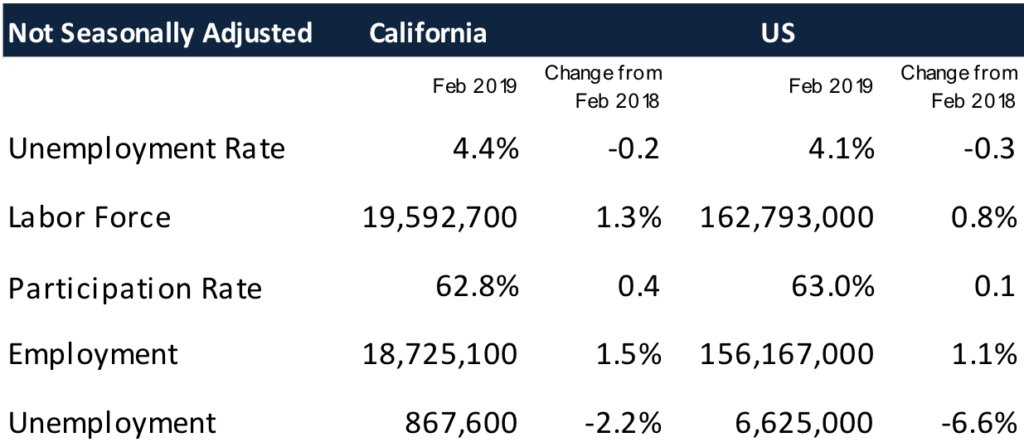
Figure Sources: California Employment Development Department; US Bureau of Labor Statistics
Labor Force Participation Rate Rises to 62.8%
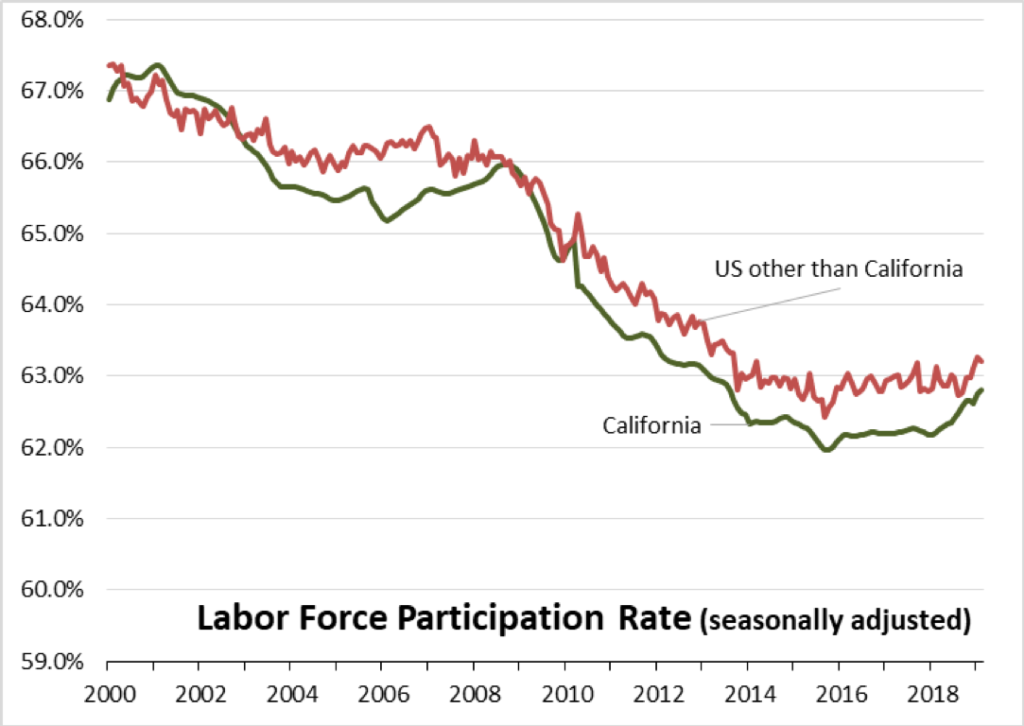
Figure Sources: California Employment Development Department; US Bureau of Labor Statistics
California’s seasonally adjusted labor force participation rate continued rising to 62.8% with modest gains in the number of workers reentering the workforce. Nationally, the participation rate was unchanged. Although the gap has narrowed, the state continues to experience lower than average participation rates in spite of having a relatively younger population than the rest of the US.
For the 12 months ending February 2019, the seasonally adjusted data shows the California labor force grew 1.6% compared to the rest of the US at 0.7%.
Labor Force by Age
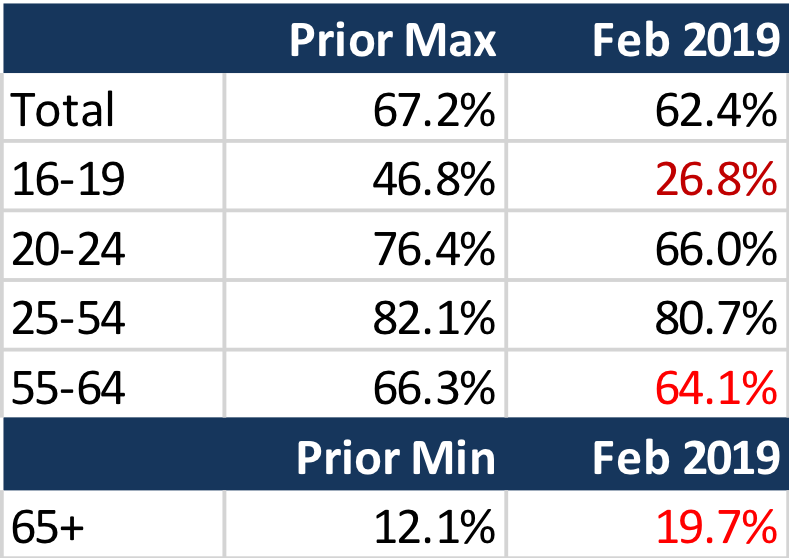
Figure Source: California Employment Development Department
Labor force participation by age (12-month running average) grew for the prime working age groups, while declining for youth, older workers, and seniors. The continued low rates for youth and young adults in particular have implications for life-time earnings potential due to the delay in acquiring essential workplace skills.
Employment Growth Ranking—California Remains 1st

Figure Sources: California Employment Development Department; US Bureau of Labor Statistics
Over the 12 months ending in February, the total number of persons employed (seasonally adjusted) grew by 318,000. California remained in 1st place ahead of Texas, which saw an additional 254,000 persons employed over this period.
Based on percentage growth, California had a 1.7% expansion in employment, above the average for the rest of the US at 1.0%. Ranked among the states, California dipped to 11th place, while Arizona continued to lead at 3.4%.
Nonfarm Jobs Up 14,600 for Month; California Remains Ranked #2 for 12-month Gain

Figure Sources: California Employment Development Department; US Bureau of Labor Statistics
Nonfarm jobs (seasonally adjusted) were up 14,600 from January. January’s gains were revised to 5,900 from the previously reported 3,000.
For the 12 months ending February, total jobs growth was 222,500, keeping the state in 2nd place behind Texas which gained 268,800 jobs in this period, with Florida in a close third at 211,900.
On a percentage basis, California dipped to 19th among the states, with a 12-month jobs growth rate of 1.3% vs. the US average of 1.7%.
Jobs Change by Industry
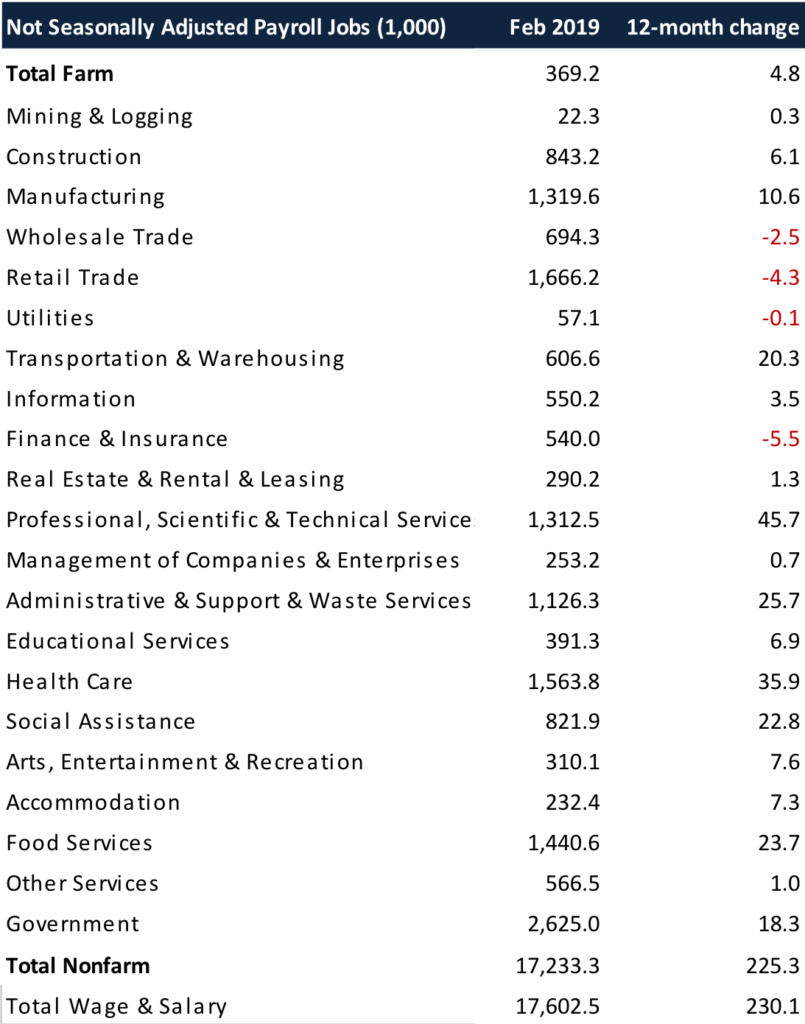
Figure Sources: California Employment Development Department; US Bureau of Labor Statistics
In the unadjusted numbers that allow a more detailed look at industry shifts, hiring saw increases in all but 4 industries over the year.
Gains in payroll jobs were led by Professional, Scientific & Technical Services ($120.4k average annual wages), Health Care ($67.3k), and Administrative & Support & Waste Services ($44.9k).
Declines were led by Finance & Insurance ($127.0k), Retail Trade ($36.0k), and Wholesale Trade ($78.7k).
All wage data is from the most current 4-quarter average from the Quarterly Census of Employment & Wages.
Structural Shifts in State’s Economy
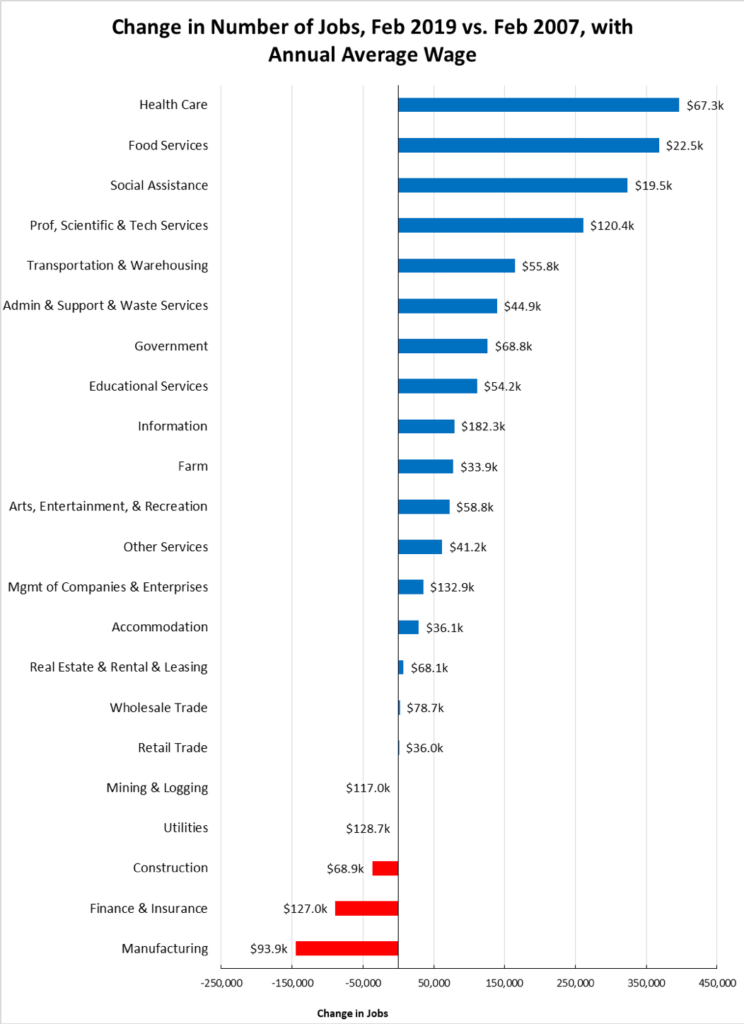
Figure Source: California Employment Development Department
Comparing current job numbers to the pre-recession levels in 2007 illustrates the structural shift in the state’s economy, with the primary jobs growth occurring in the higher and lower wage industries.
Jobs growth within the traditional middle class wage—especially blue collar industries such as Manufacturing, Construction, and Mining & Logging—continues to lag with the heavily blue collar Utilities beginning to show shrinkage as well. Finance & Insurance also continues to lose ground. Of these, Construction has gained in the past year as activity has picked up. While improving, construction jobs remain 76,600 below the 2007 peak and 123,100 (13%) below the pre-recession high in 2006.
Unemployment Rates by Region
| California | 3.9 |
| Bay Area | 2.5 |
| Orange County | 2.8 |
| Sacramento | 3.5 |
| San Diego/Imperial | 3.8 |
| Central Sierra | 3.9 |
| Inland Empire | 3.9 |
| Central Coast | 4.1 |
| Los Angeles | 4.5 |
| Upstate California | 4.8 |
| Central Valley | 6.6 |
Unemployment Rates by Legislative District
| Lowest 10 Unemployment Rates | |||||
|---|---|---|---|---|---|
| CD12 (Pelosi-D) | 2.3 | SD13 (Hill-D) | 2.1 | AD22 (Mullin-D) | 2.0 |
| CD18 (Eshoo-D) | 2.4 | SD11 (Wiener-D) | 2.5 | AD16 (Bauer-Kahan-D) | 2.1 |
| CD17 (Khanna-D) | 2.5 | SD36 (Bates-R) | 2.7 | AD24 (Berman-D) | 2.2 |
| CD14 (Speier-D) | 2.5 | SD37 (Moorlach-R) | 2.7 | AD28 (Low-D) | 2.4 |
| CD15 (Swalwell-D) | 2.6 | SD39 (Atkins-D) | 2.8 | AD17 (Chiu-D) | 2.4 |
| CD52 (Peters-D) | 2.7 | SD10 (Wieckowski-D) | 2.8 | AD25 (Chu-D) | 2.5 |
| CD49 (Levin-D) | 2.7 | SD15 (Beall-D) | 2.9 | AD19 (Ting-D) | 2.6 |
| CD45 (Porter-D) | 2.8 | SD07 (Glazer-D) | 3.0 | AD78 (Gloria-D) | 2.6 |
| CD48 (Rouda-D) | 2.8 | SD34 (Umberg-D) | 3.3 | AD73 (Brough-R) | 2.7 |
| CD27 (Chu-D) | 3.0 | SD38 (Jones-R) | 3.4 | AD74 (Petrie-Norris-D) | 2.7 |
| Highest 10 Unemployment Rates | |||||
|---|---|---|---|---|---|
| CD03 (Garamendi-D) | 6.1 | SD30 (Mitchell-D) | 5.0 | AD30 (Rivas-D) | 7.5 |
| CD01 (LaMalfa-R) | 6.2 | SD35 (Bradford-D) | 5.2 | AD23 (Patterson-R) | 7.5 |
| CD09 (McNerney-D) | 6.4 | SD17 (Monning-D) | 5.5 | AD34 (Fong-R) | 7.6 |
| CD10 (Harder-D) | 6.8 | SD04 (Nielsen-R) | 5.9 | AD03 (Gallagher-R) | 7.6 |
| CD23 (McCarthy-R) | 8.2 | SD05 (Galgiani-D) | 6.8 | AD13 (Eggman-D) | 7.7 |
| CD51 (Vargas-D) | 8.3 | SD08 (Borgeas-R) | 7.0 | AD56 (Garcia-D) | 9.3 |
| CD22 (Nunes-R) | 8.6 | SD40 (Hueso-D) | 7.1 | AD21 (Gray-D) | 9.8 |
| CD20 (Panetta-D) | 8.7 | SD16 (Grove-R) | 7.8 | AD31 (Arambula-D) | 10.8 |
| CD16 (Costa-D) | 10.5 | SD12 (M.Caballero-D) | 9.6 | AD26 (Mathis-R) | 11.0 |
| CD21 (Cox-D) | 11.0 | SD14 (Hurtado-D) | 12.2 | AD32 (Salas-D) | 11.2 |
Employment Growth by Region
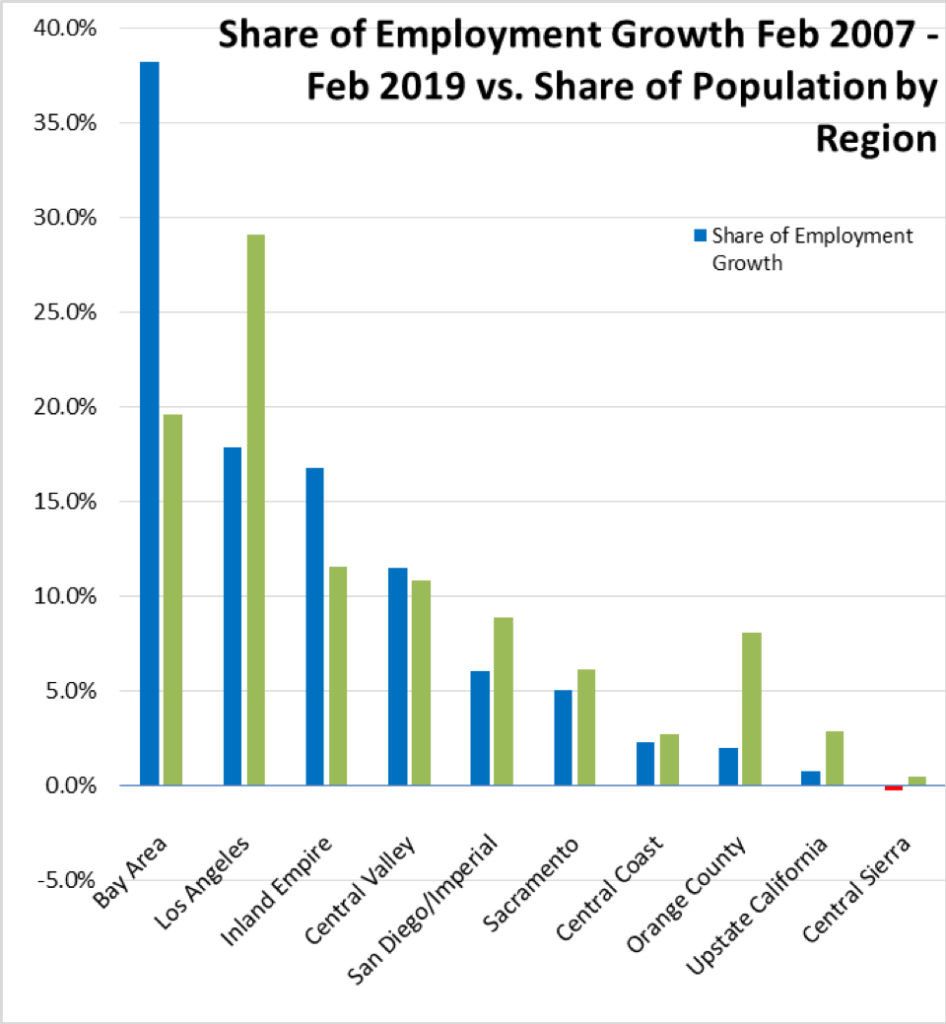
Figure Sources: California Employment Development Department; Department of Finance
Containing 19.6% of the state’s population, the Bay Area has accounted for 38.2% of net employment growth compared to pre-recession levels. Los Angeles Region, with 29.1% of the population, accounted for only 17.8% of net employment gains.
20 MSAs with the Worst Unemployment Rates

Figure Source: US Bureau of Labor Statistics, December 2018 data
Of the 20 Metropolitan Statistical Areas (MSAs) with the worst unemployment rates in January 2018, 11 are in California, including El Centro MSA (Imperial County) with the highest unemployment rate in the country.
Chart of the Month: Manufacturing Employment
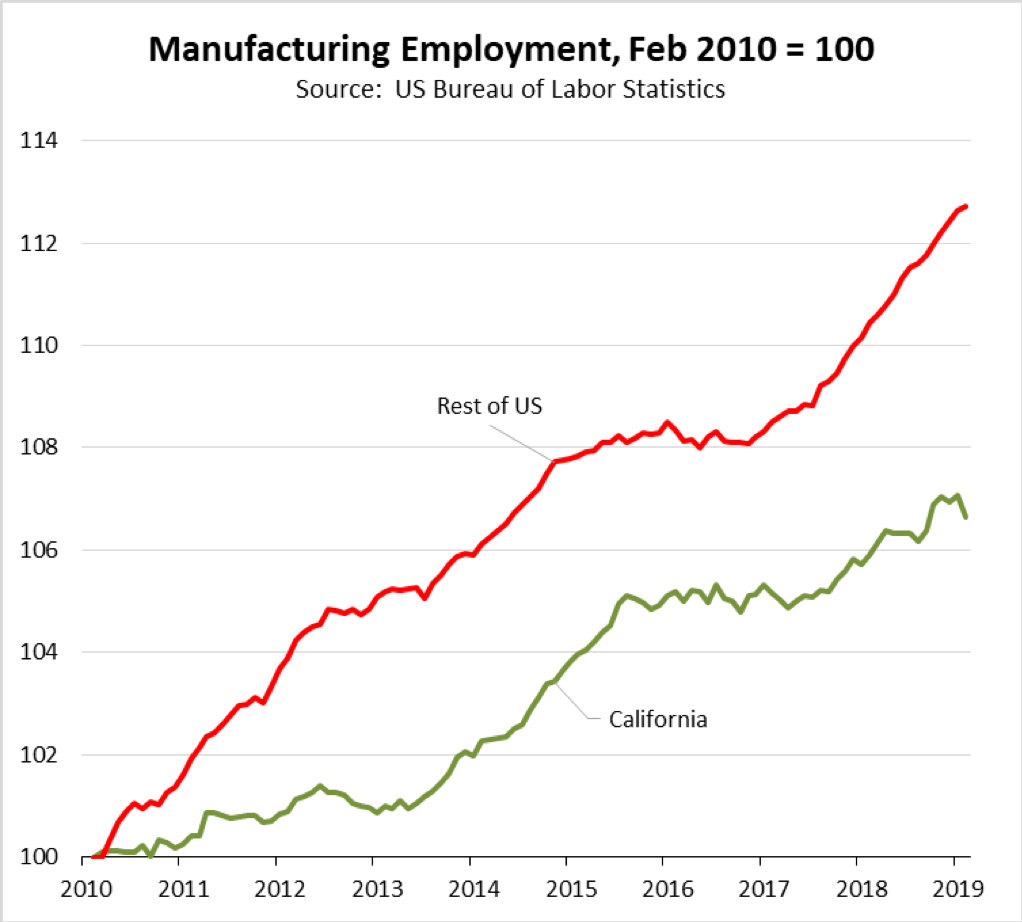
While reduced in size as a result of offshoring, company migration to other states, and growing use of automation, manufacturing remains a critical element in the California economy. As a very high wage, blue collar industry, manufacturing remains an important economic mobility path especially for workers with lower educational attainment. The most recent Quarterly Workforce Indicator data shows that 41% of the 2017 employment in this industry comprised workers with a high school or less than high school education, with workers at this educational level earning an average of $58,500.
Manufacturing also remains the industry with the highest multiplier effects within the state economy. The most recent (2017) RIMS multipliers from US Bureau of Economic Analysis for California show the type II final demand output multipliers (direct, indirect, and induced effects) for durables manufacturing as the highest and nondurables manufacturing as the 2nd highest among the 21 industries modeled. The multipliers for manufacturing are over 2.3 times as high as for Professional, Scientific & Technical Services and more than 1.8 times as high as for Information—the two industries accounting for the overwhelming portion of high wage jobs growth in the state.
Manufacturing also remains a gateway job for immigrants seeking a middle class wage within the California economy. An analysis of the most recent 2017 public use microdata for the American Community Survey indicates that 44% of those working within manufacturing were naturalized citizens or not a citizen.
After reaching a low in February 2010, manufacturing employment (seasonally adjusted) has since begun to rebound, with accelerating growth beginning in 2016 as a result of reshoring and expansion of existing manufacturing. However, employment growth has been about half as strong in California compared to the rest of the country, as illustrated in the chart above that indexes manufacturing employment to the February 2010 lows.
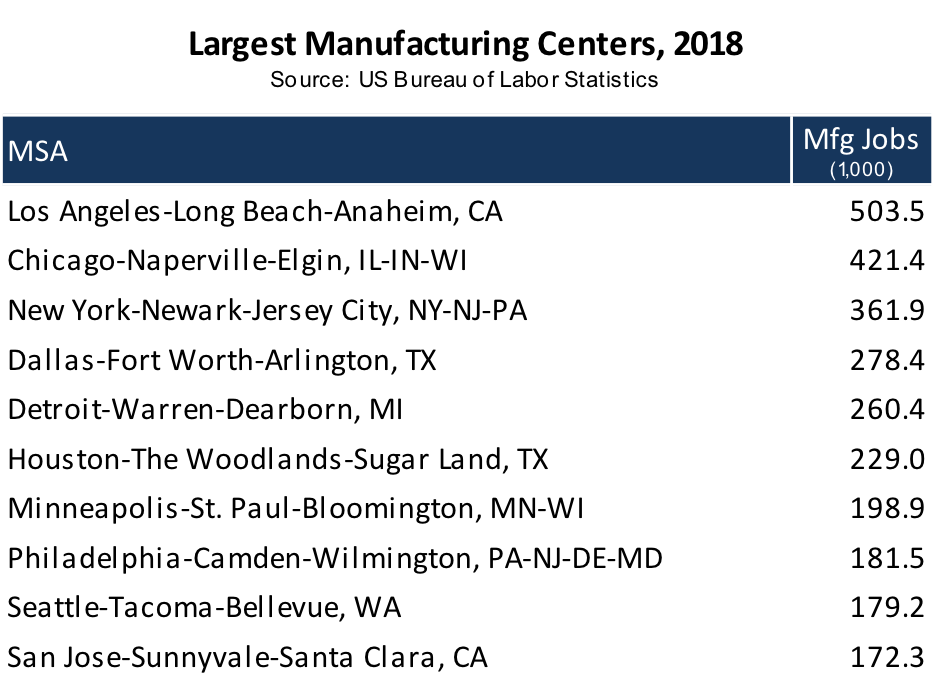
California still retains the largest manufacturing center in the US, Los Angeles-Long Beach-Anaheim MSA, with 503,500 manufacturing jobs in 2018 (not seasonally adjusted annual average). San Jose-Sunnyvale-Santa Clara MSA comes in as the 10th largest manufacturing center, with 172,300 jobs.
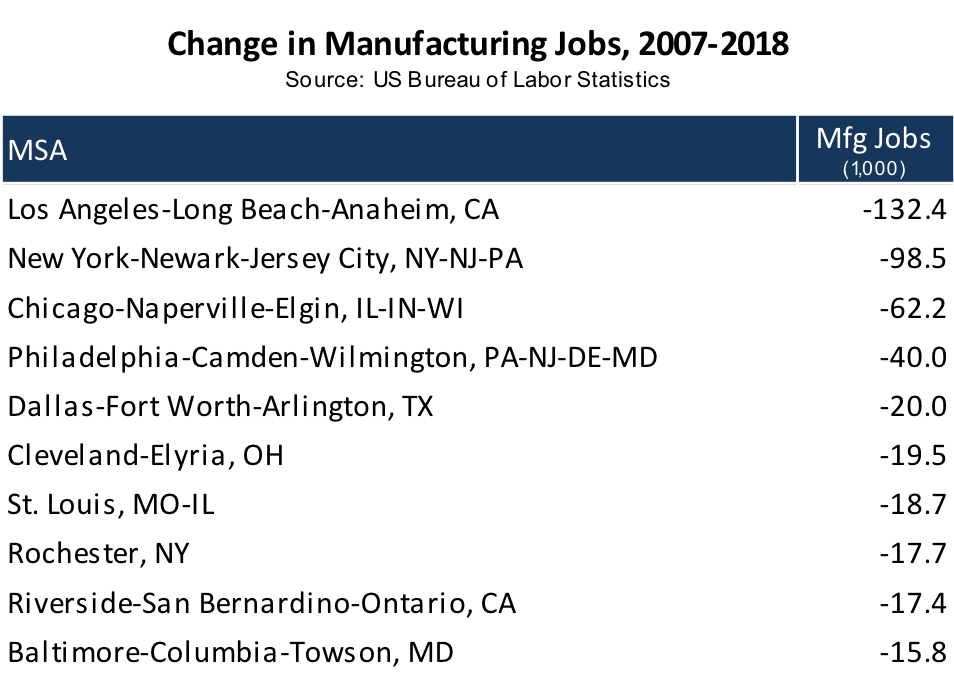
Los Angeles, however, also ranks number 1 as showing the greatest manufacturing losses coming out of the recent recession, along with the attendant reductions in higher wage opportunities for lower educational attainment workers and the state’s immigrant population.
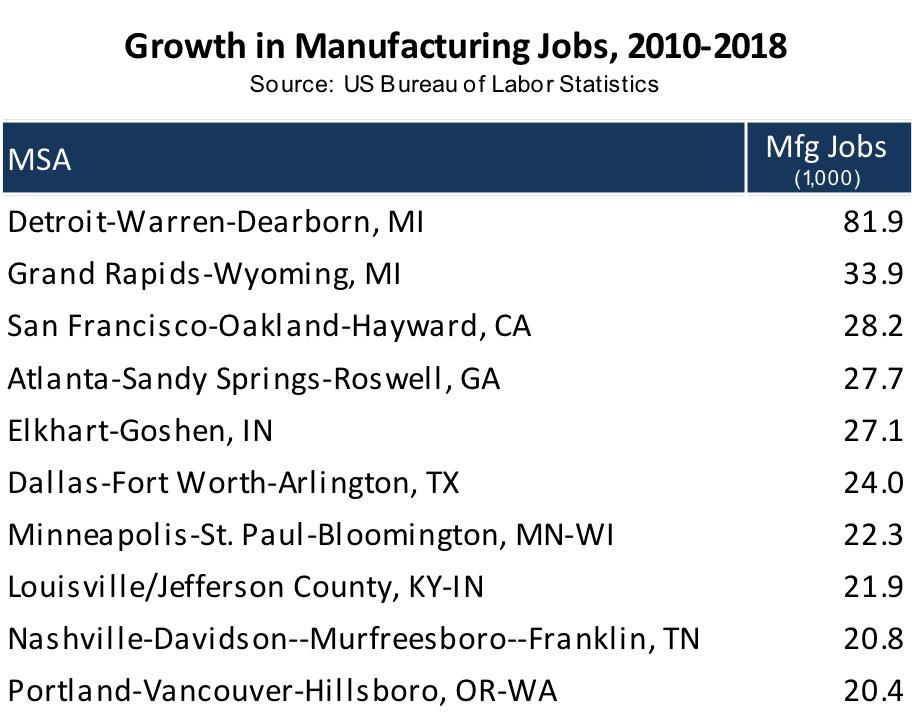
Rather than the traditional Southern California base, the only state MSA to make it into the Top 10 by jobs growth since the rebound began in February 2010 is San Francisco-Oakland-Hayward, driven primarily by Tesla and related suppliers, R&D manufacturing related to Silicon Valley companies, and to a lesser degree food products.
Data Note
All labor force and jobs data above reflects the annual revisions to the historical data by EDD and BLS. The Center’s data series have been updated as well. In general, the revisions affect data beginning in 2014 for the US, states, and counties, although in some cases the revisions extend back to 1990. All Legislative District labor force, poverty, income, and population estimates have been updated using the county revisions along with the most recent census share factors from the 2013-2017 American Community Survey.
