Highlights for policy makers:
- COVID-19 and the State Economy
- Unemployment Unchanged at 3.9%; Employment Up Only 500
- Labor Force Participation Rate Level at 62.6%
- Employment Growth Ranking
- Nonfarm Jobs Up 29,000 for Month; California Dips to #3 for 12-month Gain
- Jobs Change by Industry
- Structural Shifts in State’s Economy
- Unemployment Rates by Region (not seasonally adjusted)
- Unemployment Rates by Legislative District (not seasonally adjusted)
- Employment Growth by Region
- MSAs with the Worst Unemployment Rates
COVID-19 and the State Economy
The potential effects on the state economy continue to expand as the emergency social distancing measures have now been extended through at least the end of April for the US and in California under Executive Order N-33-20 “until further notice” but based on indications from the Governor’s Office, likely into at least May.
The February employment and jobs data just released by EDD are based on surveys done the week of February 12. Consequently, they do not yet reflect effects coming from measures taken within the US and California to combat COVID-19, but they begin to indicate effects coming from global supply chain disruptions related to the original outbreaks in China. These effects in particular are shown in the unadjusted numbers for Transportation & Warehousing and Retail Trade which dropped more strongly from January. Additional information will be shown in the March numbers scheduled for release on April 17, although due to the fact they will be based on surveys from the week of March 12, they also will still reflect effects of the supply disruptions more than effects of the current closures. A more complete accounting will first be seen in the April numbers scheduled for release on May 22.
As a base indicator tool to summarize these changes as they occur, the following chart contains the most recent employment estimates by industry along with the 12-month change taken from the revised data for the same month in the prior year. The data used is the unadjusted numbers to show actual job levels held by Californians rather than the statistical levels from the seasonally adjusted data, and to enable use of the average wage and hours worked numbers where available from this series. The 2019 data will continue to be used for the pre-COVID base comparison. Month-to-month changes will still be instructive to indicate which industries and areas are being the most affected, but the year over year comparison allows seasonal factors to be taken into account. Within this chart, note that “employment” is the number of persons age 16 and over working, including wage & salary jobs, self-employment, and non-paid family workers in the civilian workforce. “Jobs” are the number of wage & salary jobs, with individual workers holding one or more of these jobs.
Employment & Jobs Tracking
Source: US Bureau of Labor Statistics
WARN Act data provides an early indicator of job reductions. The California and Federal WARN Acts require employers to give a 60-day notice prior to a facility closure or mass layoff. While the Governor has paused the associated penalties for not meeting the requirements, the requirements themselves remain in place. In March (reporting as of March 25), the number of affected employees jumped to 18,998 compared to an average of 7,051 in the prior 8 months. Only 3,528 employees were affected by permanent closures concentrated primarily at the beginning of the month, with notices in the second half almost solely temporary closures.
Another early indicator will be through weekly initial claims for Unemployment Insurance (UI). For the week ending March 21, California’s initial claims jumped 129,203 over the prior week to 186,809. California’s reported total was the third highest behind Pennsylvania’s estimated 378,908 and Ohio’s estimated 187,784. Expressed as a percentage of the February labor force, California was 39th highest at a weekly claims rate of 1.0% compared to Rhode Island at 6.3%, Nevada at 6.0%, and Pennsylvania at 5.8%. While reflecting a sharp upward spike in absolute numbers, California’s relatively lower rate indicates that the economic effects are only beginning. The weekly reports are issued each Thursday. Demographic information and claims by industry are contained in the monthly data. Most state UI programs, including California’s, are largely unprepared, however, for a continued upsurge in claims.
The current situation continues to affect various industries differently:
- A Wall Street Journal survey of 34 economists a week ago produced a baseline projection of a Q2 GDP loss of 7% and growth resuming in Q4, but other forecasts range up to a cumulative 15% drop and growth beginning only in 2021. Most of the economists now see the economic drop equaling or exceeding the most recent recession, but with most also still viewing the situation as a services-driven downturn.
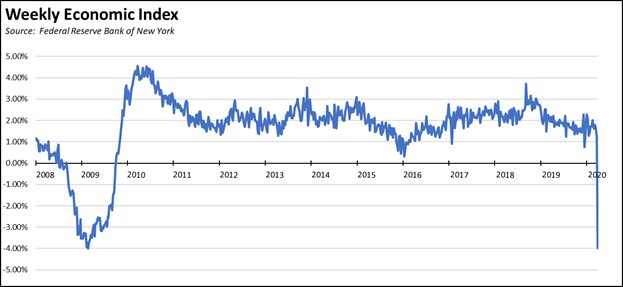
- The New York Federal Reserve Bank has created a new Weekly Economic Index to track changes in the national economy as they are occurring, to provide economic estimates in advance of the official data series. Based on weekly data, the Index indicates the change in annual GDP that would result from the weekly trends continuing for the entire quarter. For example, the Index value of -3.97 for the week of March 21 indicates annual GDP would decline by 3.97% if that week’s trends were projected over a full quarter. This is nearly the same value reached by the Index the week of February 28, 2009, just over a year into the recession that began in early 2008, an indication of how sharp the current decline in current economic activity now is. The historical series showing the sharp drop off last week is in the chart below.
- Many employers continue to maintain employment and associated incomes through adaptive work arrangements, primarily work-at-home options. In California as well as much of the rest of the nation, American Community Survey data shows working at home in fact was the fastest growing commute option even prior to the current emergency, with workers choosing this option continuing to exceed those using public transit. This option, however, remains available primarily to higher wage workers, with restrictions under the state’s wage and hour laws especially combined with the severe penalties under the Private Attorney General Act (PAGA) for even minor paperwork errors making this option a highly risky choice for employers already facing fundamental challenges to the survival of their businesses. Combined with fewer work arrangement alternatives as a result of last year’s AB 5, lower wage workers are likely to continue seeing some of the greater income impacts from the current emergency as well as longer term effects if jobs recovery proceeds under “business as usual” from the state’s regulatory and cost barriers. Resuming regular employment as quickly as possible will remain a critical recovery response. The most recent AARP survey (October 2019) indicated that 53% of households nationally do not maintain emergency savings they can draw on, ranging from 78% for those earning less than $20,000 to even 25% for those earning $150,000 or more.
- Not all jobs, however, are not amenable to remote work. A recent study from Becker Friedman Institute at University of Chicago estimates that up to 34% of US jobs could be performed at home while accounting for 44% of current wages, a factor that can go far to minimize longer term public finance impacts. The percentages vary substantially by region, ranging from 26% (30% by wages) in Stockton-Lodi MSA and 27% (33%) in Bakersfield MSA, to 48% (63%) in San Jose-Sunnyvale-Santa Clara MSA and 42% (55%) in San Francisco-Oakland-Hayward MSA. The percentages also vary widely by industry, ranging from lows of 3% (7%) in Accommodation & Food Services and 8% (13%) in Agriculture, Forestry, Fishing & Hunting where most occupations require a physical presence, to much higher shares in industries centralized in California including 68% (76%) in Information, 74% (63%) in Educational Services, and 77% (83%) in Professional, Scientific & Technical Services.
Share of Jobs That Can Be Done From Home
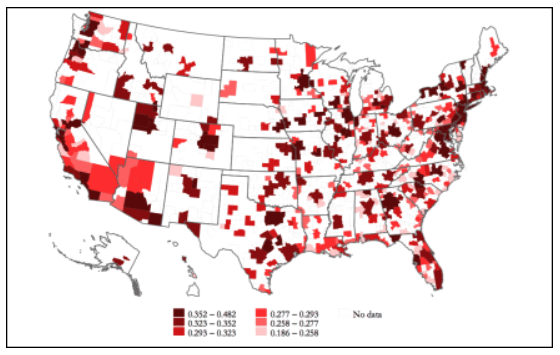
Source: Jonathan Dingel and Brent Neiman, How Many Jobs Can be Done at Home?, White Paper, Becker Friedman Institute, University of Chicago, March 2020
- As reflected in the initial WARN Act and UI initial claims data, many “non-essential” businesses and those unable to shift to alternative customer contact models such as home delivery have yet to resort to large scale layoffs, and instead are using available cash flow to maintain critical workforces as much as possible. The recent federal relief packages include provisions to support this approach. Available cash flow, however, varies widely by industry and business, with many small and medium businesses in particular having shorter time frames to maintain these arrangements. A 2016 JPMorgan Chase Institute study found median small businesses had a cash balance capable of lasting only 27 days, with retailers at 19 days and restaurants at 16. A 2018 Wombly study found 21% of small businesses would fail after a month without any cash flow, and an additional 34% couldn’t last more than one to three months. California Restaurant Association recently warned that up to 30,000 California restaurants are now facing the risk of permanent closure. Even in the Bay Area, California Hotel and Lodging Association reports that hotels are running at only 20% capacity, well below the break-even occupancy level of 50-60%. Many companies have already turned to furloughs, with more than 50,000 chain stores and restaurant locations closed nationwide through March 26. As businesses fail or husband cash reserves through actions such as delaying rent, utility, and other monthly payments, the economic effects will be shifted to other businesses in the economic chain who have their own cash flow points that cannot be crossed without jeopardizing their survival.
- Businesses especially many global supply chain providers have begun reopening in China as restrictions have begun to be relaxed. Many companies, however, now face a new challenge as many orders are being canceled including many that were ready for shipment. The ability of those suppliers to weather this next round of economic hits has longer term implications to how quickly the normal flow of goods and services will return in a post-COVID-19 economy, especially one that continues to be dependent on the recent trading patterns.
- While many businesses particularly services, restaurants, and many retail operations have seen their business drop drastically or disappear completely under the emergency orders, others have seen an upsurge such as healthcare, delivered food, and others struck by panic buying. These employers are in a strong hiring mode, although the net effects on jobs and incomes will not be seen until the April data.
- Other businesses are now faced with changes in consumer behavior and expectations that may have lasting effects beyond the immediate crisis and recovery periods. As an example, the closure of theatres and shift to on-line releases threatens an already declining component of the business model supporting production and related jobs throughout the Southern California economy.
Unemployment Unchanged at 3.9%; Employment Up Only 500
EDD reported total employment (seasonally adjusted; February preliminary) was up only 500 from the revised January numbers, while the number of unemployed dipped 5,800. Unemployment rate remained at the series low of 3.9%. The unadjusted rate was down 0.2 point from the year earlier to 4.3%.
California edged up to the 11th highest unemployment rate among the states.
Total US employment saw a seasonally adjusted gain of only 45,000, with the number of unemployed down by 105,000. The unemployment rate dipped to 3.5%, again reaching the lowest point since 1969.
Figure Sources: California Employment Development Department; US Bureau of Labor Statistics
Labor Force Participation Rate Level at 62.6%
California’s seasonally adjusted labor force participation rate was unchanged at 62.6%. Nationally, the participation rate also remained constant at 63.4%. The state continues to experience lower than average participation rates in spite of having a relatively younger population than the rest of the US.
For the 12 months ending February 2019, the seasonally adjusted data shows the California labor force was up 210,700 workers (1.1% growth) compared to the rest of the US gain of 1.7 million (+1.2%). Much of the California improvement, however, comes from the downward revision of the labor force numbers for the first half of 2019.
Employment Growth Ranking
The total number of persons employed (seasonally adjusted) over the 12 months ending in February grew by 210,700. As a result, California rose to 3rd highest among the states in terms of absolute employment growth over the year, with Texas leading with an additional 269,700 persons employed over this period, and Florida in second place with a gain of 252,700.
Adjusted to account for differences in the size of each state economy, California over the year grew by 1.1%, just below the average for the rest of the US with a gain of 1.2%. Ranked among the states, California’s growth rate edged down to 25th in large part due to the annual data revisions, with Arizona again leading with 3.2% growth.
Figure Source: US Bureau of Labor Statistics
Nonfarm Jobs Up 29,000 for Month; California Dips to #3 for 12-month Gain
Nonfarm jobs (seasonally adjusted) were up 29,000 as January’s seasonally adjusted gains were revised to 29,100 from the previously reported 21,400.
While the job numbers show growth continuing at near the previous pace prior to the current emergency, comparison with the employment numbers suggests the data does not reflect actual addition of new jobs. The seasonally adjusted employment shows a net addition of only 500, while the underlying unadjusted numbers show employment growth at about only 1/3 the level for February in recent years. As such, the relatively favorable numbers more likely reflect a shift of employment status from self-employment and independent contractor to wage & salary under the terms of last year’s AB 5 rather than creation of new jobs. This legislation will continue to affect the jobs numbers as well as contribute to the uncertainty faced by both employers and workers during the current emergency and the upcoming recovery period.
For the 12 months ending February, total jobs growth for California was 210,700, with the state’s rank dipping to 3rd place behind Texas which gained 269,700 jobs in this period and Florida with 252,700.
Adjusting for population size, California dropped to 25th among the states, with a 12-month jobs growth rate of 1.1% compared to the rest of the US at 1.2%.
Figure Sources: California Employment Development Department; US Bureau of Labor Statistics
Jobs Change by Industry
In the unadjusted numbers that allow a more detailed look at industry shifts, hiring saw increases in all but 4 industries over the year.
Gains in payroll jobs were led by Professional, Scientific & Technical Services ($122.5k average annual wages), Government ($38.6k), and Social Assistance ($19.8k).
As economic disruptions began to be felt in supply chains due to the situation in China, declines were led by Manufacturing ($95.6k), Retail Trade ($36.7k), and Wholesale Trade ($78.3k).
All wage data is from the most current 4-quarter average from the Quarterly Census of Employment & Wages.
| Not Seasonally Adjusted Payroll Jobs (1,000) | Jan 2020 | 12-month change | Nonfarm Growth Rank |
|---|---|---|---|
| Total Farm | 360.8 | 10.0 | |
| Mining & Logging | 22.1 | 0.3 | 17 |
| Construction | 875.3 | 27.6 | 6 |
| Manufacturing | 1,306.7 | -11.0 | 21 |
| Wholesale Trade | 686.6 | -8.4 | 19 |
| Retail Trade | 1,634.6 | -10.9 | 20 |
| Utilities | 56.8 | 0.4 | 16 |
| Transportation & Warehousing | 655.1 | 37.5 | 3 |
| Information | 591.2 | 21.6 | 8 |
| Finance & Insurance | 544.6 | 7.6 | 13 |
| Real Estate & Rental & Leasing | 304.0 | 7.5 | 14 |
| Professional, Scientific & Technical Services | 1,362.9 | 43.2 | 1 |
| Management of Companies & Enterprises | 251.1 | -3.9 | 18 |
| Administrative & Support & Waste Services | 1,126.5 | 16.3 | 9 |
| Educational Services | 404.0 | 10.7 | 10 |
| Health Care | 1,596.7 | 28.7 | 5 |
| Social Assistance | 864.2 | 37.5 | 3 |
| Arts, Entertainment & Recreation | 324.5 | 9.7 | 11 |
| Accommodation | 236.6 | 3.7 | 15 |
| Food Services | 1,467.6 | 25.5 | 7 |
| Other Services | 576.3 | 8.0 | 12 |
| Government | 2,653.3 | 38.6 | 2 |
| Total Nonfarm | 17,540.7 | 290.2 | |
| Total Wage & Salary | 17,901.5 | 300.2 | |
Figure Source: California Employment Development Department
Structural Shifts in State’s Economy
Comparing current job numbers to the pre-recession levels in 2007 illustrates the structural shift in the state’s economy, with the primary jobs growth occurring in the higher and lower wage industries.
Within middle class wage Construction jobs remain 91,000 (9.4%) below the all-time peak reached the year before in 2006 in part due to seasonal factors. However, Residential Building Construction covers about a third of the remaining gap, with the February 2019 job levels 33,600 (22.6%) below the all-time peak in 2006.
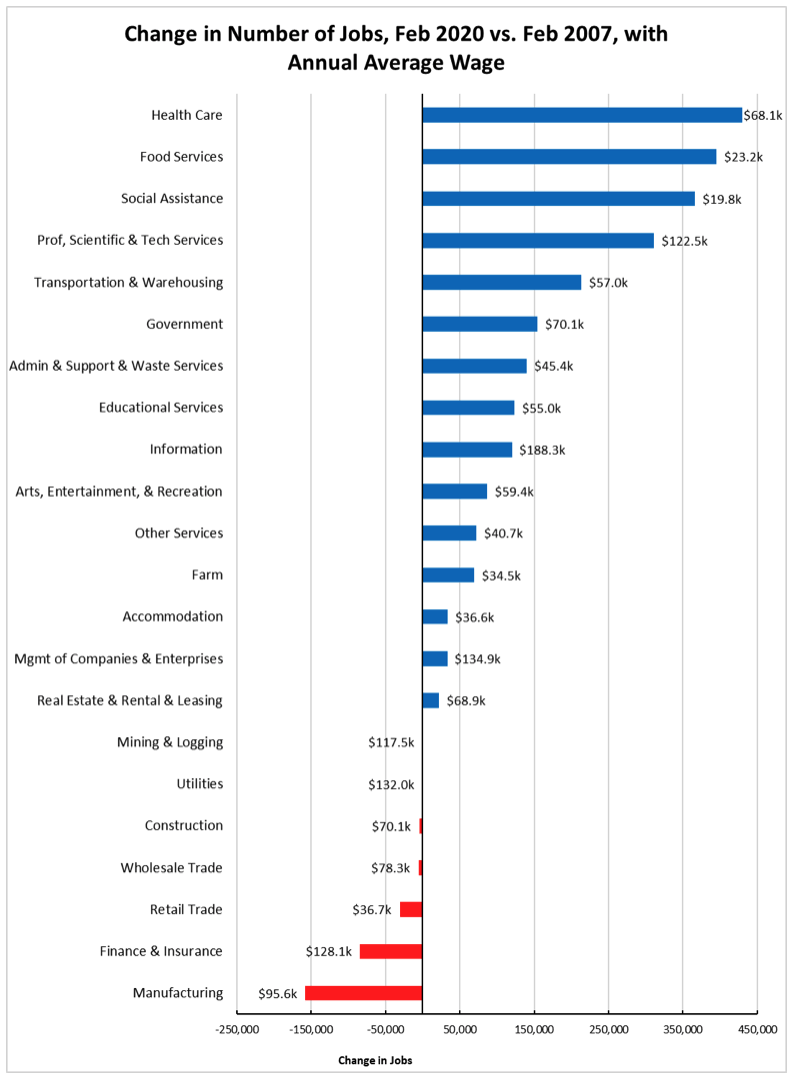
Figure Source: California Employment Development Department
Unemployment Rates by Region (not seasonally adjusted)
| wdt_ID | Region | Unemployment Rates |
|---|---|---|
| 1 | California | 4.3 |
| 2 | Bay Area | 2.7 |
| 6 | Orange County | 2.8 |
| 10 | Sacramento | 3.8 |
| 14 | San Diego/Imperial | 3.8 |
| 18 | Inland Empire | 4.0 |
| 22 | Central Sierra | 4.6 |
| 26 | Los Angeles | 4.5 |
| 30 | Upstate California | 6.3 |
| 34 | Central Coast | 7.0 |
| 38 | Central Valley | 8.5 |
Figure Source: California Employment Development Department
Unemployment Rates by Legislative District (not seasonally adjusted)
The legislative district data has been revised to incorporate the county labor force updates and the 2018 American Community Survey factors. The full estimates are now available on the Center’s web site.
Lowest
| wdt_ID | Congressional District | Unemployment Rate |
|---|---|---|
| 1 | CD12 (Pelosi-D) | 2.1 |
| 2 | CD18 (Eshoo-D) | 2.2 |
| 3 | CD14 (Speier-D) | 2.3 |
| 4 | CD17 (Khanna-D) | 2.4 |
| 5 | CD15 (Swalwell-D) | 2.5 |
| 6 | CD52 (Peters-D) | 2.5 |
| 7 | CD49 (Levin-D) | 2.4 |
| 9 | CD48 (Rouda-D) | 2.6 |
| 10 | CD45 (Porter-D) | 2.6 |
| 12 | CD19 (Lofgren-D) | 3.0 |
| wdt_ID | Senate District | Unemployment Rate |
|---|---|---|
| 1 | SD13 (Hill-D) | 2.0 |
| 2 | SD11 (Wiener-D) | 2.3 |
| 3 | SD36 (Bates-R) | 2.5 |
| 4 | SD37 (Moorlach-R) | 2.6 |
| 5 | SD39 (Atkins-D) | 2.6 |
| 6 | SD10 (Wieckowski-D) | 2.6 |
| 7 | SD07 (Glazer-D) | 2.9 |
| 8 | SD15 (Beall-D) | 2.7 |
| 9 | SD34 (Umberg-D) | 3.0 |
| 10 | SD38 (Jones-R) | 3.0 |
| wdt_ID | Assembly District | Unemployment Rate |
|---|---|---|
| 1 | AD22 (Mullin-D) | 1.9 |
| 2 | AD16 (Bauer-Kahan-D) | 2.0 |
| 3 | AD24 (Berman-D) | 2.2 |
| 4 | AD17 (Chiu-D) | 2.2 |
| 5 | AD28 (Low-D) | 2.2 |
| 6 | AD19 (Ting-D) | 2.4 |
| 7 | AD25 (Chu-D) | 2.4 |
| 8 | AD78 (Gloria-D) | 2.5 |
| 9 | AD73 (Brough-R) | 2.4 |
| 10 | AD77 (Maienschein-R) | 2.5 |
Highest
| wdt_ID | Congressional District | Unemployment Rate |
|---|---|---|
| 5 | CD44 (Barragan-D) | 6.2 |
| 7 | CD51 (Vargas-D) | 7.9 |
| 8 | CD09 (McNerney-D) | 6.0 |
| 9 | CD16 (Costa-D) | 10.3 |
| 12 | CD21 (Cox-D) | 10.9 |
| 13 | CD10 (Harder-D) | 6.2 |
| 15 | CD03 (Garamendi-D) | 5.6 |
| 17 | CD20 (Panetta-D) | 8.5 |
| 18 | CD23 (McCarthy-R) | 8.2 |
| 19 | CD22 (Nunes-R) | 8.0 |
| wdt_ID | Senate District | Unemployment Rate |
|---|---|---|
| 1 | SD14 (Hurtado-D) | 12.2 |
| 2 | SD12 (Caballero-D) | 9.1 |
| 3 | SD17 (Monning-D) | 5.5 |
| 4 | SD04 (Nielsen-R) | 5.3 |
| 5 | SD05 (Galgiani-D) | 6.4 |
| 6 | SD08 (Borgeas-R) | 6.5 |
| 7 | SD30 (Mitchell-D) | 5.2 |
| 8 | SD16 (Grove-R) | 7.4 |
| 11 | SD35 (Bradford-D) | 5.3 |
| 12 | SD40 (Hueso-D) | 6.8 |
| wdt_ID | Assembly District | Unemployment Rate |
|---|---|---|
| 1 | AD13 (Eggman-D) | 7.1 |
| 2 | AD29 (Stone-D) | 7.0 |
| 6 | AD30 (Rivas-D) | 7.1 |
| 7 | AD23 (Patterson-R) | 7.2 |
| 9 | AD34 (Fong-R) | 7.3 |
| 10 | AD56 (Garcia-D) | 9.2 |
| 13 | AD26 (Mathis-R) | 11.2 |
| 14 | AD32 (Salas-D) | 11.1 |
| 15 | AD31 (Arambula-D) | 10.1 |
| 16 | AD21 (Gray-D) | 9.3 |
Employment Growth by Region
Containing 19.5% of the state’s population, the Bay Area has accounted for 36.6% of net employment growth compared to pre-recession levels. Los Angeles Region, with 28.9% of the population, accounted for only 21.4% of net employment gains. Inland Empire remains the third highest under the revised county labor force and population numbers, while Central Valley now shows equivalent growth across both metrics.
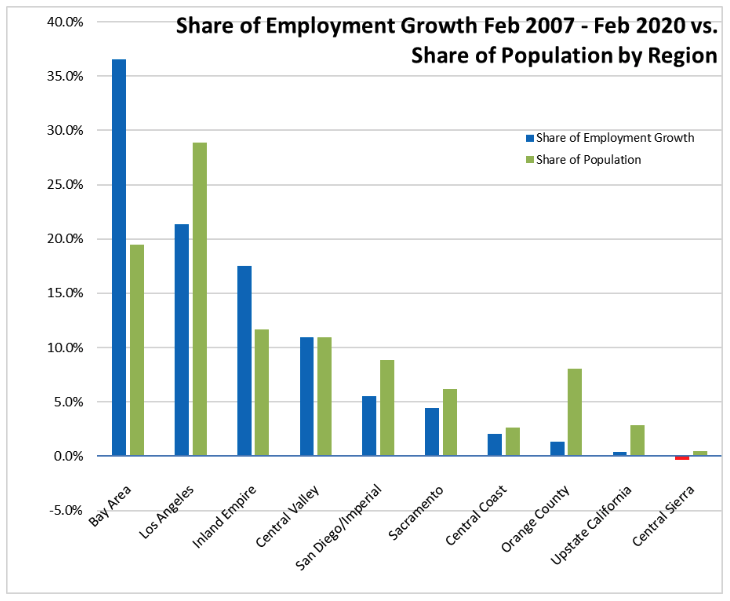
Figure Source: California Employment Development Department; Department of Finance
MSAs with the Worst Unemployment Rates
Of the 21 Metropolitan Statistical Areas (MSAs) with the worst unemployment rates in January 2020, 11 are in California, including El Centro MSA (Imperial County) which continues with Great Depression-era levels of unemployment that are 8 times worse than in San Mateo, the county with the lowest unemployment rate.
| wdt_ID | MSA | Unemp. | Rank |
|---|---|---|---|
| 1 | El Centro MSA | 18.8 | 389 |
| 2 | Visalia-Porterville MSA | 11.0 | 386 |
| 3 | Merced MSA | 9.8 | 385 |
| 4 | Salinas MSA | 9.7 | 384 |
| 5 | Hanford-Corcoran MSA | 9.4 | 383 |
| 6 | Bakersfield MSA | 8.6 | 382 |
| 7 | Fresno MSA | 8.1 | 379 |
| 8 | Madera MSA | 8.1 | 379 |
| 9 | Yuba City MSA | 8.0 | 377 |
| 10 | Stockton-Lodi MSA | 6.7 | 370 |
| 11 | Modesto MSA | 6.6 | 368 |
Figure Source: US Bureau of Labor Statistics, January 2018 data