Highlights for policy makers:
- COVID-19 and the State Economy
- Employment: 1.253 Million Below Recovery
- Labor Force Participation Rate Rises to 60.9%
- Employment Growth Ranking
- Nonfarm Jobs: 1.662 Million Below Recovery
- Jobs Change by Industry
- Employment Recovery by Region
- Unemployment Rates by Legislative Districts
- Unemployment Rates by Region
- How Far Back Has the Economy in Each County Been Pushed?
- MSAs with the Worst Unemployment Rates: Los Angeles 8th Worst in Nation
COVID-19 and the State Economy
In addition to reflecting the final results from the annual data revision process, the February jobs and labor force data also provide the second to the last snapshot of the state’s economy under the state lockdowns. The April numbers to be published in May presumably will be the first to show the state under its initial steps towards recovery.
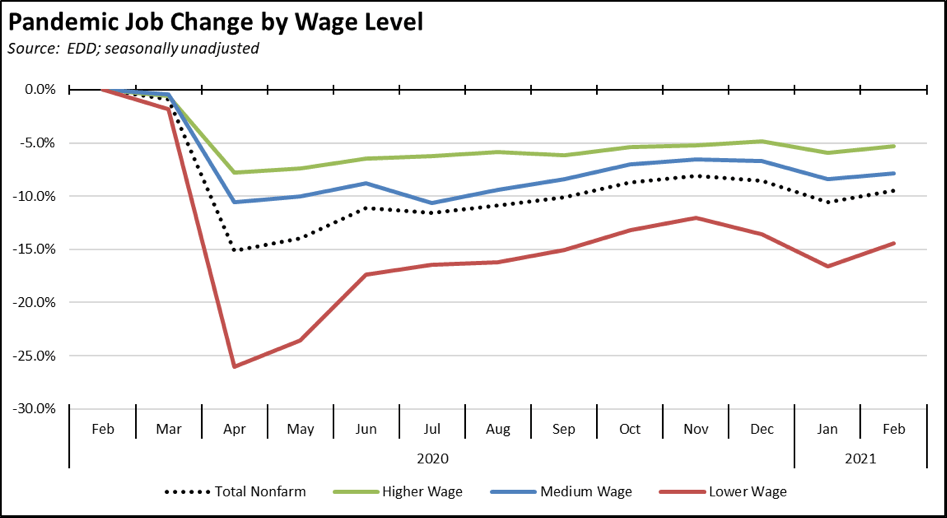
Both the job and labor force numbers while showing significant gains—with the employment results higher—still largely counter the sharp drops seen in the January results stemming from the state shelter-in-place orders. Both also fall below the previous COVID-period highs experienced last November prior to the last round of the state’s restrictions.
Job growth was seen across wage levels. While the lower-wage industries experienced the greatest growth, this wage level also continues to experience the greatest losses from the series of state restrictions. In the chart, higher-wage jobs are those industries with average annual wages above $100,000; medium wage is $50,000 to $100,000; and lower-wage is below $50,000. Job data is drawn from the industry classifications, unadjusted job numbers, and wage levels shown in the regular report section below on Nonfarm Jobs.
Personal Income Rises for the Year
In spite of the severe drop in jobs, the recent release from the US Bureau of Economic Analysis shows total and per capita personal income rising during the year (percentage shown for each quarter is the annualized change compared to the same quarter in the prior year). This outcome stems primarily from two factors.
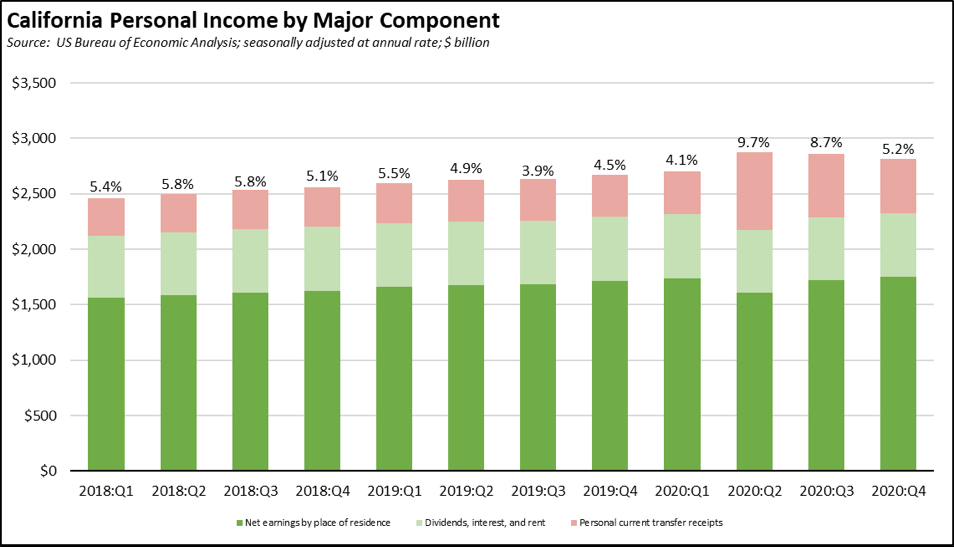
First, the rapid adoption of telecommuting by employers and workers maintained and in some cases even expanded jobs and net earnings well above what was previously expected. This income component only dipped in the 2nd quarter initial period of the pandemic. In the 4th quarter results, net earnings by themselves grew 2.2% over the year.
Second, the increase in federal transfer payments—in particular higher and new unemployment benefits and the tax credit payments along with other higher benefits in the various COVID bills—pushed income growth well above prior years in the 2nd and 3rd quarters, with total personal income ending the year at a 5.2% growth. The effects of government transfer payments, however, was more distributional, accruing heavily to the lower-wage households most affected by the state’s pandemic strategies.
Compared to the other states, California ranked 14th highest in total personal income growth in 2020.
California Ranked 32nd in GDP Growth in the 4th Quarter
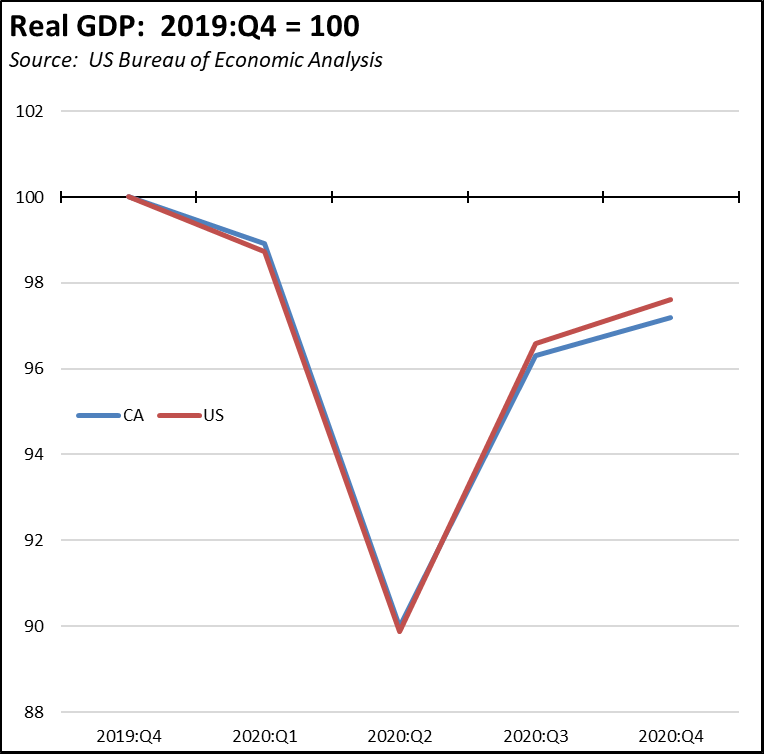
A similar release on 2020 real GDP indicates substantial progress towards but not yet full recovery for the state and the nation. Measured by change from the last quarter in 2019, relative changes in both the state and the US numbers tracked closely in the first three quarters of 2020. Some divergence than occurred in the 4th quarter, with California down 2.8% compared to the same period in 2019, and the nation as a whole down 2.4%. Compared to the other states, California ranked 15th for real GDP growth over the year, but 32nd for growth in the 4th quarter.
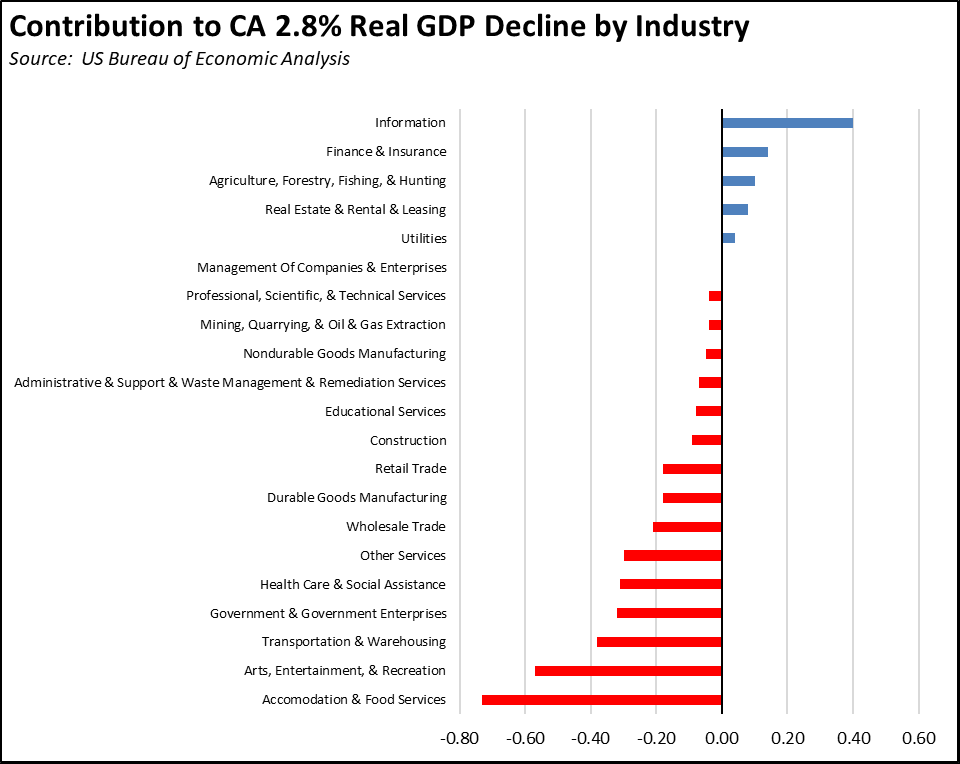
Overall, four industries produced a positive contribution to the state’s real GDP in 2020 (e.g., Information had a positive contribution of 0.40 percentage point to the overall 2.8% decline), with the highest contractions coming from two industries hit hardest by the state’s pandemic strategies—Accommodation & Food Services and Arts, Entertainment & Recreation—along with Transportation & Warehousing which was affected substantially by the early disruptions to trade and continued lower levels of exports.
CaliFormer Businesses: Update
Additional CaliFormer companies identified since our last monthly report are listed in the chart below. While most of these moved some or all of their operations in 2021, some did in 2018 – 2020 but were not covered in our prior listings.
CaliFormers Update
| wdt_ID | Companies | From | To | Reason | Source |
|---|---|---|---|---|---|
| 2 | Anomalie | San Francisco | Phoenix | Move HQ | Read More |
| 3 | Arctic Wolf | Sunnyvale | Minnesota | Move HQ | Read More |
| 4 | Aerojet-Rocketdyne | Sacramento | Alabama | Move HQ and manufacturing | Read More |
| 5 | Baswood | Santa Barbara | Dallas | Move HQ | Read More |
| 6 | BiloQ | Santa Barbara | Atlanta | Move HQ | Read More |
| 7 | C2 Wireless | Irvine | Dallas | Consolidate distribution centers | Read More |
| 8 | California Precision Products (FlexMet Inc.) | San Diego | Tennessee | Move HQ and manufacturing | Read More |
| 9 | Chip 1 Exchange | Lake Forest | Fort Worth | Move HQ | Read More |
| 10 | DealerSocket | San Clemente | Dallas | Move HQ | Read More |
| 11 | DJO Global | San Diego | Dallas | Move HQ | Read More |
| Companies | From | To | Reason | Source |
Additional high income taxpayers moving out of the state include the following:
| wdt_ID | High-Income Taxpayers | Company | To | Source |
|---|---|---|---|---|
| 2 | Bob Ackerman | Allegis Capital | Wyoming | Read More |
| 6 | Peter Attia | Podcaster | Austin | Read More |
| 7 | Jim Breyer | Breyer Capital | Austin | Read More |
| 8 | Tim Ferriss | Podcaster | Austin | Read More |
| 9 | Logan Paul | YouTube influencer | Puerto Rico | Read More |
| 10 | Gene Simmons | Kiss | Nevada | Read More |
CaliFormers Update: Housing
The extent and duration of migration of businesses and telecommuting workers out of the state remains to be determined, especially in a post-pandemic period when such moves would be easier to do and telecommuting work arrangements become more standard.
From the initial data, some studies have indicated that worker moves during the pandemic months of 2020 especially from Bay Area tech workers were more likely to be to outer regions in California than to other states. One of the more immediate consequences of this pattern has been to export Bay Area housing price appreciation to these new worker locations, raising home and rental costs in areas lacking Bay Area levels of salaries.
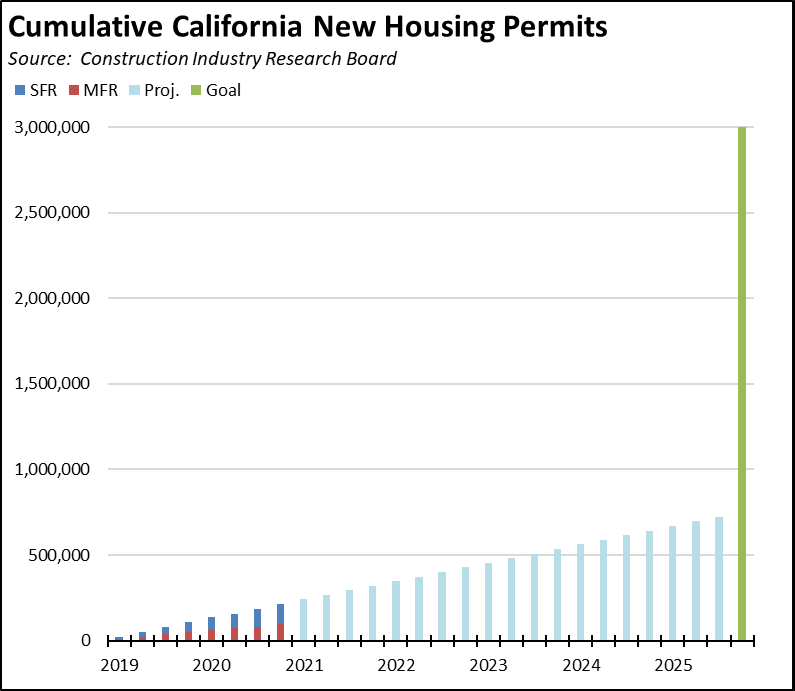
The continuing cause of rising housing costs—now being experienced even during a severe recession—is lack of supply. In the most recent results from the Construction Industry Research Board, total new housing permits reached only 104,554 in 2020, or less than half of what is required simply to maintain pace with population growth. The 2020 results were also little changed from the prior years, down only 5% from the 2019 level, which in turn was down 6% from the total in 2018. At the current trend, the cumulative total of new housing permits would reach only 750,000 by the end of 2025, or only a quarter of the governor’s goal of 3 million new units.
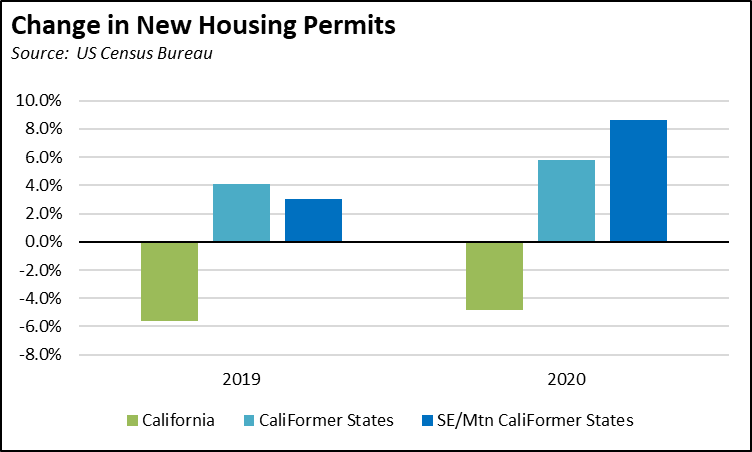
The CaliFormer destination states in contrast are expanding housing supply more quickly even during the 2020 pandemic year. Comparing Census Bureau data, new permits grew 5.8% in 2020 within all the CaliFormer destination states discussed in our report on the January jobs releases. Looking just at the Southeastern and Mountain destination states, permits were up 8.6%.
These new homes in the CaliFormer destination states are also more of the type of housing being sought now, in particular single family residences with interior space for home offices and distance learning and exterior space to deal better with stay-at-home directives. In California, 58% of new housing permits in 2020 were for single family residences (vs. 54% in 2018). In all CaliFormer destination states, the number was higher at 68% (vs. 64%), and in the Southeastern and Mountain states, 72% (vs. 68%).
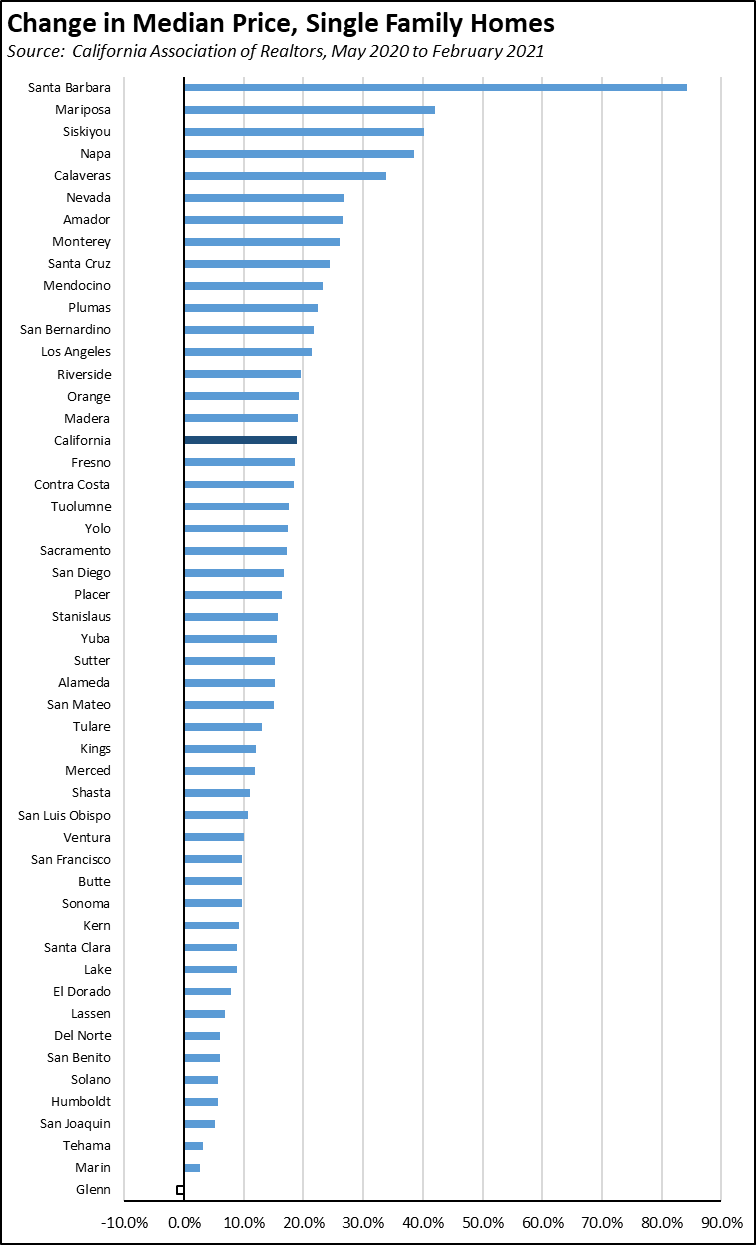
This continuing supply shortfall in California combined with the new sources of demand coming from workers leaving the Bay Area—especially for larger homes with office space for telecommuting workers and quiet space for distance learning students—has put upward pressure on prices. In the most recent data from California Association of Realtors for February, median price for existing single family homes grew 18.9% compared to the pandemic-period low in May. The outcomes ranged from a small price drop in Glenn County to an 84.2% rise in Santa Barbara (Mono at 175% is treated as an outlier and is not included in the graph). For comparison, the median price in pre-pandemic 2019 grew only 10.3% for the state.
Prices are rising in other states as well, due both to demand for more space by telecommuting workers and rising prices for construction materials in particular imported materials. But the housing permit data indicates builders in the destination states are able to increase supply to help meet demand while supply additions continue to shrink in this state.
Employment: 1.253 Million Below Recovery
EDD reported that employment (seasonally adjusted; February preliminary) grew 345,600 from the revised January numbers, while the number of unemployed dropped 69,600.
The official number of unemployed, however, counts only those remaining within the labor force and looking for work. Comparing employment and unemployment to pre-pandemic February 2020 numbers, there are another 489,000 California workers who have left the workforce.
The reported unemployment rate dipped 0.5 point to 8.5%. The unadjusted rate was 4.1 points worse than the year earlier at 8.4%.
California’s situation relative to the rest of the states eased only slightly, tying with Connecticut for the 3rd highest unemployment rate. Unemployment rates in the other states were as low as 2.9% in South Dakota and 3.3% in Idaho.
Total US employment gained 208,000. The number of unemployed dropped by 156,000. The reported unemployment rate improved 0.1 point to 6.2%.
Figure Sources: California Employment Development Department; US Bureau of Labor Statistics
Compared to the February 2020 numbers (seasonally adjusted) just prior to the current crisis and not accounting for population changes, the employment shortfall in California dropped to 1.253 million below recovery.
Labor Force Participation Rate Rises to 60.9%
The employment upsurge in the preliminary estimates produced substantial improvement in the labor force participation rate to 60.9%, closing the gap with the national rate to a half percentage point. The rate remains well below the pre-pandemic level of 62.5%, which in turn was down from prior years. As indicated in the chart, California’s relatively younger population along with a rapid shift of women into the labor force contributed to a much higher labor force rate and jobs/economic growth in the 1980s. The state has since then generally lagged the rest of the country, with labor force recovery taking longer with each subsequent recession as skills became outdated through long term unemployment and as the economy in each period was restructured with some segments relocating to other states and overseas.
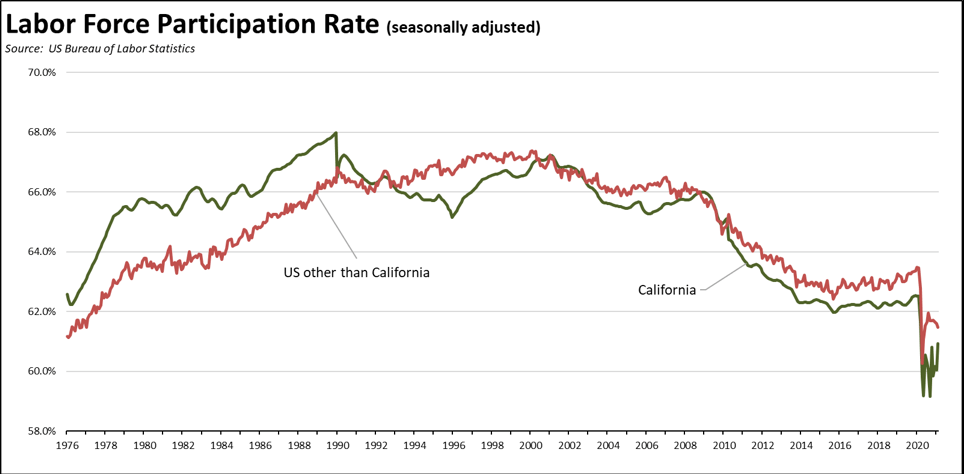
In the current circumstances, participation rates were dropping in both California and the other states prior to the pandemic, but with the rest of the country beginning to see stronger re-entry as the economy grew and labor shortages bid up wages. California, however, remained largely level with a growing gap, with at least a portion due to the continuing shift of employer resources from wages to compliance with the increasing rules on employing workers in this state.
The consequences for poverty income and income inequality stem from the decline of available workers per household. A household with one worker earning $40,000 a year likely has difficulty being able to afford the high costs of living in the state’s coastal cities. Two workers at this level address this situation far more quickly than any government subsidy program is able to do. Periods of isolation from the workforce also have been associated with lower life-time earnings potential, with longer term unemployment leading to lower-wages upon becoming re-employed, taking longer—up to 20 years—to catch up in earnings with non-displaced workers, and a variety of associated social and health issues that detract from displaced workers’ ability to resume household income growth.
The consequences for the economy are that economic growth requires workers contributing both to total economic output along with productivity growth that increases wages and incomes and that reduces costs of living by generating products and services at lower costs. In the current circumstances, one recent analysis estimates that two-thirds of “missing” employment in 2020 due to lower participation rates came from younger workers under 35, with men showing a 5.4 million shortfall and women 3.2 million. Youth (16-19) participation rates in particular have dropped even further. Unless countered, these work entry delays will compound over time and produce challenges to the ability of the economy to grow.
At the other end of the age scale, an increasing number of older workers are choosing retirement in the current economic circumstances. The share of working-age population not in the labor force due to retirement rose to 19.3% in the fourth quarter of 2020 from 18.5% a year earlier. Within California, the number of state worker retirements jumped 15% last year. While declining rates among younger ages reduces the flow of future productive workers, increasing retirements remove the most productive currently and present challenges of its own to the impending course of recovery from the current downturn.
The consequences for the state’s fiscal health are that there are far fewer workers paying in to support public services and more becoming dependent on them. Compared to the recent high in 2000, the February 2020 labor force participation rate translates into 2 million fewer workers and taxpayers in the state.
Employment Growth Ranking
The total number of persons employed (seasonally adjusted) over the 12 months ending in February was down 1,253,400. In terms of absolute employment loss, second highest New York lost roughly only half as many at 674,200.
Adjusted to account for differences in the size of each state economy, California over the year showed a 8.7% contraction, worse than the rest of the US with a loss of 5.2%. Ranked among the states, California rose only slightly to the 10th worst loss rate. California with 12% of the population accounted for 13% of total employment losses.
Figure Source: US Bureau of Labor Statistics
Nonfarm Jobs: 1.662 Million Below Recovery
Nonfarm jobs (seasonally adjusted) rose 141,000 in February, compared to the revised losses in January at 80,000.
Nonfarm jobs were down 1,662,000 over the year. Adjusting for population, California’s loss rate was unchanged at 48th among the states. The 12-month jobs loss rate was -9.4% compared to the rest of the US at -5.8%. California accounted for 21% of total job losses.
Figure Sources: California Employment Development
Department; US Bureau of Labor Statistics
Compared to the February 2020 numbers (seasonally adjusted) just prior to the current crisis and not accounting for population changes, nonfarm wage and salary jobs in California dropped to 1.662 million short of recovery.
Jobs Change by Industry
Using the unadjusted numbers that allow a more detailed look at industry shifts, all but three industries show contractions in the 12-month period ending in February. Industries showing the greatest contractions over the year were led by Food Services, Government, and Arts, Entertainment & Recreation. As schools remained closed through this period, losses in Government were dominated by Local Education (down 128,600).
| Not Seasonally Adjusted Payroll Jobs (1,000) | February 2020 | 12-month change | Nonfarm Growth Rank | % 12-month Change | Avg. Annual Wage |
|---|---|---|---|---|---|
| Total Farm | 355.4 | 2.6 | 0.7% | $37.4k | |
| Mining & Logging | 17.8 | -3.8 | 3 | -17.6% | $111.7k |
| Construction | 859.6 | -32.3 | 7 | -3.6% | $74.1k |
| Manufacturing | 1,242.5 | -76.8 | 14 | -5.8% | $101.0k |
| Wholesale Trade | 636.0 | -48.6 | 10 | -7.1% | $82.4k |
| Retail Trade | 1,554.0 | -78.3 | 15 | -4.8% | $39.5k |
| Utilities | 59.3 | 1.8 | 2 | 3.1% | $142.5k |
| Transportation & Warehousing | 688.9 | 24.5 | 1 | 3.7% | $61.6k |
| Information | 521.1 | -71.3 | 13 | -12.0% | $199.8k |
| Finance & Insurance | 534.6 | -8.5 | 4 | -1.6% | $140.1k |
| Real Estate & Rental & Leasing | 271.6 | -33.1 | 8 | -10.9% | $74.8k |
| Professional, Scientific & Technical Services | 1,314.6 | -46.2 | 9 | -3.4% | $131.2k |
| Management of Companies & Enterprises | 238.3 | -15.6 | 6 | -6.1% | $138.9k |
| Administrative & Support & Waste Services | 1,052.5 | -86.1 | 16 | -7.6% | $49.7k |
| Educational Services | 336.4 | -67.5 | 12 | -16.7% | $58.6k |
| Health Care | 1,556.6 | -59.5 | 11 | -2.4% | $71.3k |
| Social Assistance | 851.4 | -14.9 | 5 | -1.7% | $22.1k |
| Arts, Entertainment & Recreation | 169.7 | -160.8 | 19 | -48.7% | $66.2k |
| Accommodation | 121.1 | -117.6 | 17 | -49.3% | $41.3k |
| Food Services | 1,040.7 | -418.4 | 21 | -28.7% | $24.5k |
| Other Services | 449.7 | -139.2 | 18 | -23.6% | $44.0k |
| Government | 2,421.5 | -214.0 | 20 | -8.1% | $74.8k |
| Total Nonfarm | 15,937.9 | -1,666.2 | -9.5% | ||
| Total Wage & Salary | 16,293.3 | -1,663.6 | -9.3% | ||
Figure Source: California Employment Development Department;
Wages based on most recent Quarterly Census of Employment & Wages
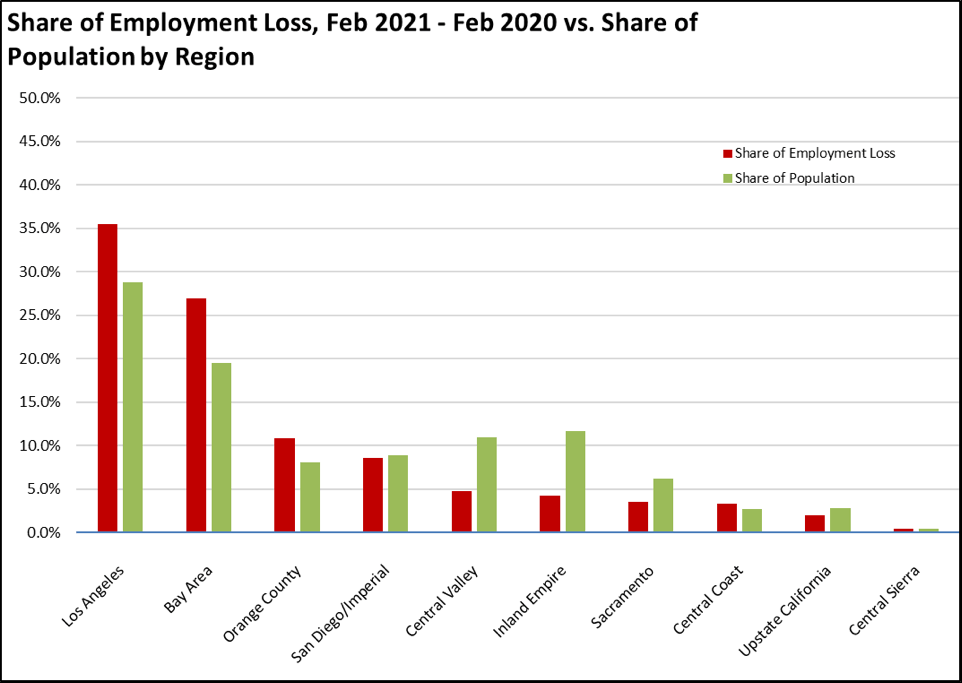
Employment Recovery by Region
In part reflecting the annual data revisions released by EDD, both the Los Angeles and Bay Area regions contained a higher share of employment losses (since pre-pandemic February 2020) relative to their populations.
Unemployment Rates by Legislative Districts
The highest and lowest estimated unemployment rates in February are shown below. The legislative district estimates have been updated to reflect both EDD’s revisions to the unemployment data and the most current factors from the American Community Survey.
Lowest
| wdt_ID | Congressional District | Unemployment Rate |
|---|---|---|
| 2 | CD18 (Eshoo-D) | 4.4 |
| 3 | CD17 (Khanna-D) | 5.3 |
| 4 | CD52 (Peters-D) | 5.6 |
| 5 | CD15 (Swalwell-D) | 5.6 |
| 6 | CD14 (Speier-D) | 5.7 |
| 7 | CD12 (Pelosi-D) | 5.5 |
| 9 | CD49 (Levin-D) | 6.0 |
| 10 | CD02 (Huffman-D) | 6.1 |
| 12 | CD19 (Lofgren-D) | 6.2 |
| 13 | CD45 (Porter-D) | 6.2 |
| wdt_ID | Senate District | Unemployment Rate |
|---|---|---|
| 2 | SD13 (Becker-D) | 4.8 |
| 3 | SD15 (Cortese-D) | 5.5 |
| 4 | SD10 (Wieckowski-D) | 5.8 |
| 5 | SD39 (Atkins-D) | 5.8 |
| 6 | SD36 (Bates-R) | 5.9 |
| 7 | SD01 (Dahle-R) | 6.4 |
| 8 | SD11 (Wiener-D) | 5.9 |
| 9 | SD37 (Min-D) | 6.2 |
| 10 | SD02 (McGuire-D) | 6.4 |
| 11 | SD07 (Glazer-D) | 6.6 |
| wdt_ID | Assembly District | Unemployment Rate |
|---|---|---|
| 2 | AD28 (Low-D) | 4.4 |
| 3 | AD24 (Berman-D) | 4.8 |
| 4 | AD22 (Mullin-D) | 4.9 |
| 5 | AD16 (Bauer-Kahan-D) | 4.9 |
| 6 | AD73 (Davies-R) | 5.7 |
| 7 | AD78 (Ward-D) | 5.5 |
| 8 | AD25 (Lee-D) | 5.4 |
| 9 | AD06 (Kiley-R) | 5.4 |
| 10 | AD17 (Chiu-D) | 5.7 |
| 11 | AD77 (Maienschein-D) | 5.7 |
Highest
| wdt_ID | Congressional District | Unemployment Rate |
|---|---|---|
| 2 | CD43 (Waters-D) | 10.8 |
| 3 | CD37 (Bass-D) | 10.9 |
| 4 | CD28 (Schiff-D) | 11.1 |
| 5 | CD34 (Gomez-D) | 12.0 |
| 6 | CD16 (Costa-D) | 11.9 |
| 7 | CD32 (Napolitano-D) | 11.0 |
| 9 | CD21 (Cox-D) | 12.3 |
| 10 | CD51 (Vargas-D) | 12.4 |
| 12 | CD40 (Roybal-Allard-D) | 13.1 |
| 13 | CD44 (Barragan-D) | 14.5 |
| wdt_ID | Senate District | Unemployment Rate |
|---|---|---|
| 2 | SD22 (Rubio-D) | 9.9 |
| 3 | SD12 (Caballero-D) | 10.8 |
| 4 | SD18 (Hertzberg-D) | 10.9 |
| 5 | SD24 (Durazo-D) | 12.1 |
| 6 | SD21 (Wilk-R) | 11.5 |
| 7 | SD40 (Hueso-D) | 11.3 |
| 9 | SD35 (Bradford-D) | 12.1 |
| 10 | SD30 (vacant) | 12.4 |
| 12 | SD33 (Gonzalez-D) | 12.5 |
| 13 | SD14 (Hurtado-D) | 13.4 |
| wdt_ID | Assembly District | Unemployment Rate |
|---|---|---|
| 2 | AD53 (Santiago-D) | 11.3 |
| 3 | AD31 (Arambula-D) | 12.1 |
| 4 | AD46 (Nazarian-D) | 12.1 |
| 5 | AD32 (Salas-D) | 12.6 |
| 6 | AD36 (Lackey-R) | 12.5 |
| 7 | AD56 (Garcia-D) | 12.1 |
| 9 | AD63 (Rendon-D) | 13.4 |
| 10 | AD51 (Carrillo-D) | 13.6 |
| 12 | AD64 (Gipson-D) | 14.1 |
| 13 | AD59 (Jones-Sawyer-D) | 14.2 |
Unemployment Rates by Region
Unemployment rates (not seasonally adjusted) continued to reflect the regional mix of jobs that have been retained through telework compared to relative shares of lower-wage services and tourism jobs that have been hit the hardest by the state-ordered closures and other restrictions.
| wdt_ID | Region | Unemployment Rates |
|---|---|---|
| 2 | California | 8.4 |
| 6 | Bay Area | 6.1 |
| 10 | Orange County | 6.8 |
| 14 | Sacramento | 7.1 |
| 18 | San Diego/Imperial | 7.6 |
| 22 | Central Sierra | 7.8 |
| 26 | Inland Empire | 8.1 |
| 30 | Upstate California | 8.4 |
| 34 | Central Coast | 8.9 |
| 38 | Central Valley | 10.2 |
| 39 | Los Angeles | 10.4 |
Figure Source: California Employment Development Department
How Far Back Has the Economy in Each County Been Pushed?
As an indication of the severity of the current economic downturn, the following chart illustrates how much economic ground each county has lost using employment levels as the measure. Based on annual averages, the chart below indicates the last year each county saw the February employment numbers. Because the current series only goes back to 1990 for most counties, several of the entries indicate “Before 1990.” Los Angeles County is the exception, with data going back to 1976. The “Change” column indicates the change from April, the month reflecting the effects of the initial round of closures.
| wdt_ID | County | Last Year Employment Equal To or Less Than April 2020 | Last Year Employment Equal to or Less Than February 2021 | change |
|---|---|---|---|---|
| 2 | Alameda County | 2009 | 2013 | |
| 3 | Alpine County | 2009 | 2018 | |
| 4 | Amador County | 1997 | 2015 | |
| 5 | Butte County | 1998 | 1999 | |
| 6 | Calaveras County | 2012 | 2016 | |
| 7 | Colusa County | 1999 | 2006 | |
| 8 | Contra Costa County | 1997 | 2013 | |
| 9 | Del Norte County | 1992 | 1993 | |
| 10 | El Dorado County | 1999 | 2016 | |
| 11 | Fresno County | 2012 | 2015 | |
| County | Last Year Employment Equal To or Less Than April 2020 | Last Year Employment Equal to or Less Than February 2021 | change |
MSAs with the Worst Unemployment Rates: Los Angeles 8th Worst in Nation
California had 10 of the MSAs among the 25 regions with the worst unemployment rates in January. Los Angeles-Long Beach-Anaheim MSA (Los Angeles and Orange Counties) was again dropped, recording the 8th worst in the nation.
| wdt_ID | MSA | January Unemployment Rate | US Rank out of 389 |
|---|---|---|---|
| 1 | El Centro MSA | 16.5 | 389 |
| 2 | Los Angeles-Long Beach-Anaheim MSA | 11.5 | 382 |
| 3 | Merced MSA | 11.4 | 381 |
| 4 | Visalia-Porterville MSA | 11.3 | 380 |
| 5 | Salinas MSA | 11.2 | 379 |
| 6 | Bakersfield MSA | 10.8 | 375 |
| 7 | Hanford-Corcoran MSA | 10.7 | 374 |
| 8 | Yuba City MSA | 10.2 | 372 |
| 9 | Stockton-Lodi MSA | 10.0 | 369 |
| 10 | Fresno MSA | 10.0 | 369 |