The February employment and jobs reports continued the annual revision process, with the final release of revised data for the counties starting in 2017. Our labor force estimates for the current base year 2012 legislative districts have also been revised using the new county data. Estimates for the new base year 2022 legislative districts will be completed at the end of the year following the release of the required allocation factors from the American Community Survey.
Highlights for policy makers:
- COVID-19 and the State Economy
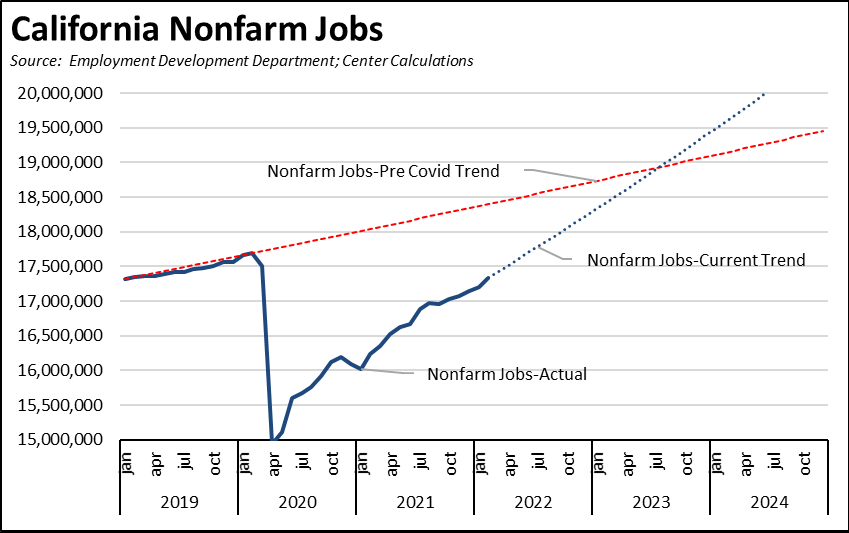
- Nonfarm Jobs: 353k Below Pre-Covid Peak
- Jobs Change by Industry
- Employment 676k Below Pre-Covid Level
- Unemployment Insurance: Illinois Becomes Latest State Using Federal Funds to Slash UI Debt
- Labor Force Participation Rate
- Unemployment Rates by Legislative Districts
- Unemployment Rates by Region
- MSAs with the Worst Unemployment Rates
- Technical Notes
COVID-19 and the State Economy
As discussed in our preliminary analysis, the preliminary results for February show some improvement over the prior months. Nonfarm jobs—again largely reflecting the continued reopening of jobs in the state, with actual growth beyond pre-pandemic levels limited to 5 industries—were up 138,100 in February compared to a relatively stable average of 61,600 in the preceding 4 months. Employment while improved remains weaker, rising an average of 103,000 over the past two months, reversing an average loss of 4,900 in the two months preceding.
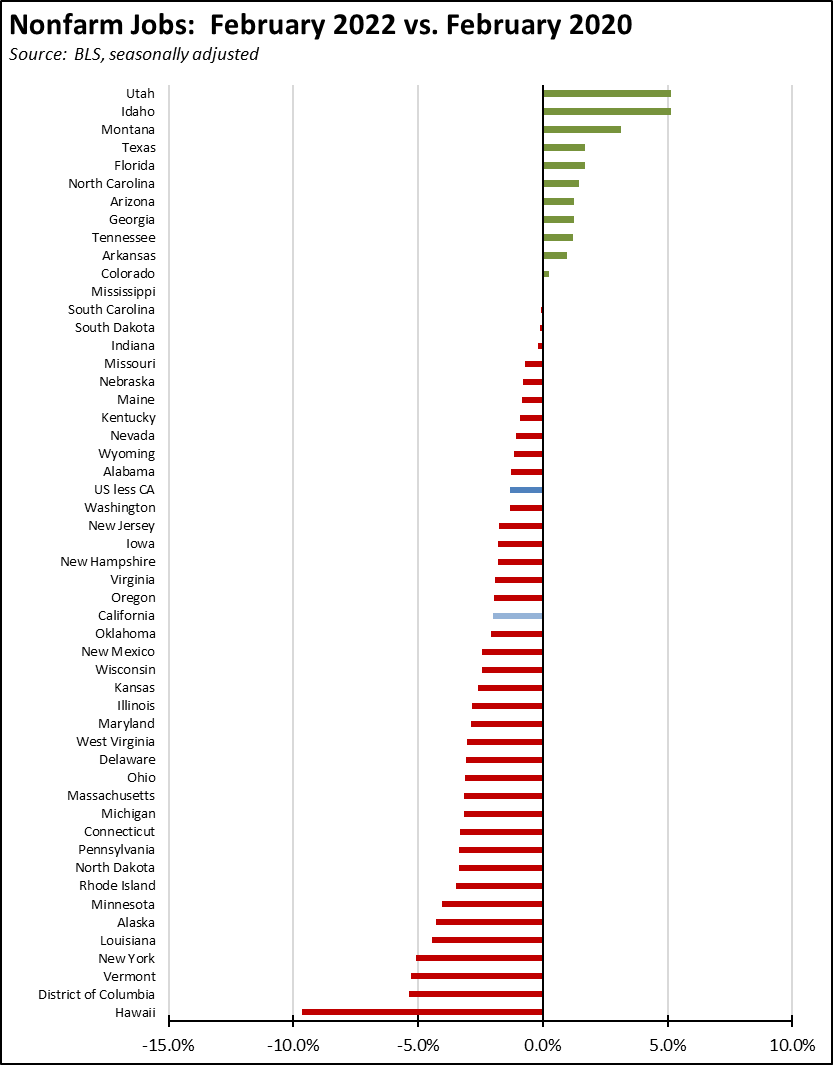
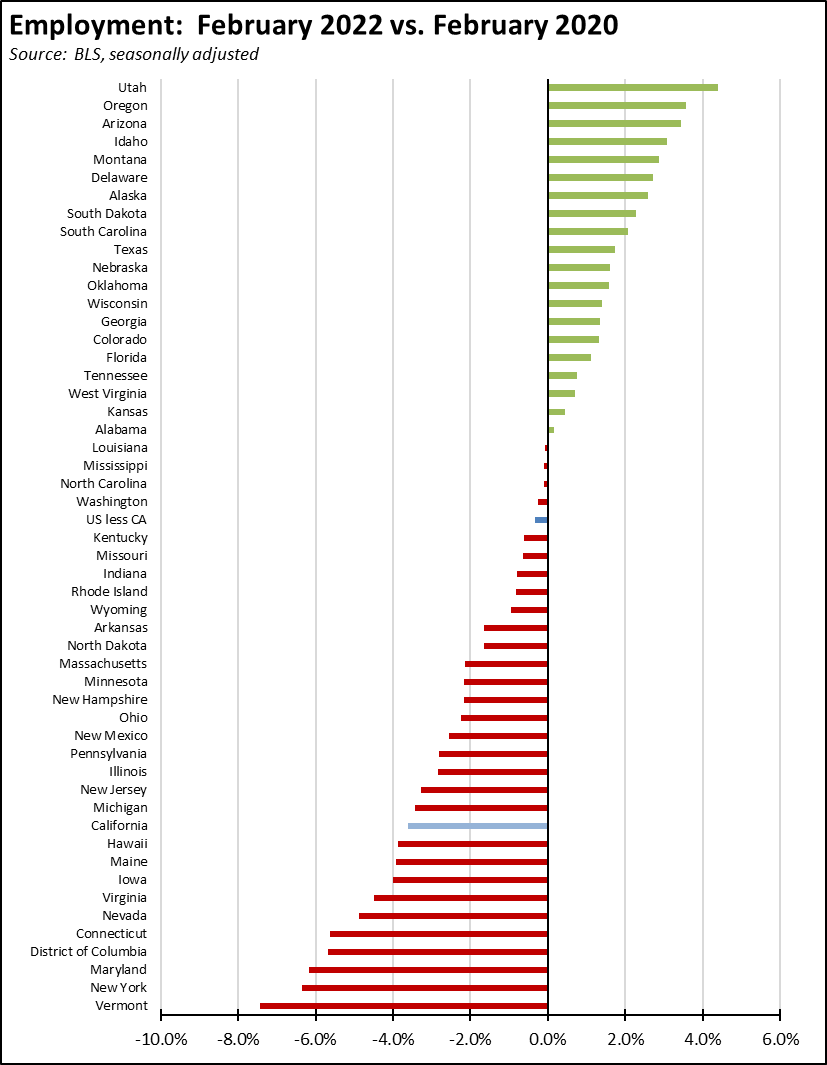
The state, however, continues to lag the rest of the nation in recovery. As measured against the pre-pandemic peak in February 2020, nonfarm jobs are still 2.0% short of recovery in California compared to 1.3% in the rest of the states. Employment is still 3.6% below compared to only 0.3% in the rest of the states. The relatively weaker results in returning people back to work is also reflected in the continuing unemployment insurance claims data, with the latest results showing California’s claims only 5% above the pre-pandemic average in 2019, but the rest of the nation showing claims that are 10% below this level. California also continues to generate more than a fifth of the new claims nationally, and a quarter of the insured unemployed (a proxy for the number of continuing claims)
In the February results for nonfarm jobs, 12 states are now at or above their pre-pandemic level, with California ranking 29th in this recovery measure. Measured by employment, 20 states now exceed the pre-pandemic peak, with California coming in 41st.
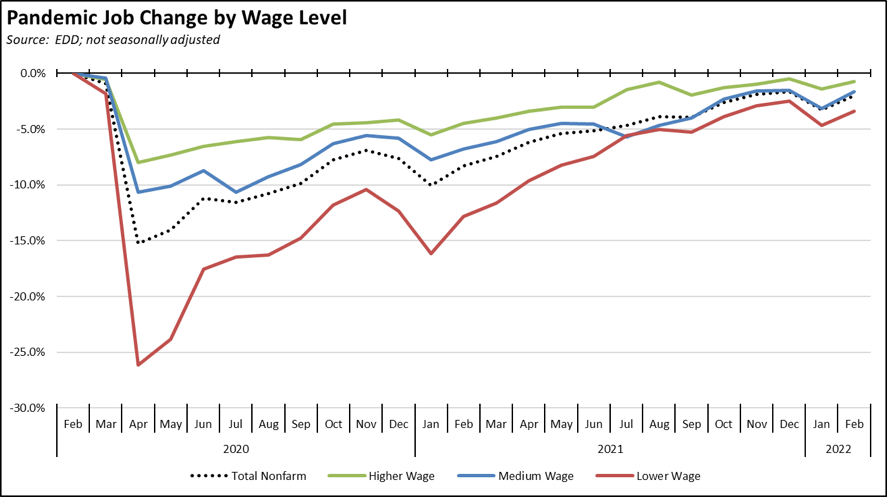
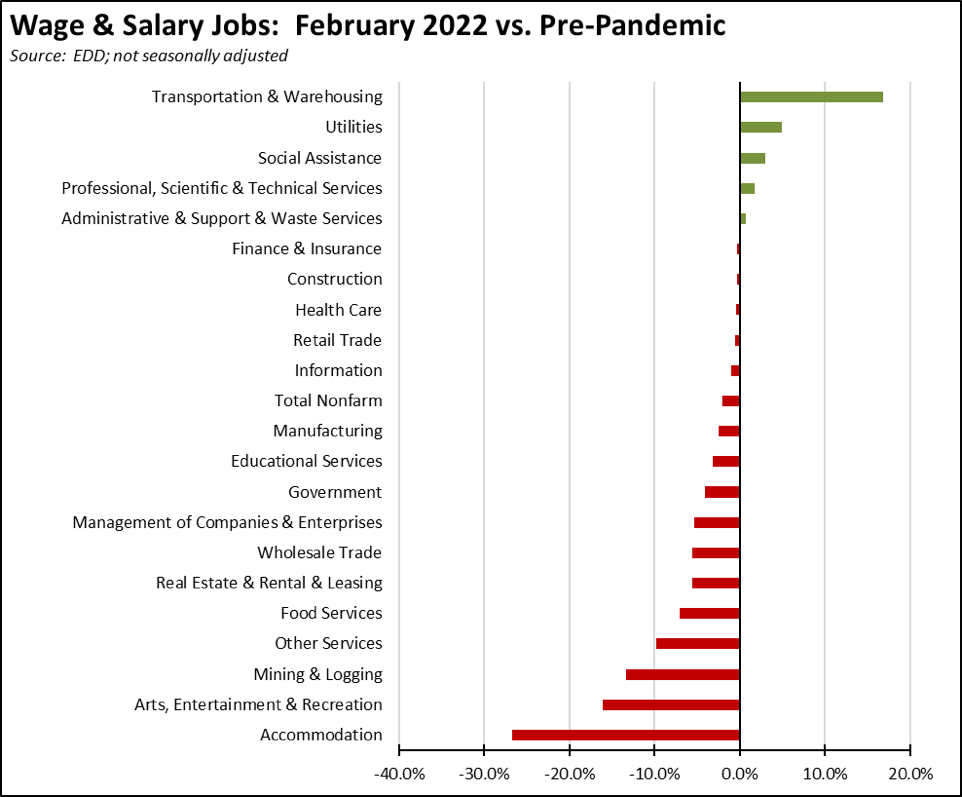
Using the unadjusted numbers, jobs by wage level continued to show the same pattern of recovery as previously reported, but with the higher wage industries now just 0.7% short of the pre-pandemic level. Medium wage industries continue to track the overall jobs change led in particular by growth in Transportation & Warehousing. Lower wage industries showed some of the strongest improvement but were still 3.4% below.
In the chart, higher wage jobs are those industries with average annual wages above $100,000; medium wage is $50,000 to $100,000; and lower wage is below $50,000. Job data is drawn from the industry classifications, unadjusted job numbers, and wage levels generally used in the regular report section below on Nonfarm Jobs.
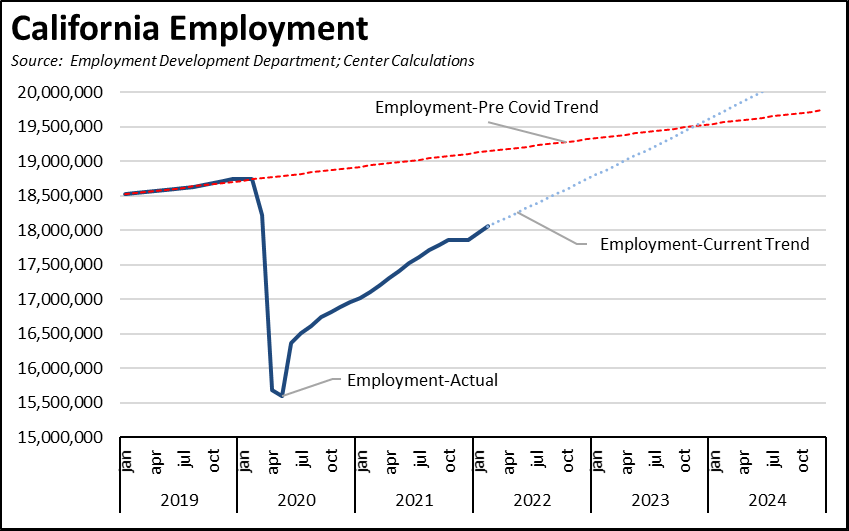
These numbers while positive, however, still just measure how much economic ground remains for the state to just get back to where it was, not back to where it was going. The increasing number of states moving beyond the pre-pandemic peaks have already begun to make this leap.
The strength of the data from the past two months is reflected by going instead to the trend data. While the weaker numbers at the end of last year showed much longer delays for a true recovery, return to the pre-pandemic trend could occur towards the end 2023 if these numbers continue rising at the rates seen over the prior three months.
There are, however, an increasing number of challenges to whether these rates can be maintained. The state’s continued policy emphasis on income assistance rather than more concerted growth in jobs especially middle class wage jobs has kept behind many other states in reaching this goal. Inflation is now adding to a cost of living that was already reaching crisis proportions even prior to the pandemic, and is likely to remain a constraint in the months ahead due to the war in Europe, the consequent sanctions, spiking energy prices, renewed factory closures in China due to Covid, and additional supply chain disruptions likely to come from a potential West Coast ports strike threatened for later this year. While various proposals are now being made to provide some immediate relief from the burdens households and employers now face from inflation in particular spiking energy prices, they continue the historic policy response of providing partial—although likely welcomed—relief only after costs become too apparent and too high rather than policy changes to prevent this harm from continuing in the future.
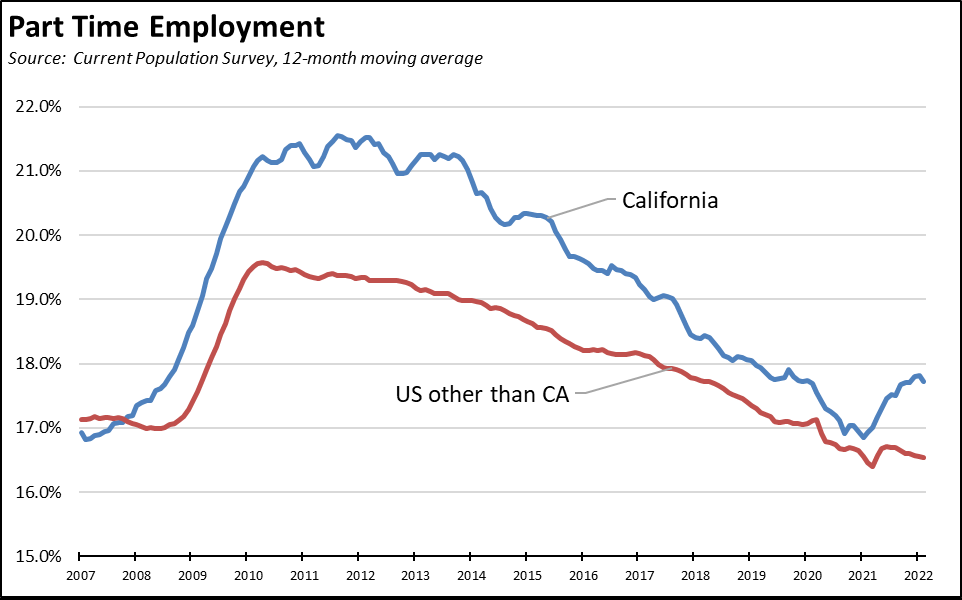
Part Time Employment
The data discussed above is based on the official numbers, but the state’s recovery lag can also be seen by going behind some of them. In particular, the employment numbers report the number of people working, but not all of them are working full time.
As indicated in the chart below, part time employment became much more of economic survival option in California during the prior Great Recession that began in 2008. Part time employment spiked much higher than in the rest of the states, rising to more than a fifth of the work force. The nature of the state’s recovery in this period also kept part time employment much higher than the rest of the nation, keeping California still above the levels in 2007 even before the current economic downturn kicked in.
The pandemic period has seen two defined trends. Part time employment dropped at the beginning of the downturn as part time jobs especially in customer contact and tourism services were closed. California’s recovery period since then has seen a sustained increase in the share working only part time, while the rest of the nation has instead continued to trend towards full time employment.
In the period leading up to the pandemic, there was little difference in the share of workers doing part time work voluntarily in California and the rest of the nation. The primary reason for the higher rate of part time employment instead comes from persons working part time for economic reasons, essentially those working part time because only part time work is available. The state’s economic recovery and the nature of that recovery continues to be shaped by the available job mix that in turn is shaped by the state’s policies.
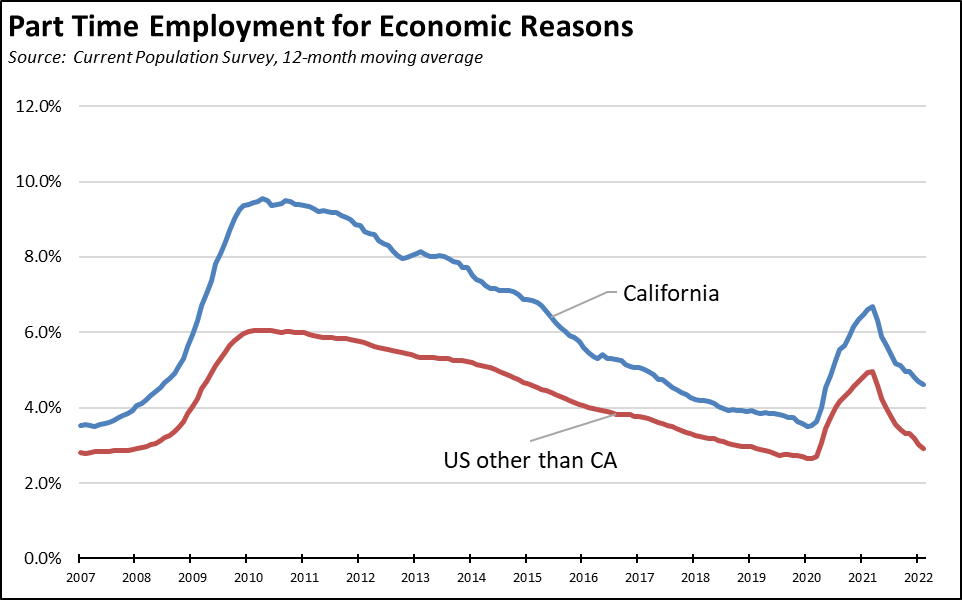
Note that in both charts, the numbers shown are 12-month moving averages is order to address statistical significance issues that would otherwise arise from using state-level monthly estimates from the Current Population Survey.
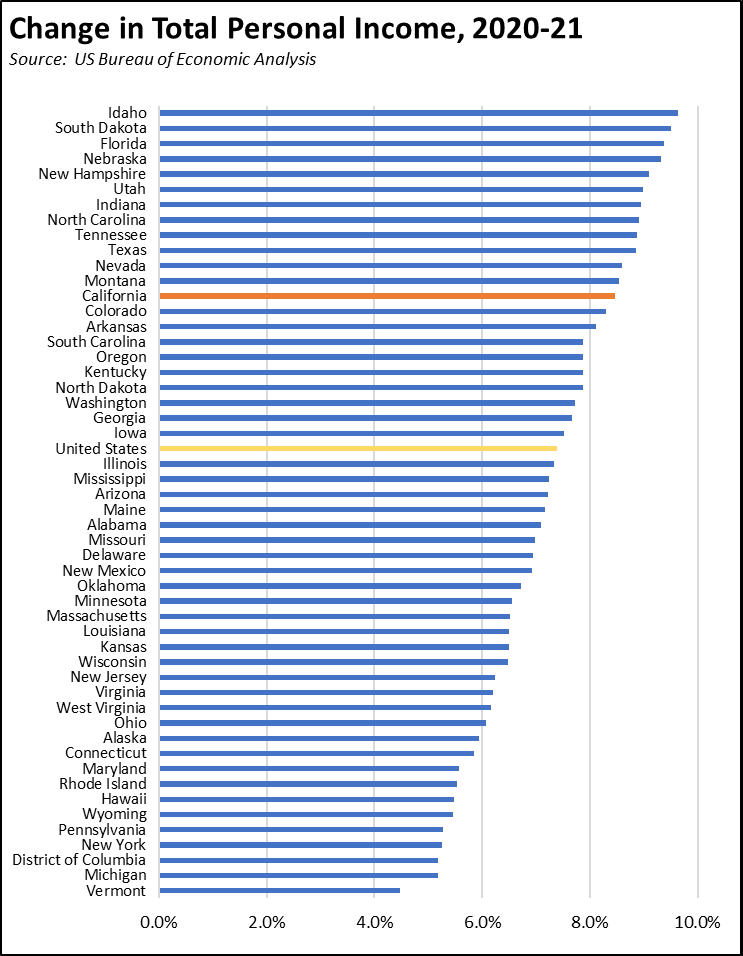
Personal Income Up 8.5% in 2021
In the most recent data from Bureau of Economic Analysis, total personal income was up 8.5% in 2021 in California, compared to an overall average of 7.4% for the US. California’s growth rate was 13th highest among the states. By comparison, California personal income grew 4.6% in 2019, compared to the US at 4.1%. The higher rates in 2021 reflect in part the high levels of pandemic era assistance payments. This factor, however, was magnified by rapid operational shifts by employers and states in the nation and the state that maintained wage and salary incomes especially for higher income workers. Along with high market returns, these factors also contributed to the high levels of tax revenues now being generated for California, the other states, and the federal government.
Nonfarm Jobs: 353k Below Pre-Covid Peak
Nonfarm wage and salary jobs were up 138,100 (seasonally adjusted) in February, while gains in January were revised to 60,300 from the previously reported 53,600.
California showed the largest monthly increase, followed by Texas at 77,800 and Florida at 51,000. The number of states at or above the February 2020 pre-pandemic peak increased from 10 to 12. California remains 353,000 behind, or 16.8% of the remaining national shortfall. Counting only those states that have yet to surpass the pre-pandemic peak, California accounts for 20.1% of the remaining shortfall.
Jobs Change by Industry
Using the unadjusted numbers that allow a more detailed look at industry shifts, the number of industries showed job levels at or exceeding the pre-pandemic February 2020 levels based on the revised data remained at 5. Transportation & Warehousing by a substantial margin shows the strongest growth as companies continue to battle the ongoing supply chain disruptions. The biggest lags in recovery continue to be the lower-wage industries that were hardest hit by the state-ordered closures along with Mining & Logging that is being targeted for job losses under current state policies.
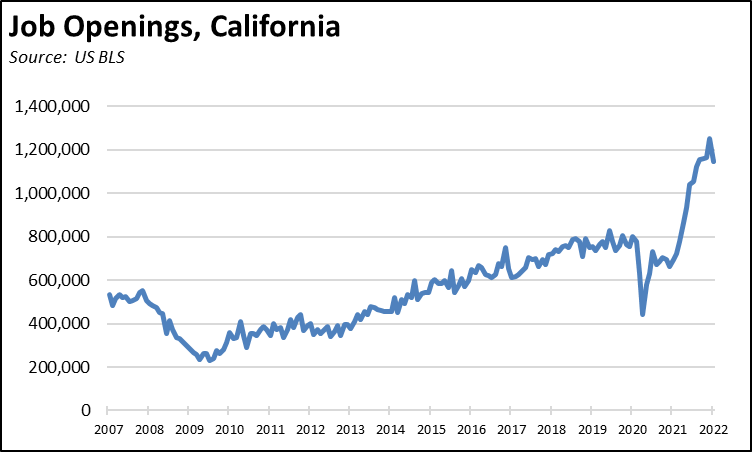
Job openings as indicated in the state estimates from the JOLTS survey data by BLS show continued easing from the December 2021 peak, an indication that labor shortages continue to be a factor holding back the state’s recovery but at a slightly diminishing rate.
Job openings, however, are also an indicator of the job expansion potential within the state over the upcoming months. The dip in job openings in January was larger than the increase in jobs. While there are many factors at play in the numbers including the differing data sources in the two series, a continuation of this outcome into a trend beyond just one month’s results would also indicate employers are beginning to react to labor shortages through other means including increasing automation and shifting of jobs such as back-office functions to locations outside the state.
Employment 676k Below Pre-Covid Level
EDD reported that employment (seasonally adjusted; February preliminary) was up 98,300 from the revised January numbers. The number of unemployed was down by 65,600.
The reported unemployment rate improved 0.3 point to 5.4%, compared to the revised 4.1% in February 2020 prior to the pandemic. California was tied with Alaska for the third-highest unemployment rate among the states. California contained 16.3% of the total number of unemployed workers in the US.
In the national numbers, total US employment rose by 548,000, and the number of unemployed was down by 243,000. The reported unemployment rate improved 0.2 point to 3.8%, further closing in on the 3.5% rate recorded in February 2020.
Figure sources: California Employment Development Department; US Bureau of Labor Statistics
In the seasonally adjusted numbers, California employment remains 676,500 (3.6%) below the pre-pandemic level in February 2020; the rest of the states combined were 0.3% below.
Unemployment Insurance: Illinois Becomes Latest State Using Federal Funds to Slash UI Debt
Incorporating the preliminary results for the week of March 26, initial claims in California averaged only 5% percent above the pre-pandemic average in 2019. In another indication of the state’s lagging recovery, however, the other states as a whole were 10% below the 2019 level. While California is now operating closer to “normal” as defined by this comparison, the results from the other states track with their more successful drive to get people back to work quickly. 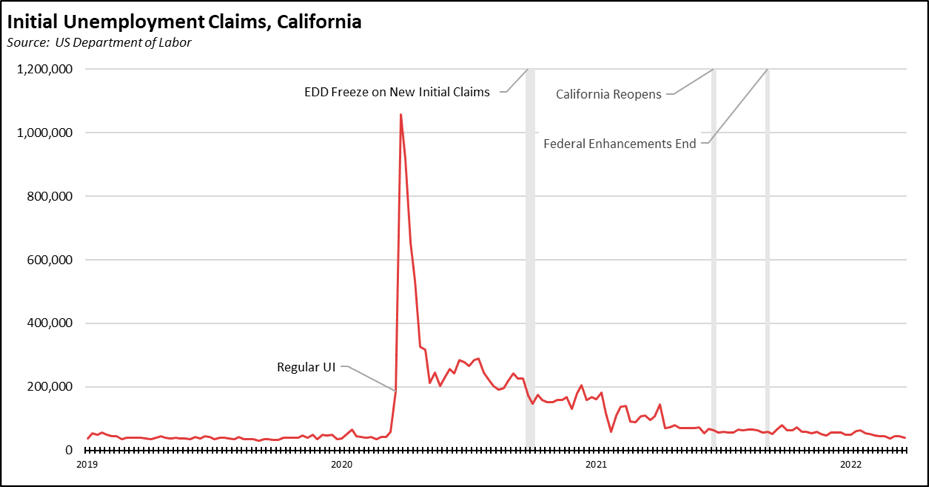
Based on the week of March 26 numbers, California contained 22% of all initial claims nationally. As of March 19, California contained 24% of the insured unemployed (a proxy for the number of continuing claims).
But while California continues to rely on the unemployment insurance funds to a far greater extent than the size of its population and economy would otherwise indicate, California also continues to be the state causing the federal fund to operate in a deficit position. As of March 28, California’s unemployment insurance fund debt increased to $19.8 billion, or 51% of the total owed by all the states and territories.
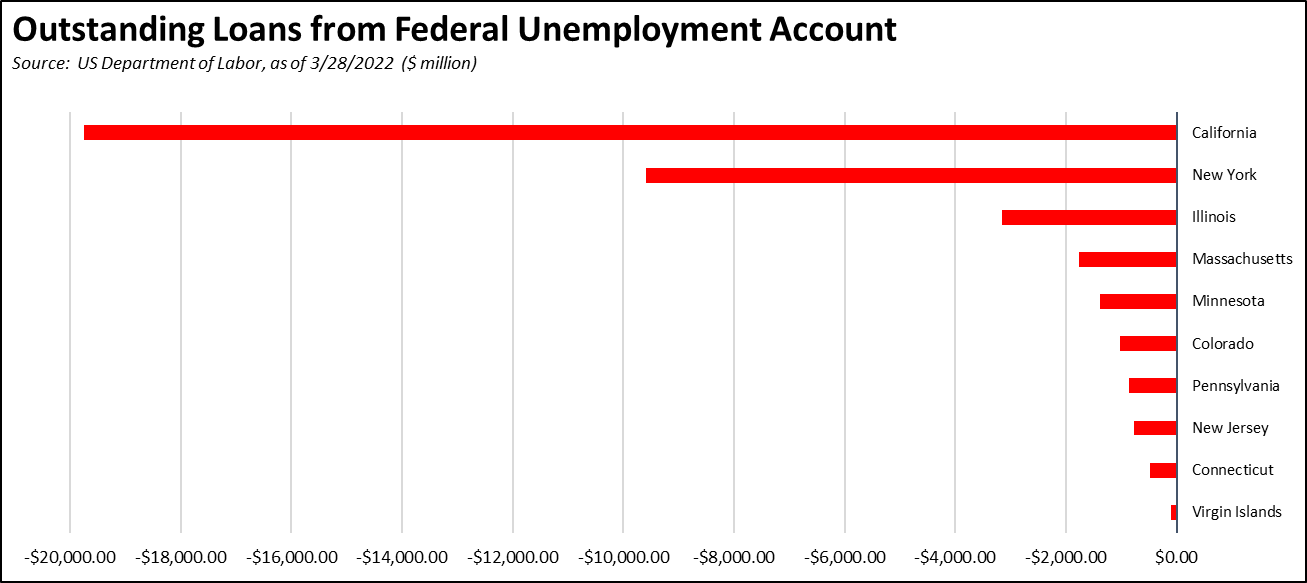
In these results, Illinois became the most recent state using its federal ARPA funds—as specifically authorized in the federal act—to pay down its federal UI debt, thereby substantially reducing the looming tax increases on its still recovering employers. Illinois paid off 60% of its previous $4.5 billion debt using these federal funds. This payment was part of an overall package to reduce total state debt by $4.1 billion, thereby increasing budget flexibility in future years. Negotiations are also continuing on how to pay off the remaining federal UI debt.
Labor Force Participation Rate
The labor force participation rate edged up 0.1 point to 61.6%, while the US number was also up 0.1 point to 62.3%. The California rate remains well below the pre-pandemic level of 62.8%, which in turn was down substantially from prior years. Accounting for workers leaving the workforce since February 2020 under the revised data, there were an estimated 1.4 million out of work in February.
Unemployment Rates by Legislative Districts
The highest and lowest estimated unemployment rates in February are shown below. The estimates are for the current, 2012 vintage districts. Estimates for the new districts under the 2022 redistricting will be released after the required factors from the American Community Survey become available at the end of the year.
Lowest
Highest
Unemployment Rates by Region
Unemployment rates (not seasonally adjusted) compared to pre-pandemic February 2020 are shown below.
Figure Source: California Employment Development Department
MSAs with the Worst Unemployment Rates
California again had 11 of the MSAs among the 25 regions with the worst unemployment rates in January, including El Centro MSA (Imperial County) with the worst unemployment rate in the nation. Los Angeles-Long Beach-Anaheim MSA remained out of this group by rising to #324 in a tie with 2 California MSAs and 2 MSAs in other states. The best performing California urban region was again San Jose-Sunnyvale-Santa Clara MSA tied with 16 other MSAs at #105, with an unemployment rate of 3.4% compared to the best performing MSA, Elkhart-Goshen, IN MSA at 1.6%.
Technical Notes
The Center’s data will be continue to be updated this month as the annual data revisions are now complete from EDD and BLS.
In addition, the final approved maps by the 2020 California Citizens Redistricting Commission have been released. The Center for Jobs will be updating the California maps and data across the website in early 2022 to reflect the new legislative district boundaries. We will continue to cover data for the current, vintage 2012 district boundaries throughout most of the year, but will begin to transition to the 2022 district data and estimates as this information is developed.