The Center for Jobs and the Economy has released our initial analysis of the February employment and labor force data. The EDD and BLS releases are again on different schedules. Data for the other states will be addressed in our Full Jobs Report after it is released by Bureau of Labor Statistics next week.
For additional information and data about the California economy visit www.centerforjobs.org/ca.
Nonfarm Jobs Fall 19,900 in the Preliminary Estimate
Nonfarm wage and salary jobs (seasonally adjusted) fell 19,900 in the preliminary estimate for February primarily because of the Kaiser worker strikes. January’s gains were revised down by 11,700 to a gain of 81,800, while the underlying not seasonally adjusted series estimate now shows a higher loss of 233,500 that month. For the year, the preliminary February seasonally adjusted numbers showed a gain of 120,500.
In addition to the continuing delays due to last year’s federal shutdowns, the nonfarm job estimates in recent months have been affected by various factors including the high seasonal adjustment factor in January, February’s strikes, and the upcoming strike effect on the March estimates as workers returned to their jobs. While additional public worker strikes may affect yet another two months’ worth of results, a more normalized estimate will not be available until the release in May.
By industry, the preliminary February numbers still show government and government-supported Healthcare & Social Services dominating the numbers. However, growth still was seen in some of the Other Private Industries, including tech-containing Information and Professional, Scientific & Technical Services along with Retail Trade and Administrative & Support & Waste Management & Remediation Services.
California Labor Force
California Labor Force
California’s reported unemployment rate (seasonally adjusted) was unchanged at 5.4%. The US rate notched up by 0.1 point to 4.4%.
Employment again fell, by 23,100 (seasonally adjusted) in February, while US employment was down by 185,000.
California unemployment edged down by 12,100, while US unemployment was up by 203,000. California unemployment has been above 1 million every month since January 2024, the highest levels since the pandemic period in 2021.
Nonfarm Jobs
Nonfarm wage and salary jobs (seasonally adjusted) in the preliminary estimate fell 19,900, resulting in a total gain of 120,500 jobs for the year
For the US as a whole, nonfarm fell a revised 133,000 in February but gained 149,000 over the year.
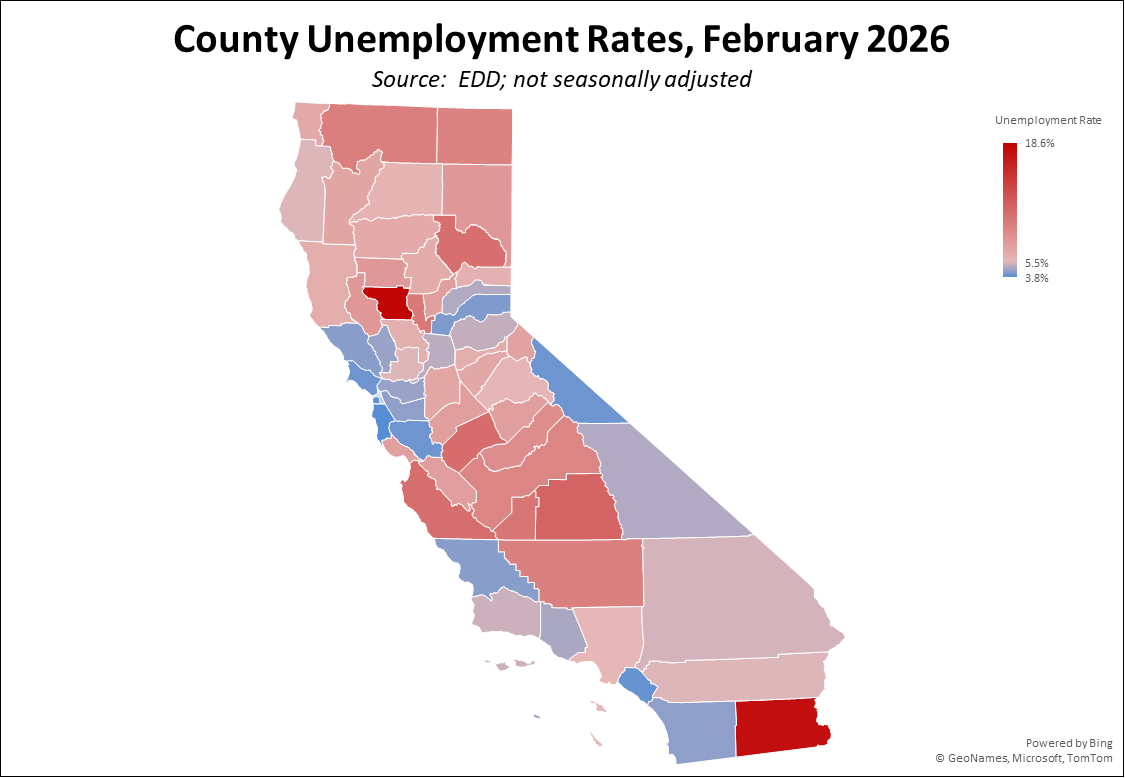
Counties with Double-Digit Unemployment
The number of counties with an unemployment rate (not seasonally adjusted) at 10% remained at 8. The unadjusted rates ranged from 3.7% in San Mateo to 18.2% in Imperial.
In the chart, counties with rates higher than the state average are coded in red.