The Center for Jobs and the Economy has released our full analysis of the April Employment Report from the California Employment Development Department. For additional information and data about the California economy visit www.centerforjobs.org/ca
Highlights for policy makers:
- Economic Projections & the State Budget Problem: Slower Growth Ahead
- JOLTS Tracking with Finance Projections
- Tourism Spending Up in 2023 but Jobs Still Short of Recovery
- California Generates 21% of National Unemployment Insurance Claims
Economic Projections & the State Budget Problem: Slower Growth Ahead
Most responses to the May Revise have appropriately focused on the revenue effects coming from the state’s extreme reliance on the tax returns of a relatively small number of high-income taxpayers. In the most recent 2021 data from Franchise Tax Board, the 0.9% of taxpayers with adjusted gross income of $1 million or more paid 49.2% of total personal income tax. Of these, the 8,519 taxpayers (0.05%) with AGI of $10 million or more paid 24.4%. Changes in economic circumstances affecting this small number of taxpayers—especially drops in capital gains income or migration out of the state—consequently can have outsized effects on available state revenues and indirectly through the various subventions, local revenues as well.
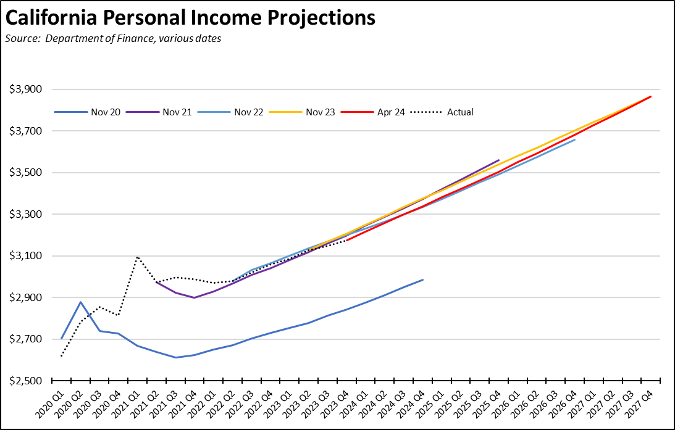
Less discussed is the administration’s expected slowing in the state economy. The charts below draw from the economic projections prepared by Department of Finance to underpin their revenue estimates. Projections from November are used to craft the Proposed Budget issued each January. The April projections become the base for revising revenue numbers in the May Revise. The changing projections in large part help illustrate how the state went from an expected $97 billion surplus in the 2022 May Revise to the current revenue shortfall numbers. As indicated in the charts:
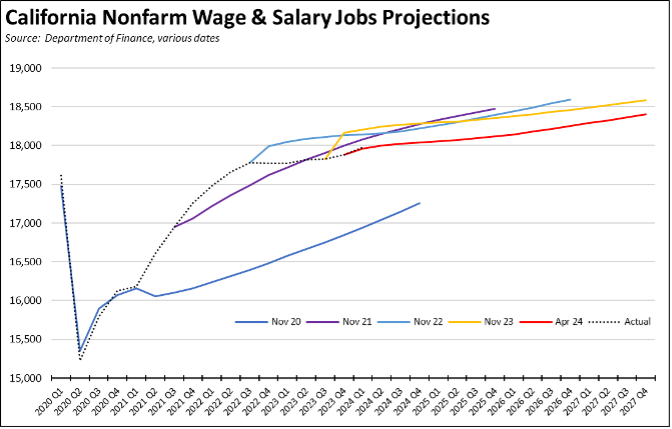
Nonfarm wage and salary job projections have become progressively lower, with the most recent April 2024 numbers now expecting jobs to grow at an average of 13,100 a month in 2024, a level that already has been missed by the 10,600 average to date for the first 4 months of the year. The pace of jobs growth is expected to slow to about half in 2025 (6,600 a month) but rebound somewhat in 2026 (11,100 a month) and 2027 (12,900 a month). All of these numbers, however, would remain well below the 20,800 monthly average posted in pre-pandemic 2019.
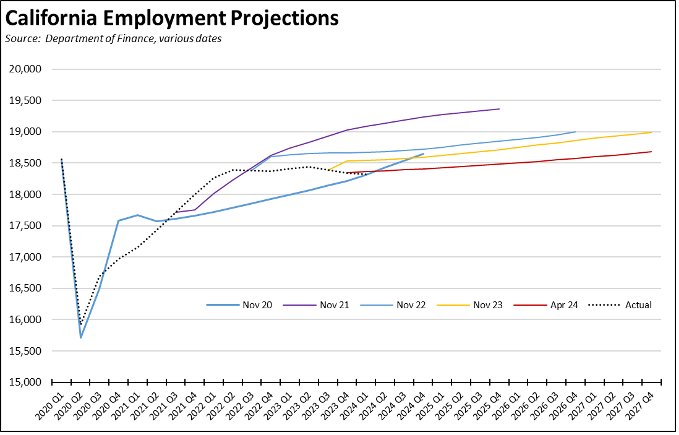
The number of employed forecasts even slower growth. The 2024 expected monthly average of only 5,400 is largely consistent with April’s gain of 5,800. The projections expect employment growth to rise only slowly to reach a monthly average of 8,700 by 2027. At this pace, the state would still not recover to the pre-pandemic peak at any point in the projection period.
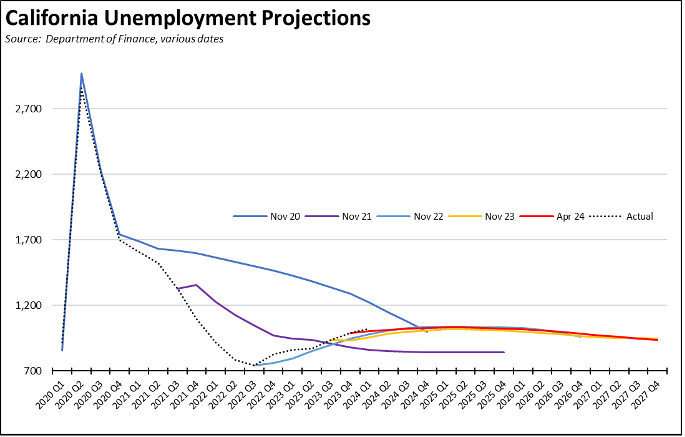
The number of unemployed is expected to remain elevated throughout this period, staying above the 1 million mark through at least the second quarter of 2026. The numbers on this indicator, however, show little difference in the last 3 projection sets. By the end of the projection period, unemployment is expected to be 21% higher than the previous near-term low in the third quarter of 2019. The unemployment rate is not expected to drop below its current level of 5.3% until the first quarter of 2026.
Numbers for the primary taxation base—personal income—similarly show fewer differences in the last three projection sets. Annual personal income growth is expected to remain at about 5% through the forecast period, somewhat below the trend previously seen in the projections for the January 2022 Proposed Budget but still in line with the May Revise expectations of revenue growth to sustain the current high level of expenditures. Adjusted for projected inflation (CPI-U), real personal income is expected to grow at only 2.5% annually through 2027, compared to 3.1% in pre-pandemic 2019.
Note that the labor force and jobs graphs show a kink departing from the actual numbers lines. These shifts reflect the significant downward revisions in these data series that were released in March for California and that helped lead to the currently lower projections.
JOLTS Tracking with Finance Projections
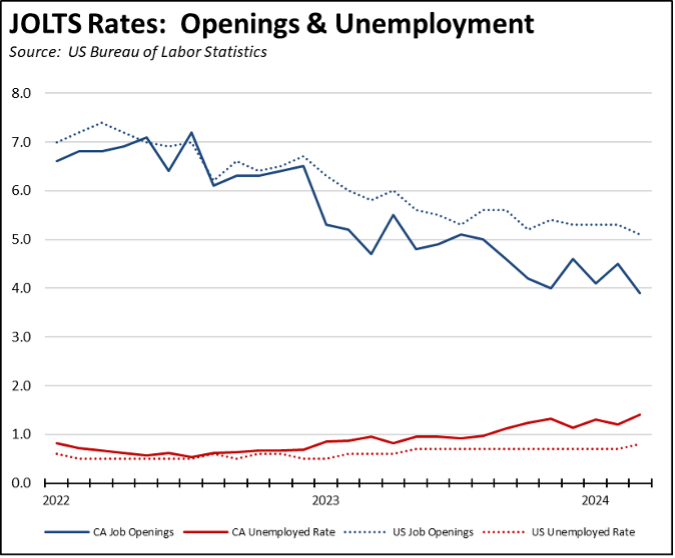
As indicators of potential growth, the JOLTS (Job Openings and Labor Turnover Survey) data for California tracks with the slowing reflected in the Finance economic projections. Expressed as rates, unfilled job openings (job openings as a percent of nonfarm jobs plus openings) have fallen to pre-pandemic levels in California—in the latest results to 2017 levels—while still tracking within the higher post-pandemic range in the overall US averages. The unemployment rate (number of unemployed per job opening) has risen to 1.4 unemployed per available job opening in California, while remaining in labor shortage territory although rising in the US data. Unemployment is rising in the state as employers have cut back on their hiring plans.
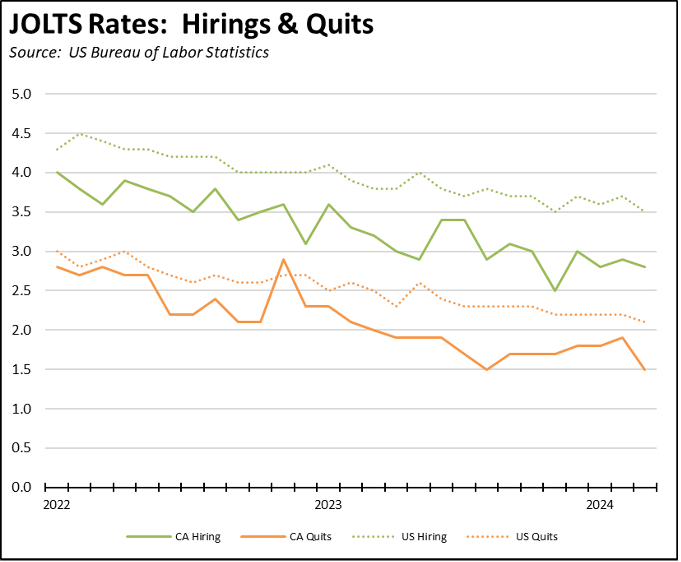
The California hiring rate (number of hires as a percent of nonfarm jobs) continues to follow an overall slowing trend in California while showing relatively little change over the past 10 months at a higher level in the US averages. The quits rate (number of persons quitting their jobs as a percent of nonfarm jobs) has sunk to 2014 levels in California, an indication of the extent to which the “Great Resignation” has turned into growing concerns over job security. The US averages also indicate increasing concerns but have fallen back closer to 2017 levels.
Tourism Spending Up in 2023 but Jobs Still Short of Recovery
A economic impact report from Visit California estimates that tourism spending in 2023 at $150.4 billion finally surpassed the previous peak of $144.9 billion in 2019. While important news for an industry that supports nearly 1.2 million jobs in the state, the report specifics better reflect the slowing economic growth in the Finance projections rather than some of the statements surrounding it.
- As reported by others, the $150.4 billion figure is in nominal dollars and does not reflect the significant inflation during this period and the growing costs of living in or visiting the state. Using the CPI-U as a deflator, spending in 2023 was 12.9% lower in constant 2019 dollars. Using the Fed’s preferred PCE price index deflator, spending was 10.7% lower in constant dollars. Tourism spending is growing, but costs in California are growing faster.
- Industry employment still has yet to fully recover to the 2019 levels but is close. Comparing the 2023 levels to those in the earlier Visit California report for 2019, total direct employment in 2023 was still 21,800 short of recovery. Looking at selected industries from the EDD data, Accommodation Visit showed the greatest recovery gap in the latest numbers for 2024. Food Services & Drinking Places were just at recovery, but the effects of the recent state minimum wage law have yet to be seen.
- The more important point is that it took 3 years for this industry to get back to even these recovery levels after the devastating impacts from the state’s job closures, and it now faces even more challenges from state policies and laws raising costs even further, including ever-expanding minimum wage laws, commercial electricity rates that in February became the highest among the contiguous states, and fuel prices that are the highest among all states, substantially increasing the costs of traveling to and traveling within the state.
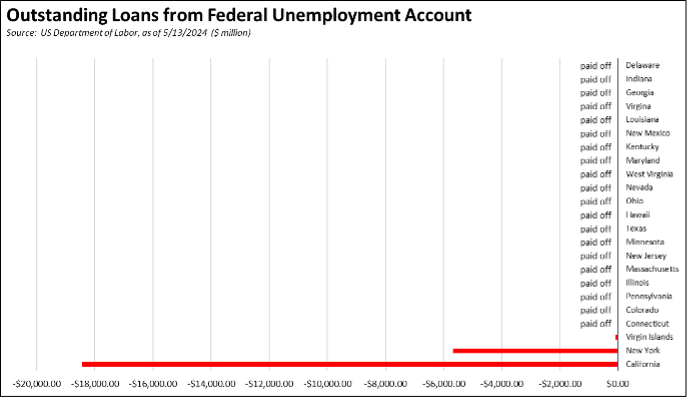
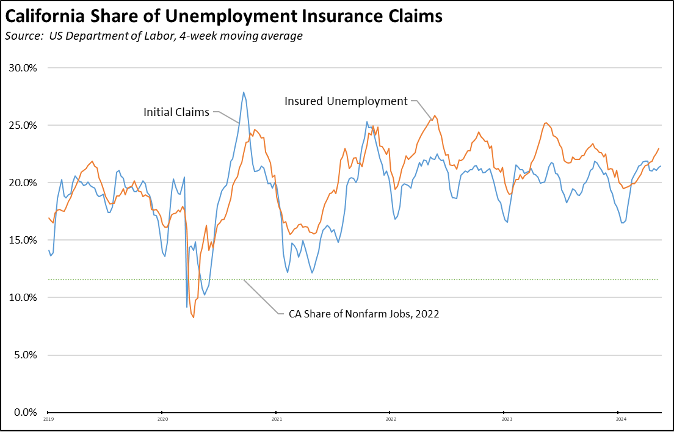
California Generates 21% of National Unemployment Insurance Claims
The state’s high level of unemployment—15.8% of total unemployed nationally—continues to be reflected in the unemployment insurance claims data. On a 4-week moving average basis, the number of initial claims is now tracking near both the 2022 and 2023 levels and above the pre-pandemic 2019 average.

The total number of workers receiving unemployment—as measured by insured unemployed (a proxy for continuing claims)—continues to track near the 2023 numbers but well above the levels in 2022.
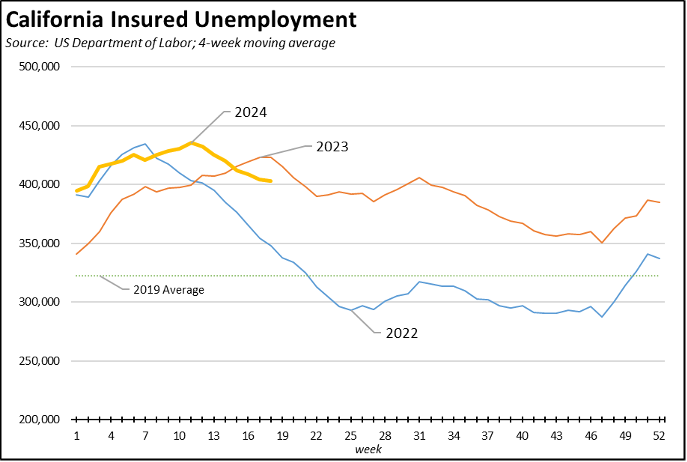
The operation of the California program has resulted in this state accounting for 21.5% of all initial claims nationally and 23.0% of insured unemployment. To put these numbers in context, they are twice as large as California’s overall 11% share of wage and salary jobs and a third higher than the 16% share of total unemployed.
Yet, despite the governor’s own numbers showing elevated unemployment throughout the current projection period, the May Revise still does not address the fact that the state unemployment fund is now structurally insolvent, with expected payouts projected to exceed tax receipts. California remains only one of two states that did not use federal pandemic funds to restore their state fund balances and prepare their finances for an upsurge in unemployment such as the one California is currently facing.