The Center for Jobs and the Economy has released our full analysis of the August Employment Report from the California Employment Development Department. For additional information and data about the California economy visit www.centerforjobs.org/ca.
Highlights for policy makers:
- Recovery Progress: Texas First State to Pass 1 Million Jobs Milepost; California Still at Just Under Halfway There
- Employment Drops Again
- Unemployment Rates Unchanged
- Unemployment Claims Continue Near 2022 Levels
- But UI Benefit Payments Nearly Double the US Average
- State Budget Imposes New Employment Tax
- UI Fraud Substantially Higher than Previously Reported
- UI Fund Challenges Unpacked in Two Recent Reports
- CaliFormer Businesses
Recovery Progress: Texas First State to Pass 1 Million Jobs Milepost; California Still at Just Under Halfway There
In the August nonfarm jobs data, California led the states with a monthly gain of 23,100, followed by New York at 18,100 and North Carolina at 17,500. The substantial revision to the July jobs number in contrast pushed California from 2nd highest among the states in the preliminary estimates down to 8th.
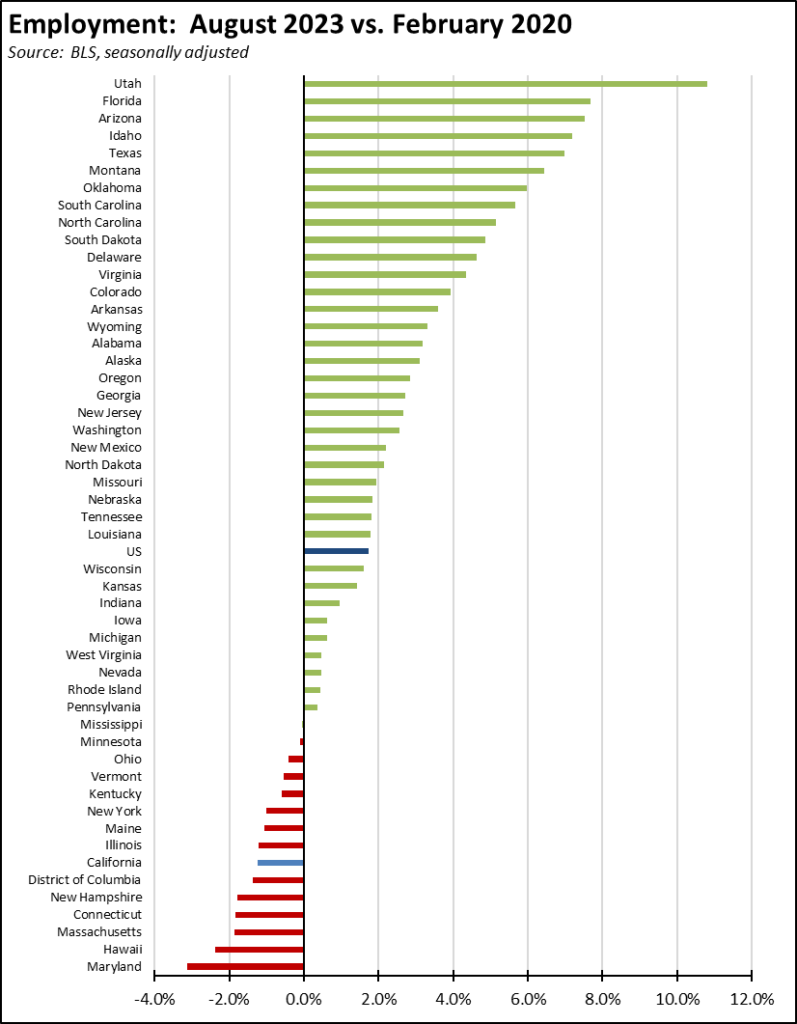
Even with its weaker August performance, Texas became the first state to pass the 1 million jobs mark compared to the pre-pandemic highs in February 2020. Looking at jobs growth compared to this benchmark, Texas was first with 1,007,800 as of August. Florida was second with 710,400, and California a more distant third at 447,600.
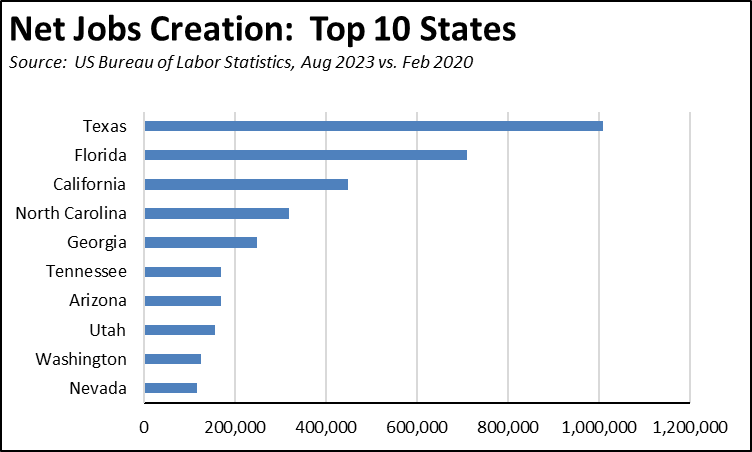
Adjusted for size, California again ranked 21st highest, just marginally below the US average.
![]()
Employment Drops Again
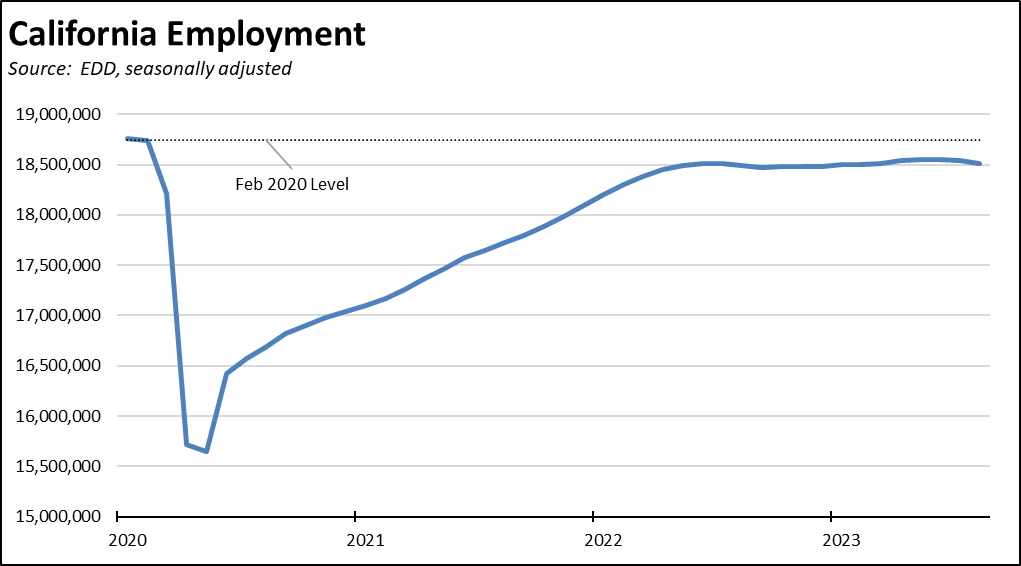
Employment—the number of people working—dropped for the second month in a row, posting a loss of 27,900 and largely reversing the gains since March. Total employment continues to fall short of the pre-pandemic recovery level and has remained essentially level since June 2022. While the state promotes policies intended to combat poverty and income inequality, these will have little lasting effect as long as other policies instead reduce the flow of workers back into gainful employment. Stagnation in the labor supply also has long term implications to the state’s ability to maintain reasonable levels of jobs growth.
On a relative basis, however, California posted somewhat higher, rising from the 3rd worst recovery rate among the states in July to 7th worst in August as other states experienced losses as well.
Unemployment Rates Unchanged
California’s unemployment rate in August was unchanged at 4.6%, the 3rd highest among the states coming in below only Nevada at 5.4% and DC at 5.0%.
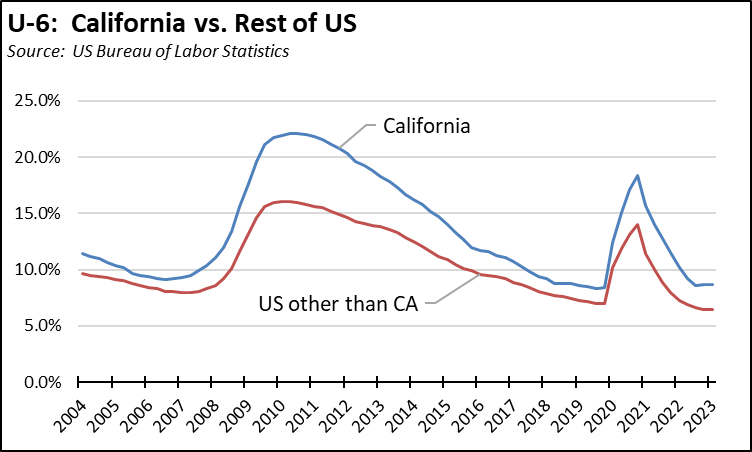
California also showed no change in U-6, a broader measure of unemployment which remained at 8.7% in the 2nd quarter. U-6 covers the unemployed along with underemployed, those who are marginally attached to the labor force, and those who have given up looking for work. California had the 2nd highest rate among the states, behind only Nevada at 9.3%.
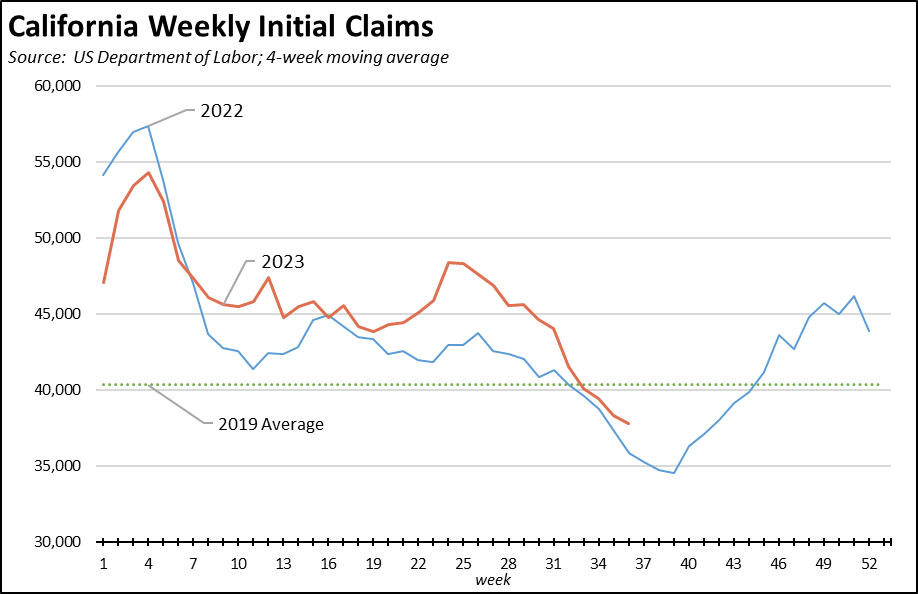
Unemployment Claims Continue Near 2022 Levels
Initial unemployment insurance claims (4-week moving average) continued to trend closely to 2022 levels after the upsurges seen earlier this year.
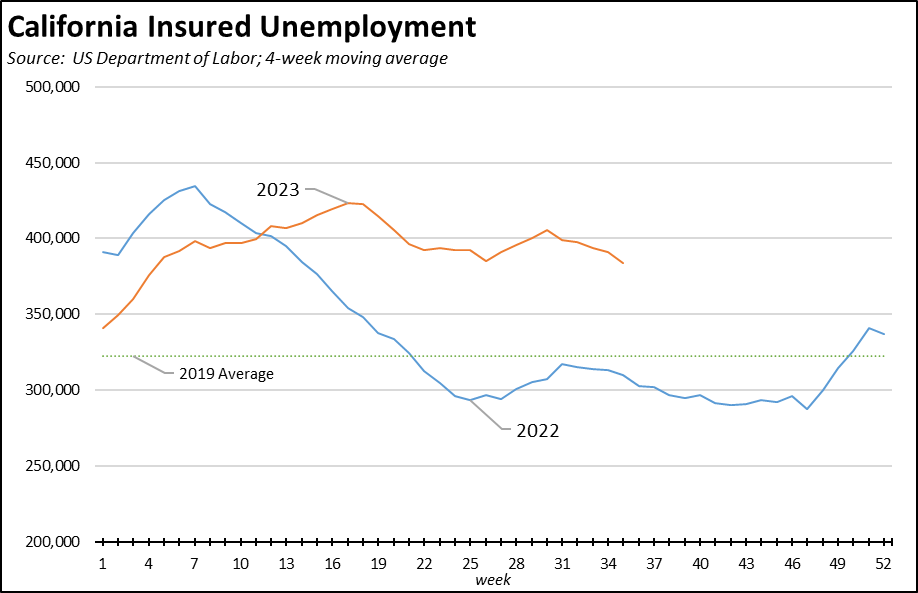
Insured unemployment—a proxy for continuing claims—remained elevated above both the 2022 and 2019 trends, continuing a drag on overall employment and jobs expansion potential.
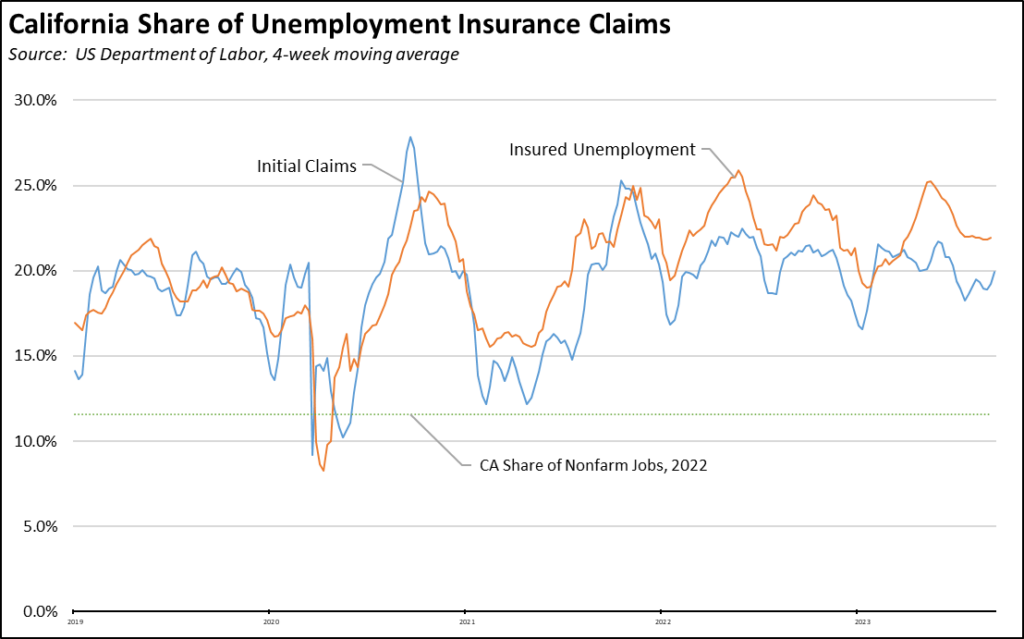
But UI Benefit Payments Nearly Double the US Average
The UI program as administered in California covers a much larger share of the labor force than nationally. In the latest results (4-week moving averages), California produced 19.9% of all initial claims and 21.9% of insured unemployment. In contrast, California contained only 11.6% of all nonfarm jobs.
State Budget Imposes New Employment Tax
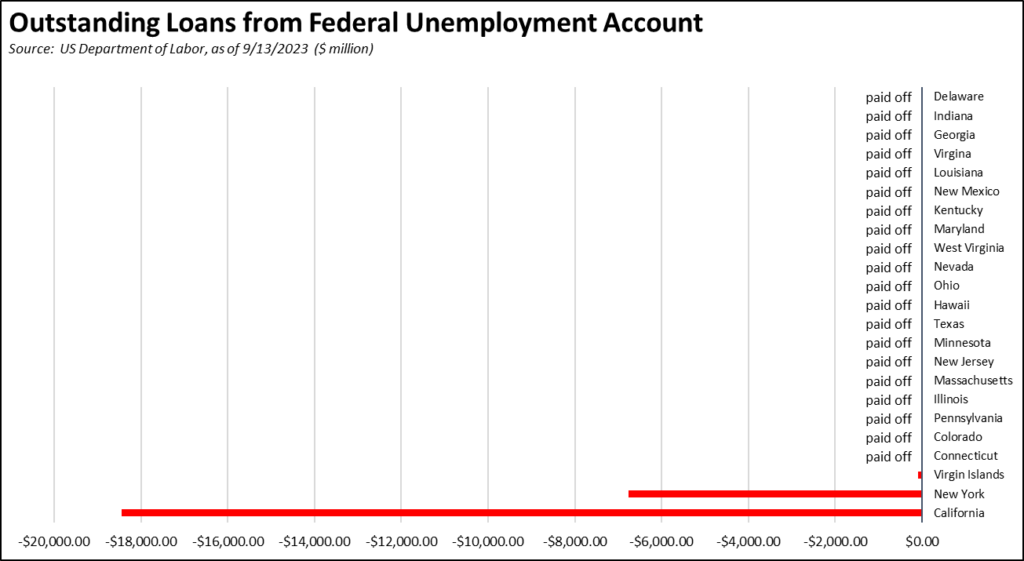
The operation of this program in California already is stressing the fiscal solvency of this critical benefit as the result of past expansions of benefits without proper consideration to how they were to be funded, a trend that mushroomed during the pandemic when the state relied on this program to offset the impact on workers from its job closure policies. California’s unemployment insurance fund debt was $18.4 billion in the latest report for September 13. By failing to address this debt, the state budget enacts a tax on employers composed of two parts. Employers will continue paying the state UI tax at its highest rate schedule for the foreseeable future if not permanently. Employers also will be subject to an increase in the federal UI tax, growing at an additional 0.3% to 2.7% annually until the federal debt is paid off.
EDD’s most recent fund forecast projects further deterioration in the fund’s conditions, reaching an expected $20.3 billion deficit by the end of 2024. This fiscal weakening is expected even under a forecast that does not anticipate a new economic downturn in this period. Yet, even as the fund is expected to go further into debt under normal circumstances, additional benefits expansion is now being considered which would push the fund closer to permanent insolvency.
UI Fraud Substantially Higher than Previously Reported
A recent report by the Government Accountability Office (GAO) ups the estimated toll from UI fraud during the pandemic period at $100 to $135 billion, or 11% to 15% of all UI payments issued between April 2020 and May 2023. Previous GAO estimates pegged the UI fraud at $60 billion.
The report also assesses state recovery efforts, supported through $1.4 billion in additional federal funding for this purpose. Only $1.2 billion was recovered through these efforts. Another $55.8 billion in overpayments was also identified by the states, of which only $6.8 billion has been recovered.
UI Fund Challenges Unpacked in Two Recent Reports
Factors underlying the extremely high usage of UI benefits in California along with others undermining the solvency of the UI fund are addressed in two recent reports.
An August report by the California Foundation for Commerce & Education compares provisions of the California program to its operation in other states. Overall, the report concludes:
- California “. . . provide[s] the most generous and least restrictive eligibility requirements in the nation, and it is more forgiving of fraud by claimants.” These aspects in part stem from the complexity of California law, provisions that also work against workers’ interests and create challenges to compliance with federal requirements for rapid distribution of benefits, as evidenced by operations during the pandemic.
- California more narrowly defines fraud than the other states, and “. . . is relatively forgiving towards individuals who have committed fraud.” These weaknesses add to the financial instability experienced by the fund and present challenges to its viability going forward.
- As reflected in the underperforming employment numbers, re-employment of workers should be given a higher priority. The opportunity to do so is provided by increasing federal fund availability specifically for re-employment services.
Comparable criticism of the state program is also made in a recent report by the State Auditor, concluding that “EDD is a high-risk agency because of its mismanagement of the UI program.” Specific weaknesses cited in the report include (all quotes from the report):
- Substantial fraud risk exists in EDD’s UI program.
- During the pandemic, millions of Californians were required to wait long periods to receive UI benefits or get answers to questions about their UI claims, and EDD continues to struggle to pay claimants in a timely manner.
- Many of EDD’s UI eligibility decisions are not upheld on appeal . . . EDD’s improper decisions regarding UI benefits have required some UI claimants to face even longer delays than are typical.
The high risk designation stems from the importance of this program on several fronts. For workers, the program provides critical income support during periods of unemployment. For the state economy, these benefits also provide a counter-cyclical effect supporting household consumption during periods of economic downturn. Late reporting and the continuing uncertainty over the extent of fraud may present risks to the state’s credit rating as well.
Virtually every other state has recognized these critical aspects of the UI program, and has allocated federal pandemic assistance funds—as specifically authorized—to pay off their pandemic debt and, in many cases, restore state fund balances to their pre-pandemic level as well. California along with the only other exception in New York instead has decided to pass on the issue, relying instead on tax increases to pay down their debts even with the risk of another downturn that would plunge the fund into an even deeper hole. And rather than shoring up the fund’s finances, recent legislation would expand eligibility into new areas with no consideration to how these additional draws on the fund’s solvency will be handled.
CaliFormer Businesses
Additional CaliFormer companies identified since our last monthly report are shown below. The listed companies include those that have announced: (1) moving their headquarters or full operations out of state, (2) moving business units out of state (generally back office operations where the employees do not have to be in a more costly California location to do their jobs), (3) California companies that expanded out of state rather than locate those facilities here, and (4) companies turning to permanent telework options, leaving it to their employees to decide where to work and live. The list is not exhaustive but is drawn from a monthly search of sources in key cities.