The Center for Jobs and the Economy has released our full analysis of the August Employment Report from the California Employment Development Department. For additional information and data about the California economy visit www.centerforjobs.org/ca
Highlights for policy makers:
- 2nd Quarter Real GDP 27th Highest Among the States; 1st Quarter Revised Higher
- 2nd Quarter Personal Income Growth 4th Highest Among the States; Driven by Medi-Cal Benefits
- Slowing Job Growth Potential
- CaliFormer Businesses
- State UI Fund Debt Passes $20 Billion
2nd Quarter Real GDP 27th Highest Among the States; 1st Quarter Revised Higher
California’s Real GDP grew by 2.8% in the second quarter (annualized change from the previous quarter), just below the 3.0% growth for the US overall and 27th highest among the states.
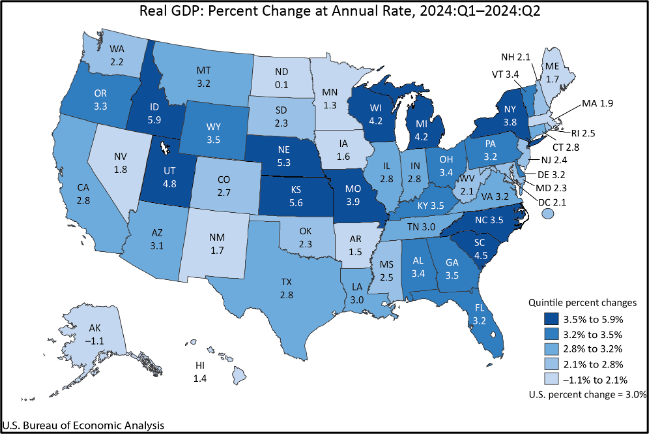
Looking at industry contributions to the quarterly growth rate illustrates the declining importance of Information (containing key elements of High Tech along with movie/tv production) to the final state outcomes over the past three quarters. In the 2nd Quarter results, Information still led but contributed only 0.53 percentage points to the 2.8% growth, followed by Manufacturing (0.48) and Health Care & Social Assistance (0.39). Seven industries showed a contraction, led by Accommodations & Food Services (-0.19), Educational Services (-0.06), and a tie between Other Services and Management of Companies & Enterprises (-0.04).

The associated revisions released by US Bureau of Economic Analysis (BEA) put the 1st Quarter growth at 6.3%, substantially higher than the preliminary figure of 1.2% released in June. California has lagged the overall US average over the past two years, but the recent revisions have helped narrow the gap.
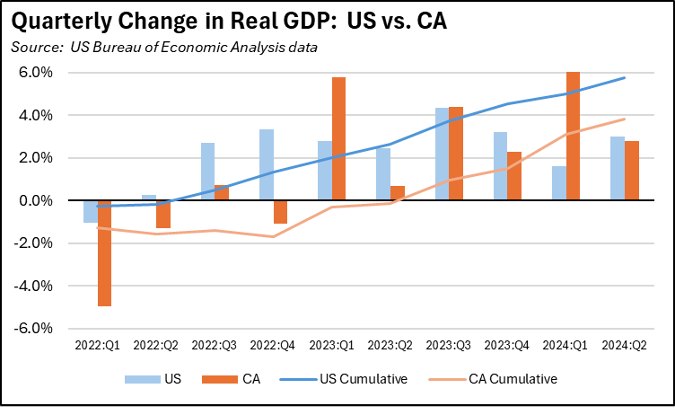
Looking at cumulative change since 2022, Texas led the states by growing more than three times faster than California at 12.9%. Florida was second with 9.8%.

Measured by current GDP and the April IMF data release, California as a separate entity remained the 5th largest economy in the world under the revised 2023 GDP results. The rankings will be updated with the October IMF data and the updated state purchasing power data.
2nd Quarter Personal Income Growth 4th Highest Among the States; Driven by Medi-Cal Benefits
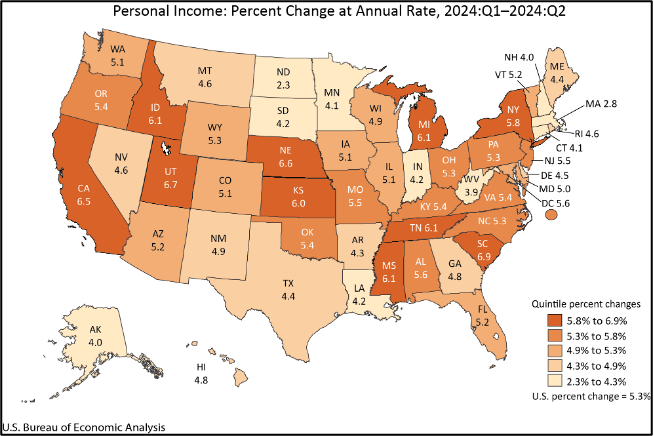
California Personal Income rose 6.5% (annualized) in the 2nd Quarter, above the US average of 5.3% and 4th highest among the states.
As with GDP, the associated revisions show much stronger growth in the 1st Quarter.
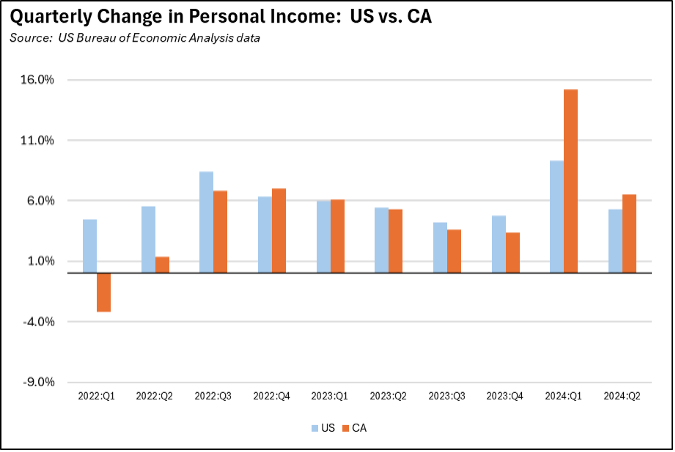
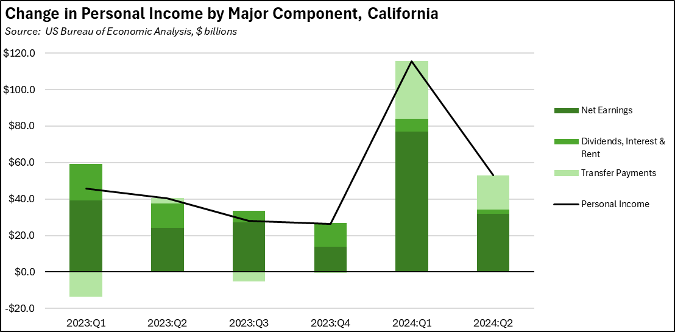
A major contributor to Personal Income growth, however, came from expansion of Transfer Payments due largely to substantial growth in Medi-Cal payments. The Medi-Cal benefits alone grew 54.8% in the 1st Quarter (annualized) and 47.8% in the 2nd Quarter due to program expansion. Putting this component to one side, the other portion coming from California Net Earnings plus Dividends, Interest & Rent grew at an annualized rate of 5.0% in the 2nd Quarter, just below the comparable average for the US at 5.1%.
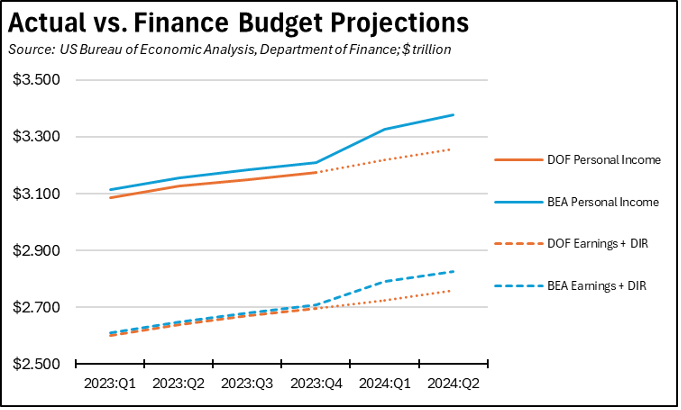
With these results, total Personal Income exceeds the levels shown in the current Department of Finance projections underlying the revenue estimates in the current Budget Bill. Most of the difference, however, is due to the sharply revised Transfer Payments component in the BEA data. While a portion of Transfer Payments is also taxable—California is only one of 13 states taxing Social Security benefits—the primary tax base consists of the Net Earnings and Dividends, Interest & Rent (DIR) components. Considering just these two components, the variance from the Finance projections is much smaller and closer in line with the recent monthly General Fund revenue outcomes.
Slowing Job Growth Potential
The JOLTS (Job Openings & Labor Turnover Survey) estimates continue to indicate California employers are cutting back on their hiring plans, reducing the likely scale of future jobs growth in the state.
The number of unfilled job openings at the end of July were down 1.7% to 622,000, again coming in at levels most recently seen during the height of the pandemic in 2020, and comparable to levels experienced in 2017 in the pre-pandemic period. US job openings fell somewhat more at 3.0%. Comparing the job opening rates (job openings as a share of job openings plus total employment), California continues on its downward trend while the July results show the US overall on a less steep but still downward trend as well.
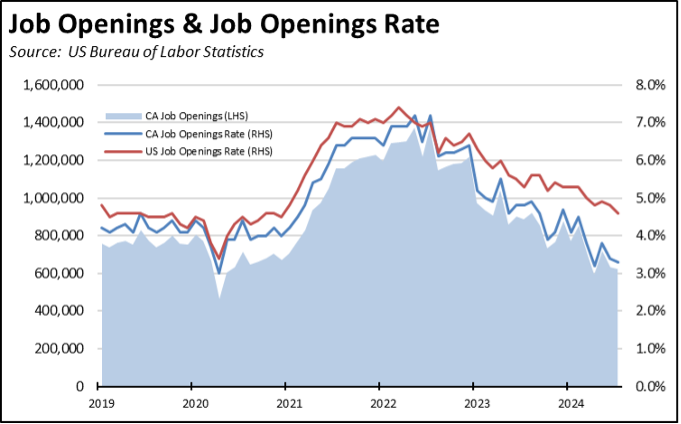
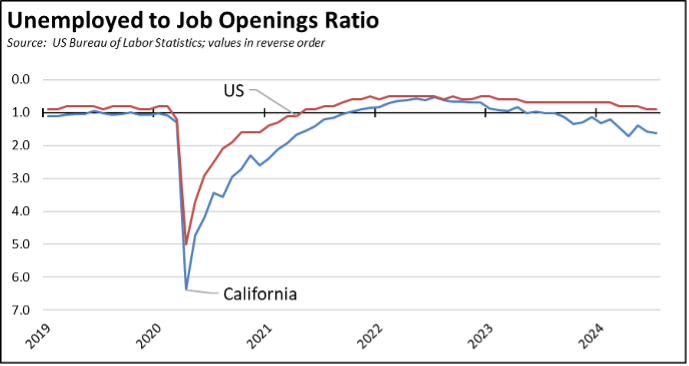
California’s high unemployment numbers combined with declining job openings puts the state at 1.6 unemployed for every available job opening, a level that continues to erode. The US overall remains above parity at 0.9 unemployed per job opening. California has been the worst state as measured by this metric since last September.
CaliFormer Businesses
Additional CaliFormer companies identified since our last report are shown below. The listed companies include those that have announced: (1) moving their headquarters or full operations out of state, (2) moving business units out of state (generally back office operations where the employees do not have to be in a more costly California location to do their jobs), (3) California companies that expanding out of state rather than locate those facilities here, and (4) companies turning to permanent telework options, leaving it to their employees to decide where to work and live. The list is not exhaustive but is drawn from a monthly search of sources in key cities.
State UI Fund Debt Passes $20 Billion
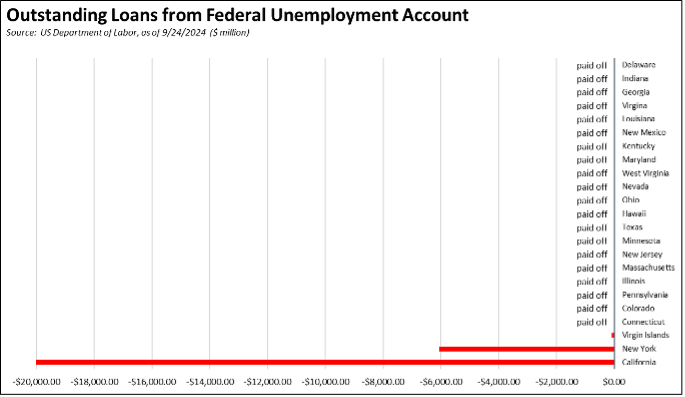
The state’s continuing failure to address its burgeoning Unemployment Insurance debt saw the level growing to more than $20 billion in September. All other states other than New York have paid off their pandemic period debt, in large part using the federal funds provided for that purpose. California instead chose to use those funds on other expenditures.
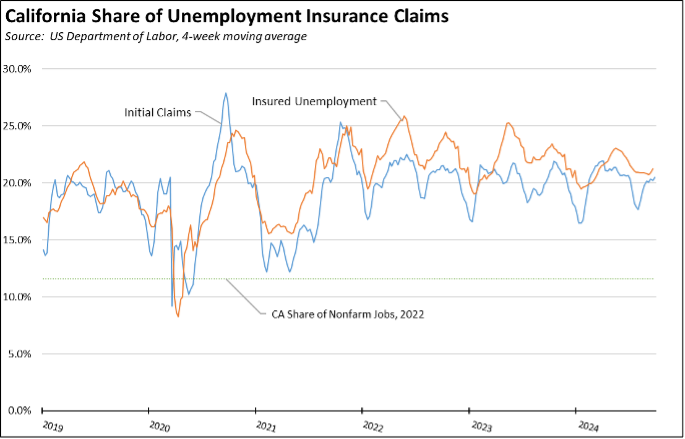
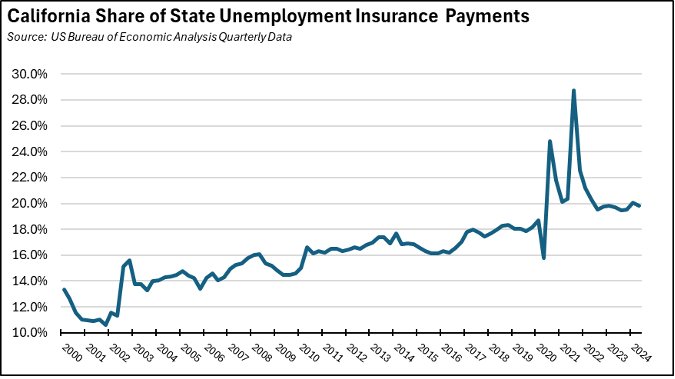
The growing size of this debt is not just due to the state’s fiscal management practices. California also remains one of the most generous programs in the country, accounting for an average to date in 2024 of 19.9% of all state unemployment insurance payments while containing only 11.4% of nonfarm jobs. The state’s persistent unemployment level above 1 million reflects policies that continue to lean towards benefit payments rather than expansion of earned income opportunities.
Measured on a 4-week moving average basis, the number of initial claims continues to moderate from the sharp rise that began at the beginning of June. The overall trend now is now tracking marginally above the results from 2023 during the same period.
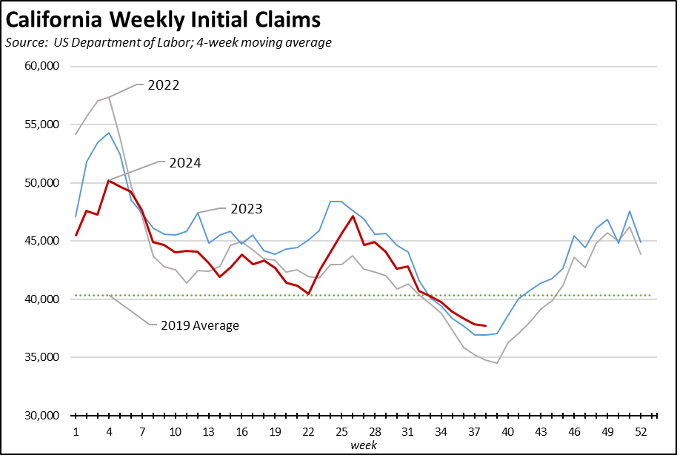
The number of workers receiving unemployment—as measured by insured unemployed (a proxy for continuing claims)—is now tracking somewhat below the 2023 trend, but remains substantially elevated above the levels in 2022.
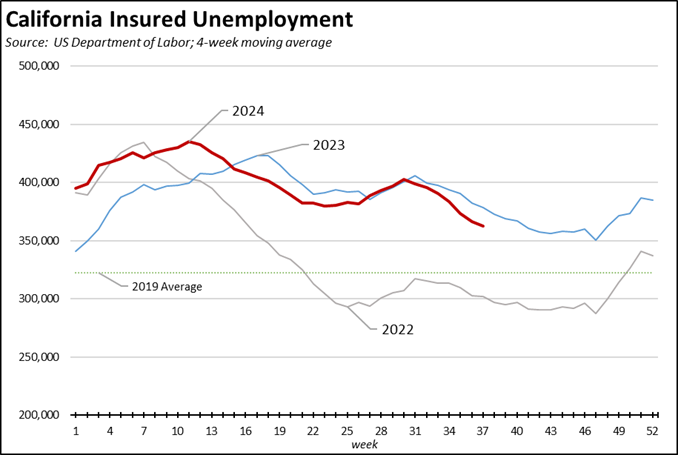
Reflecting California’s outsized share of total benefit payments, insured unemployment remains above the 20% level at 21.3% (4 week moving average), as is the share of initial claims at 20.5%.