The Center for Jobs and the Economy has released our full analysis of the July Employment Report from the California Employment Development Department. For additional information and data about the California economy visit www.centerforjobs.org/ca.
Highlights for policy makers:
- Employers Will See a 247% Rise in Federal UI Tax Rate Due to State Inaction on $21 Billion Debt
- Scope 1, 2, and 3 Emissions of California’s Largest Source
- Use of Public Transit Shows Only Marginal Change in 2024
- California R&D Rose 8.3% in 2023
- CaliFormers
Employers Will See a 247% Rise in Federal UI Tax Rate Due to State Inaction on $21 Billion Debt
As the state has allowed its Unemployment Insurance Fund to grow to unprecedented levels, employers now face the prospect that the federal employment tax rate—which comes on top of the state tax—will jump from its current 1.5% to 5.2%. Partial waivers are possible under federal law based on a state’s fiscal performance, but California’s record on this issue has been called into still deeper question by the findings of a state audit.
California remains only one of two states still carrying over a substantial unemployment insurance fund debt from the pandemic, even though federal pandemic assistance funds were provided specifically to assist states in paying off this obligation. Almost all states used these funds accordingly to restore the fiscal health of their funds and minimize any additional tax increases as their employers sought to rebuild their work forces. Texas, for example, as with other states not only paid off its debt but also applied the federal funds to restore its fund to pre-pandemic levels.
California stands alone in several respects. First, it chose to use those funds for other purposes. Second, it splurged on this debt to a far greater extent than any other state, with the most recent EDD projections expecting it to be $21 billion at the end of 2025. And finally, while other states paid off their debt and began rebuilding healthy balances in anticipation of the next downturn, California keeps adding to its debt as the result of state policies that have pushed unemployment higher over the past two years. California today is in an even worse position to deal with the next downturn than it was at the end of the pandemic.
As a result of the state’s inaction, employers are facing higher employment taxes now and over the coming years. The federal unemployment tax rate (FUTA) is set at 6.0% on the first $7,000 of wages. In states with no fund debt, employers receive a 5.4% credit resulting in an effective federal rate of only 0.6%. In states with an outstanding debt on two consecutive years as of January 1—currently California, New York, Connecticut, and Virgin Islands—the federal tax increases by 0.3 percentage point each year. Under this standard increase, California’s federal tax rate is scheduled to rise to 1.8% if the debt is not paid off by November.
But as they say, there is more. States like California that persist in relying on federal debt face two substantial bump-ups. Following three consecutive years with an outstanding debt on January 1, states are potentially subject to a 2.7% increase. The Biden Administration, however, declined to impose this penalty on the eligible states.
In states with five consecutive years with outstanding debt, an additional Benefit Cost Reduction (BCR) is calculated based on each state’s fiscal performance. California’s pending BCR is estimated at 3.4%, compared to New York at 1.1% and Connecticut at 0.8%. The BCR can be waived and replaced by the 2.7% bump up, but currently California employers are facing the prospect of the federal tax rate rising to 5.2%, compared to the current rate of 1.5% and only 0.6% in almost every other state.
Waivers are based on each state’s fiscal performance, and California’s is looking worse by the moment. In a recent damning audit, the State Auditor revealed that California’s management of this program has been even worse than previously indicated. As reported by the Auditor:
- “The Employment Development Department (EDD) materially restated its Federal Fund and Governmental Activities financial statements . . . because EDD had incorrectly reported ineligible unemployment insurance (UI) benefit payments as a liability to the federal government in its fiscal year 2022–23 financial statements.”
- “EDD also misstated liabilities, expenses, and beginning fund net position in its Unemployment Programs Fund financial statements for fiscal year 2023–24. Furthermore, EDD did not have adequate internal controls in place over its accounting and financial reporting, such as timely and thorough reconciliations of multiple material account balances.”
This being government, it is now employers and consequently workers that will pay for these mistakes through higher employment tax rates. Employers with higher turnover will be subject to a far higher burden as the $7,000 taxable base starts over with each new hire. These include seasonal employers such as in tourism who are already struggling with the downturn in travel.
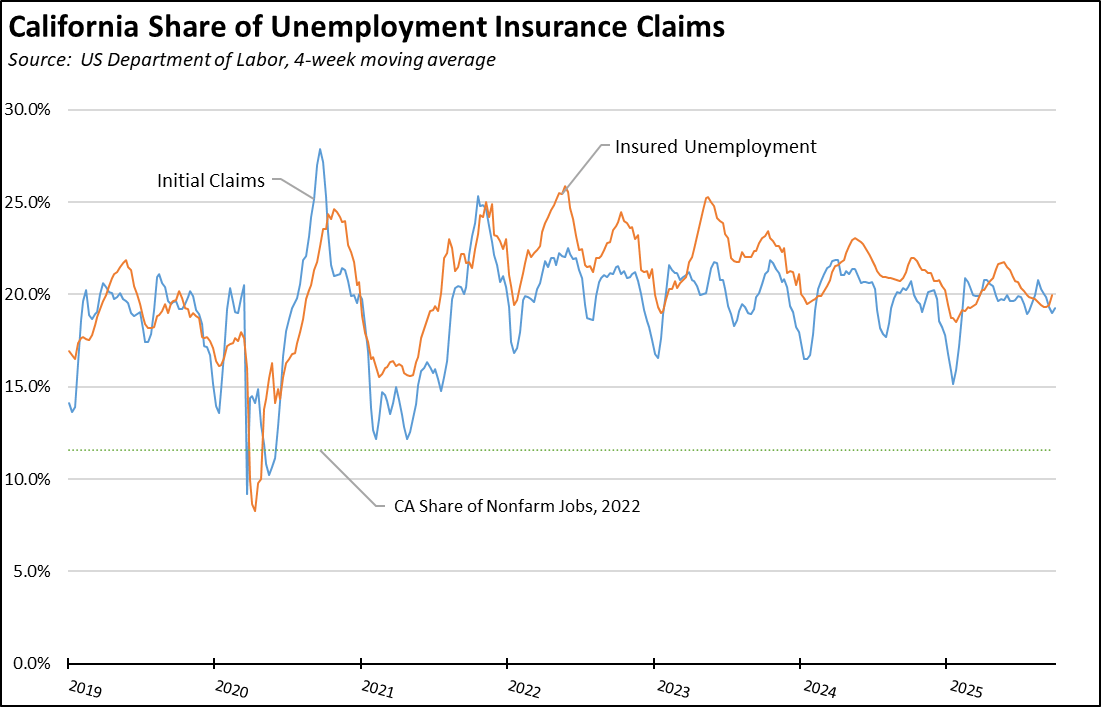
But while the state has allowed this Fund to remain fiscally insolvent, California workers rely on this benefit to a far greater extent than any other state. As indicated in our continuing reports, California had the highest unemployment rate among the states in August. Unemployment has remained above the 1 million mark and growing for 20 months in a row, levels that are at their highest since October 2021 at the end of the pandemic. California accounts for about 20% of all unemployment claims nationally, even though it has only under 12% of the total workforce.
Current UI claims show little prospect for change. Reflecting the extent to which the California jobs situation has remained stagnant over the past two years, both initial claims and insured unemployment (a proxy for continuing claims) continued to track the 2024 trend.
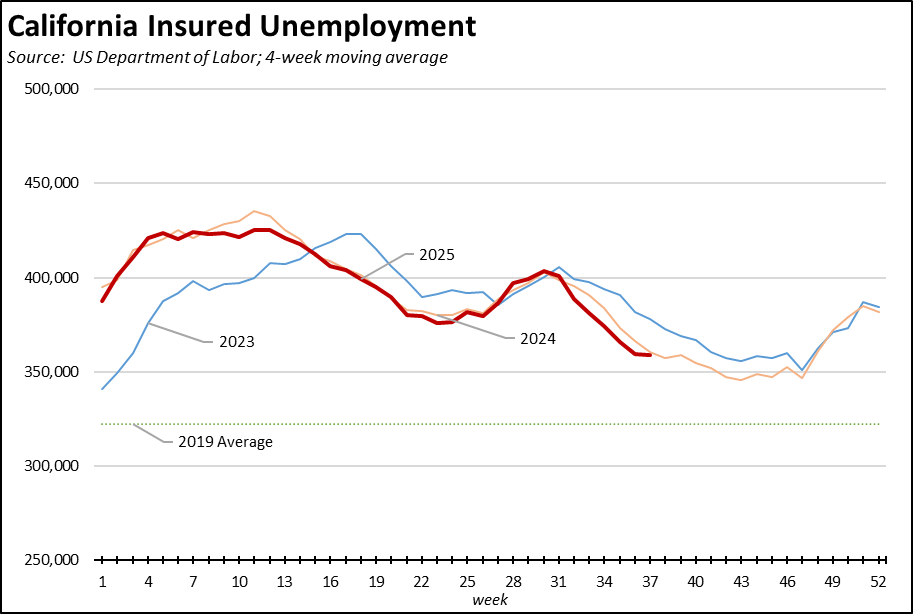
The result being that California continues to have an inordinately high share of workers reliant on this program, constituting nearly a fifth of both initial claims and insured unemployment nationally in the most recent 4-week moving averages. With the continuing failure of the state to address the issue, the program remains functionally bankrupt. EDD’s most recent projections expecting the fund’s debt to grow to $21 billion by the end of the year. In 2025, EDD’s projections show fund payments at $6.8 billion and revenues—including the scheduled tax increases on employers—into the debt-ridden fund of only $6.5 billion.
Scope 1, 2, and 3 Emissions of California’s Largest Source
Under SB 253 (Wiener, 2023), SB 261 (Stern, 2023), and SB 219 (Wiener, 2024), large companies doing business in California will be required to report on their Scope 1, 2, and 3 greenhouse gas (GHG) emissions. While the other major entity, the EU, requiring this type of reporting has announced a delay in their requirements along with a narrowing of those companies that will be required to comply, California continues to move ahead with the proposed regulations with only minor adjustments using the Air Board’s enforcement discretion authority.
As defined in the bills:
- “Scope 1 emissions” means all direct greenhouse gas emissions that stem from sources that a reporting entity owns or directly controls, regardless of location, including, but not limited to, fuel combustion activities
- “Scope 2 emissions” means indirect greenhouse gas emissions from consumed electricity, steam, heating, or cooling purchased or acquired by a reporting entity, regardless of location.
- “Scope 3 emissions” means indirect upstream and downstream greenhouse gas emissions, other than scope 2 emissions, from sources that the reporting entity does not own or directly control and may include, but are not limited to, purchased goods and services, business travel, employee commutes, and processing and use of sold products.
The reporting requirements apply only to large companies, but the largest economic entity operating in the state collectively and through interlocking funding flows is State & Local Government. To illustrate the applicability of these new reporting requirements, Scope 1, 2, and 3 emissions for this part of the economy were estimated using a new feature of the IMPLAN input-output model designed for this purpose.
Because of the nature of State & Local Government, the estimates differ somewhat from what will be required for private businesses. Spending by these agencies takes on two forms. Enterprise activities—primarily local government operations such as electric utilities, airports, and other utilities—can be modeled directly as an industry. The bulk of their expenditures, however, applies to operation of government facilities and programs, and are instead entered into the model as institutional spending. This “production” of government services consequently blurs the distinction between Scope 1 and 2 emissions, with a portion coming from purchase of commodities and services along with their relatively Scope 1 emissions. The use of an input-output model, however, captures the full range of likely Scope 3 emissions, as squishy as that concept remains even as defined in the bills.
Combining the results but not including any associated emissions related to household transfer payments, total estimated emissions (100-year global warming potential) in 2023 were 231.5 MMTCO2e. To put this number in perspective, the Scope 1 estimate comprises a fifth of total emissions in California’s most recent (2022) GHG emissions inventory, indicating the extent to which emissions in that inventory are driven by state spending. The Total shown in the table is equivalent to 62% of the total inventory level, although the spread in this case is more global rather than arising more from the state due to a wider sourcing of goods and services. Incorporating the effects associated with state and local transfer payments increases the total by about a quarter, but this increase is more appropriately considered as Scope 3 overall as it arises primarily from the induced effects of household spending.
Use of Public Transit Shows Only Marginal Change in 2024
The role of public transit in California has again been highlighted by the recent Air Resources Board recommendations to launch an expansive indirect source regulation effort along with the vehicle miles traveled (VMT) cost mandate included in the recent AB 130 with little to no public debate. Both programs assume public transit is a viable alternative for transportation especially worker commutes in the state, a policy belief furthered by the recent allocation of funding to public transit as part of the recent authorization for the Cap and Trade program and the Governor’s recent push for a $750 million loan to Bay Area transit agencies. The data, however, continues to show that public transit is not being used widely currently in the state, and a number of studies including one by the Center detail why this option is not feasible for the overwhelming share of workers given the realities of California’s job and housing opportunities. While the regulatory and public funding initiatives are couched in terms of securing emission reductions—both greenhouse gases and priority pollutants—such reductions are illusory given current and potential levels of ridership.
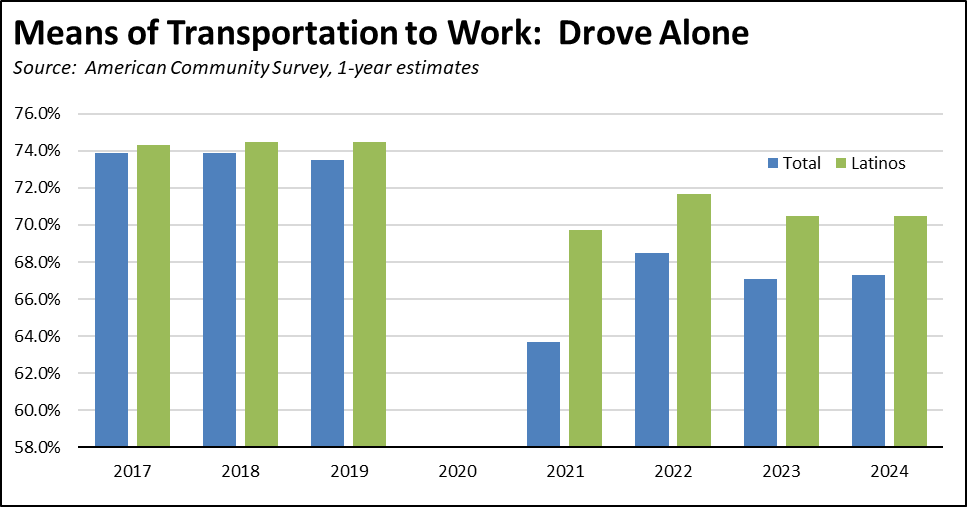
The recent release of the 2024 American Community Survey (ACS) 1-year estimates indicates use of public transit shows only marginal change. Two-thirds of workers relied on driving alone, a level essentially the same as 2023 (67.3% vs. 67.1%). Latino workers were reliant on using their own vehicles at a slightly higher rate—70.5% of workers in both 2023 and 2024.
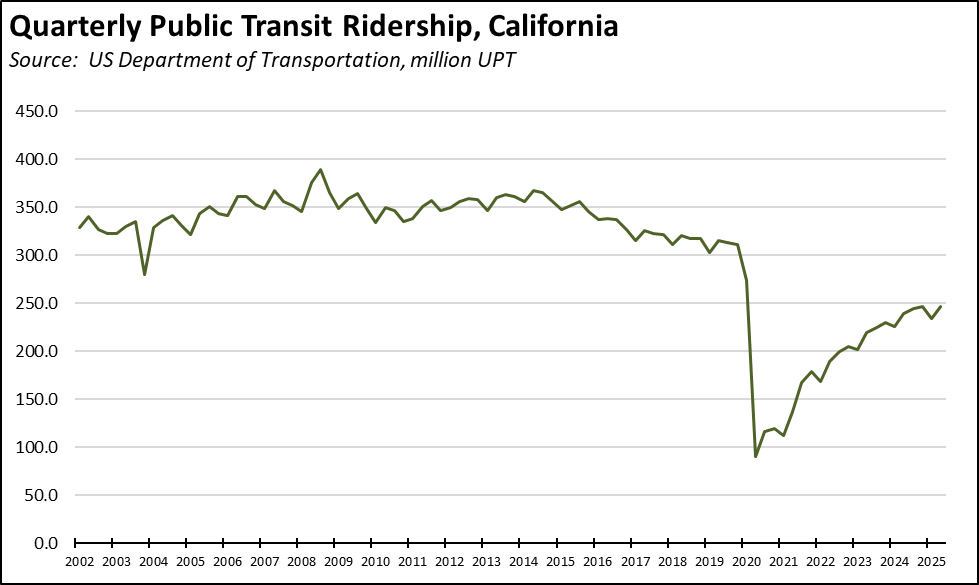
While the governor has defended the recent funding allocations on the basis that “transit is a lifeline to millions of Californians,” the data indicates that current ridership barely qualifies for this level. In 2024, only 3.3% of workers relied on public transit as their primary means of transit to work compared to 3.1% in 2023. Latinos essentially matched the overall state averages at 3.4% in 2024 and 3.1% in 2023. In the raw numbers, only 621,000 workers relied on public transit in 2024, compared to 572,000 in 2023 and 970,000 in pre-pandemic 2019. Assuming round-trip travel, average total ridership for all purposes (see below) was only 1.3 million a day in 2024.
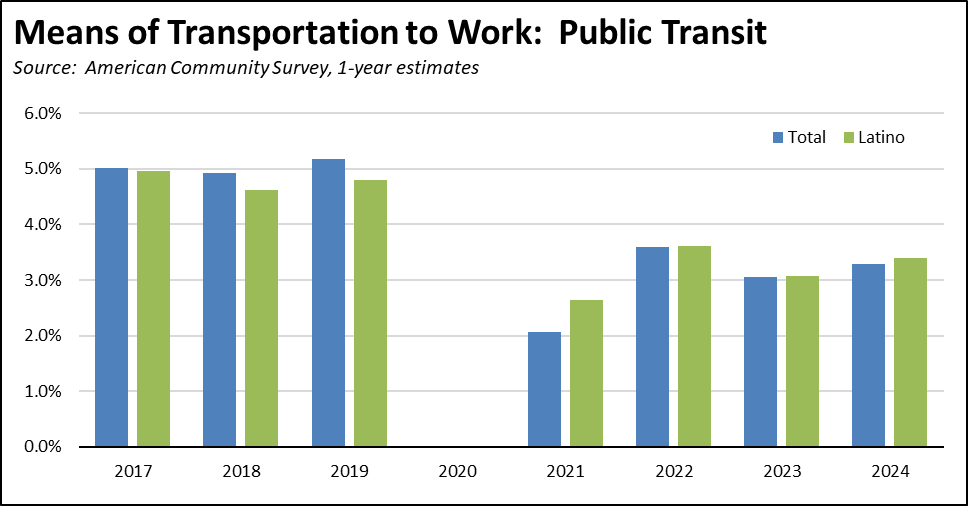
While reliance on driving alone has eased from the pre-pandemic levels, the reason lies in the rise of working from home rather than public transit options. In 2024, 14.1% of workers (2,672,000 workers) worked from home compared to 14.6% in 2023 and 6.3% in 2019.
Note that in all the charts data for 2020 is not available due to insufficient response rates that year.
Total ridership for all purposes was declining even before the pandemic. In 2019, total UPT (unlinked passenger trips), was down 14% from 2014. In the most recent Department of Transportation data, in spite of continued substantial investments in system expansion and improvements, ridership has essentially leveled off in 2024 and the first half of 2025 at about 23% below 2019 and just over a third below 2014. Ridership has recovered somewhat from the pandemic dive, but appears to have reached a new plateau.
California R&D Rose 8.3% in 2023
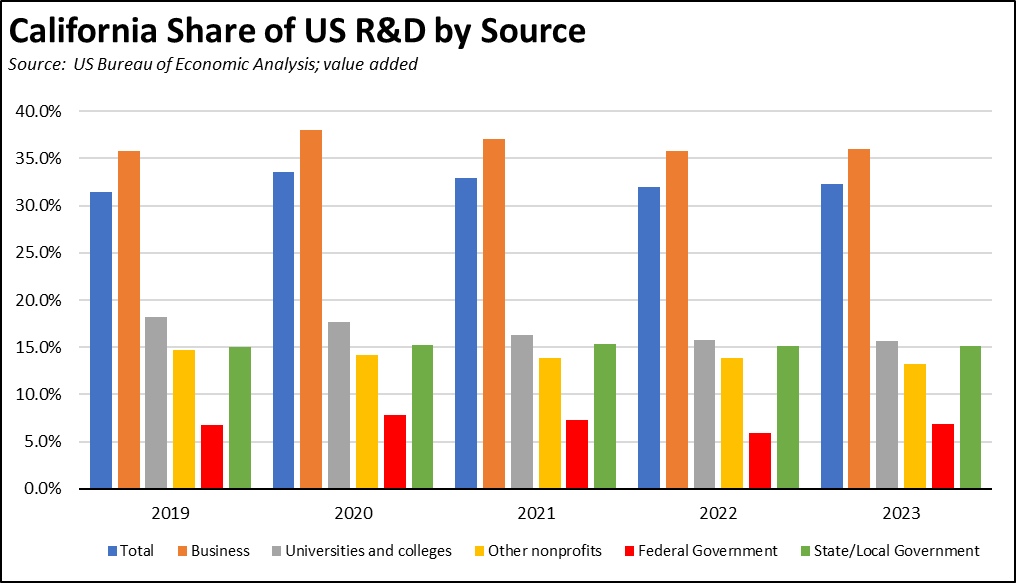
In an update to the new US Bureau of Economic Analysis Research and Development Satellite Account, R&D activities in California rose 8.3% in 2023. California contained 32.3% of national R&D value added (contribution to state GDP), largely stable from 32.0% in 2022 and down only slightly from the recent peak of 33.5% in 2020. California had an even stronger lead in the portion of R&D by businesses, and only federal and other nonprofits R&D fell below California’s overall GDP share of 14.0%. R&D supported 687,900 jobs, up 2.1% from 2022.
By total contribution, business R&D dominated California activity in this field, comprising 93.7% of the overall $226.5 billion value added in 2023. This number, however, came prior to the state’s limitations enacted in 2024 on the R&D tax credit to raise revenues to cover its deficit spending.
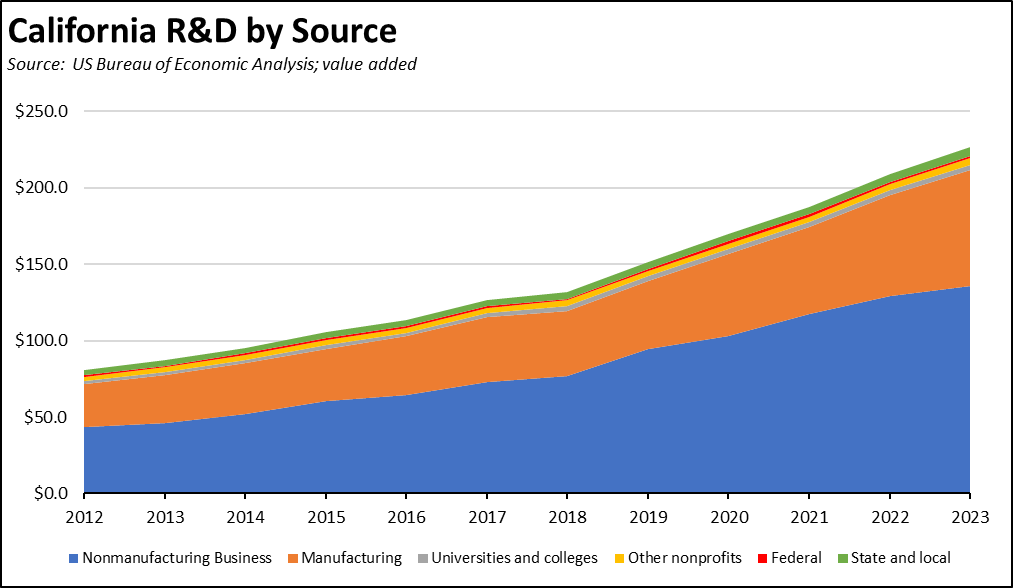
As indicated by the scale of business R&D, this activity is a key element in the state’s competitiveness and its ability to generate future jobs and public revenues. State policy, however, has been contradictory on this issue. After decrying cuts in federal research spending—which comprises only 0.7% of the state’s total—several legislators recently proposed a $23 billion bond to provide a state replacement for the federal funds. Yet California continues to limit the R&D tax credit that has underlaid business activities responsible for 93.7% of the total. No comparable bond has been proposed so far to replace the private R&D spending that is being lost as a result.
CaliFormers
Additional CaliFormer companies identified since our last report are shown below. The listed companies include those that have announced: (1) moving their headquarters or full operations out of state, (2) moving business units out of state (generally back office operations where the employees do not have to be in a more costly California location to do their jobs), (3) California companies that expanding out of state rather than locate those facilities here, and (4) companies turning to permanent telework options, leaving it to their employees to decide where to work and live. The list is not exhaustive but is drawn from a monthly search of sources in key cities.