The Center for Jobs and the Economy has released our full analysis of the December Employment Report from the California Employment Development Department. For additional information and data about the California economy visit www.centerforjobs.org/ca.
Highlights for policy makers:
- Jobs Post Above Average Growth for the Year
- But for the State Budget, It’s Not the Number of Jobs that Count—It’s the Type
- Employment Drops for 6th Month in a Row
- LAO: State’s UI Trust Fund is Now "Structurally Insolvent"
Jobs Post Above Average Growth for the Year
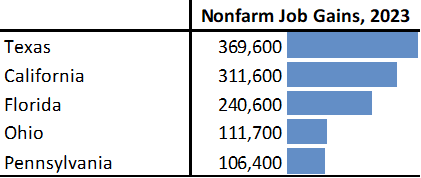
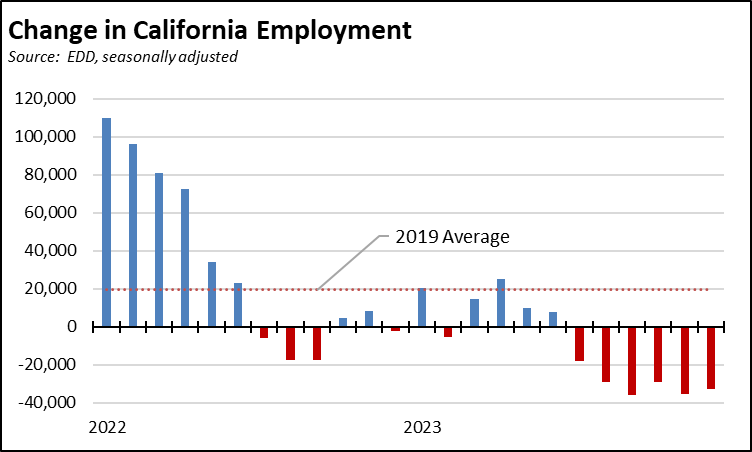
As discussed in our preliminary report, nonfarm jobs rose 23,400 in December, bringing the preliminary job gains for all of 2023 to 311,600 (seasonally adjusted) and coming in 26% better than the average monthly jobs gain of 20,500 in pre-pandemic 2019. The total placed California in second place, behind Texas with a gain of 369,600. The job numbers as with the employment numbers below, however, are subject to change in the upcoming March revisions.
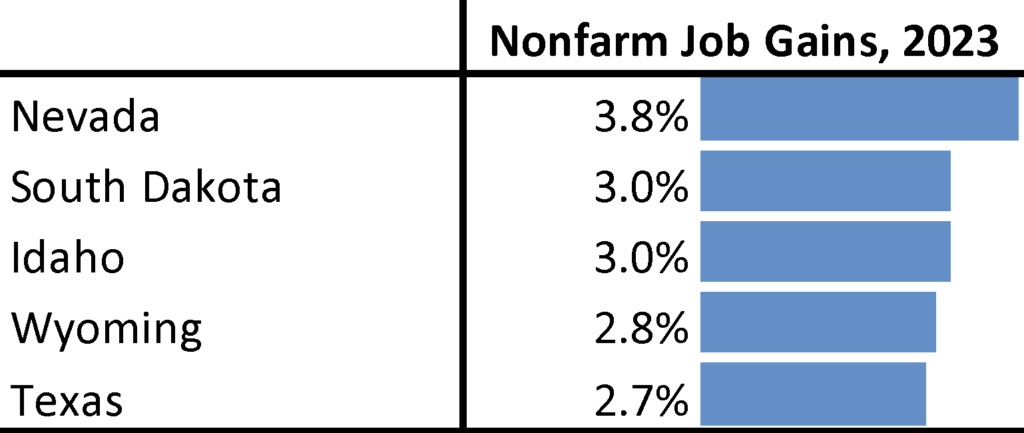
Adjusting for size, California had a nonfarm jobs gain of 1.7% over the year, the 23rd highest among the states and DC. Nevada led with a 3.8% growth.
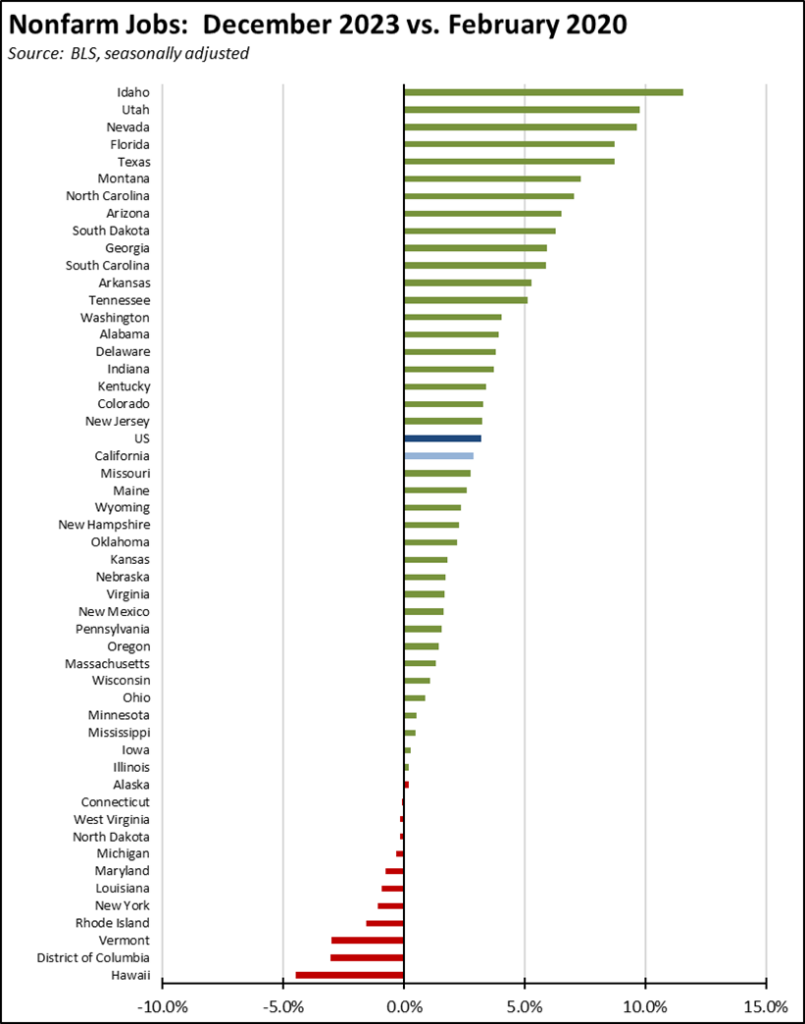
Comparing net jobs creation since the pre-pandemic peak, California remains in 3rd place with real nonfarm jobs growth of 508,100. Texas led with 1,132,000, followed by Florida with 793,100. Again adjusting for size, California remained 21st highest, just below the overall US average.
But for the State Budget, It’s Not the Number of Jobs that Count—It’s the Type
The health of the state budget—magnified by the current spending trajectory—has become overly dependent on job outcomes in the Bay Area and more specifically from that region’s Tech Industry. The exact numbers are difficult to determine precisely as which businesses qualify under this category vary widely by definitions used in the various studies and analyses. Our report on the January 2021 data compared the results from three leading estimates, and developed the Center’s own composite definition for High Tech. That definition, however, depends on Quarterly Census of Employment & Wages data that will not be released until later this year.
Using instead the Current Employment Statistics data for comparable categories where available, total California High Tech employment showed little change over the year, dropping 25,500 and with most of the loss in the manufacturing components. While the numbers in the chart do not fully track with our 2021 definition, they do cover the major sub-industries.
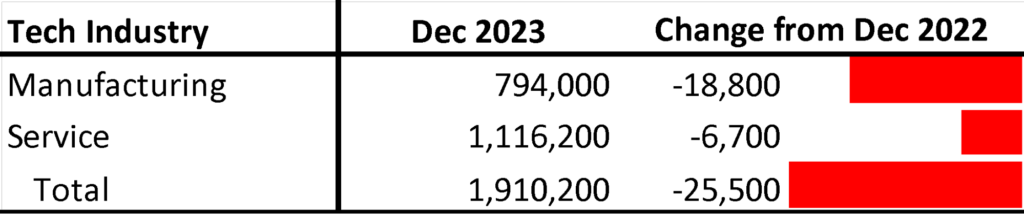
These jobs are critical to the state budget particularly as tech driven revenues again are crashing as they did in the early 2000s. Jobs growth of more importance to most of the state’s households, however, is in the other industries, and these are the ones hit hardest by the state’s policies—labor law, energy, taxes and fees, and other regulations that continue to increase the costs of operating a business in this state and the costs of living for their workers. California’s relatively weaker performance behind the two smaller states of Texas and Florida reflects these higher and growing costs.
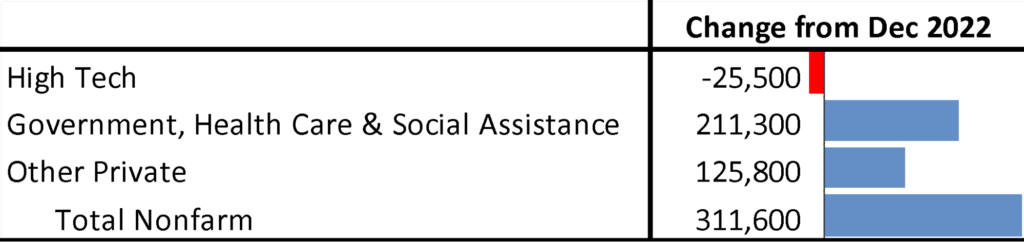
The extent of this issue can be explored by breaking down nonfarm jobs by industry and source of growth. Adjusting for the Tech industry components above, Government, Health Care, and Social Assistance accounted for two-thirds of nonfarm jobs growth in 2023, and all three rely heavily on the public funds that are now faced with multi-year deficits at the state level and unprecedented debt and deficits at the federal level. Government relies wholly on the public revenues that are now dropping. While some organic growth is coming from the aging population, the growth in Health Care has relied heavily on expansion of public funding including expansion of the state programs that now face projected revenue shortfalls over the next several years. Growth in Social Assistance comes primarily from expansion of very low wage, publicly funded In Home Supportive Services (IHSS) positions.
In contrast, other private businesses using their own resources expanded 125,800 (seasonally adjusted) jobs over the year under the state’s increasingly hostile business climate, or only 0.7% above total nonfarm jobs in December 2022.
Employment Drops for 6th Month in a Row
Employment dropped for the 6th month in a row, down 32,800 in December. The total number of unemployed also increased by 29,200, with the combined result increasing the state unemployment rate to 5.1%. As a result, California moved into first place for the highest unemployment rate among the states and DC.
For the year, employment was off 108,200, and unemployment up 192,700. California’s unemployment rate was a full point higher than the 4.1% experienced in December 2022.
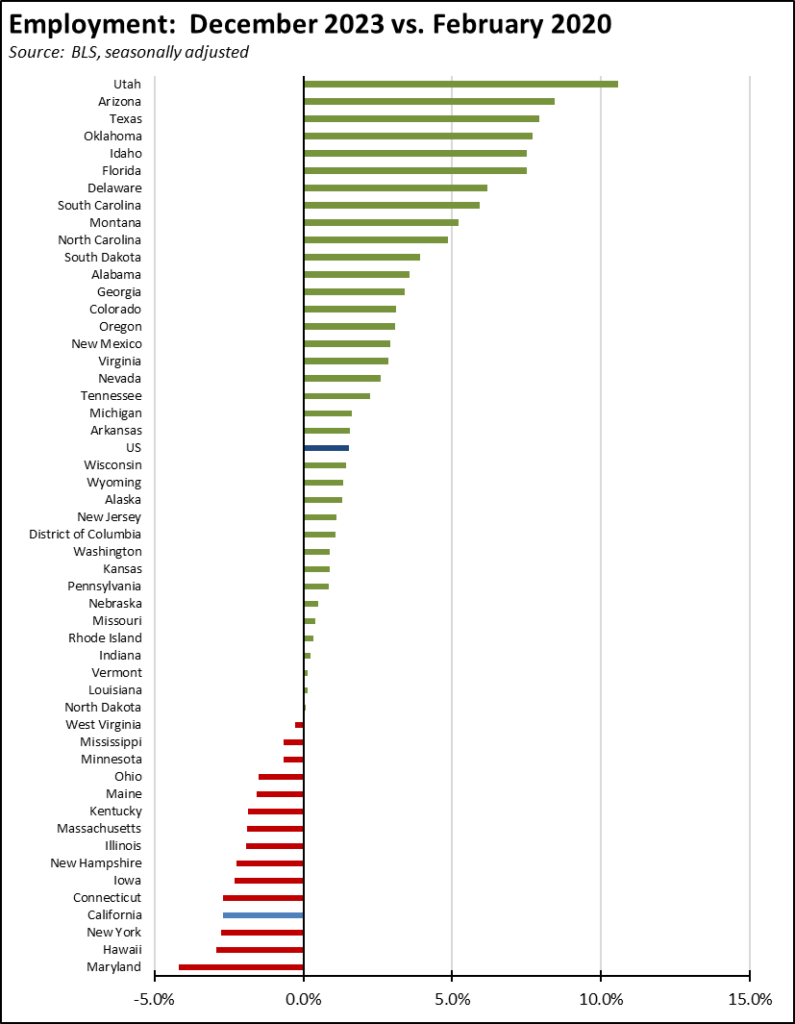
The unbroken string of employment losses continues to push the state further away from recovery as defined by the pre-pandemic employment level. Again adjusting for size, California dropped to 48th highest among the states and DC, ahead of only New York, Hawaii, and Maryland.
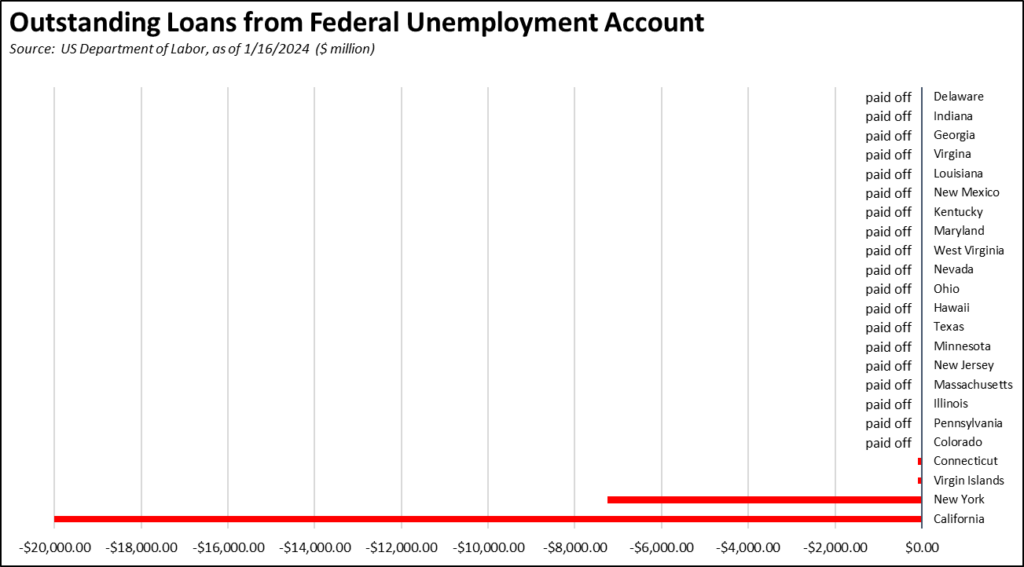
LAO: State’s UI Trust Fund is Now "Structurally Insolvent"
Continuing weakness in the employment numbers continues to put additional pressures on the state’s growing unemployment insurance fund debt. By failing to use the federal pandemic funds provided specifically to help states rebuild their funds—as used by every other state except New York—California’s fund continues to sink further into debt even while jobs are growing and the long-predicted recession has yet to appear.
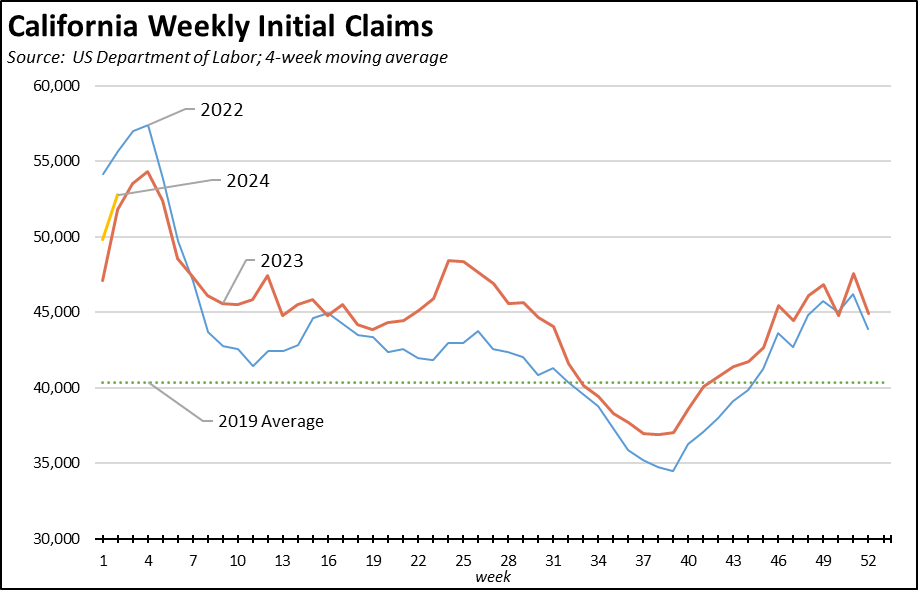
Weekly initial claims (4-week moving average) began the year slightly above the 2023 level, but still below the comparable period in 2022. The use of an average masks the fact that initial claims for the week ending January 13 were at their highest level since June, while nationally initial claims (not seasonally adjusted) saw a 9.3% drop. This outcome only covers one week, and additional weeks will be required to establish a trend.
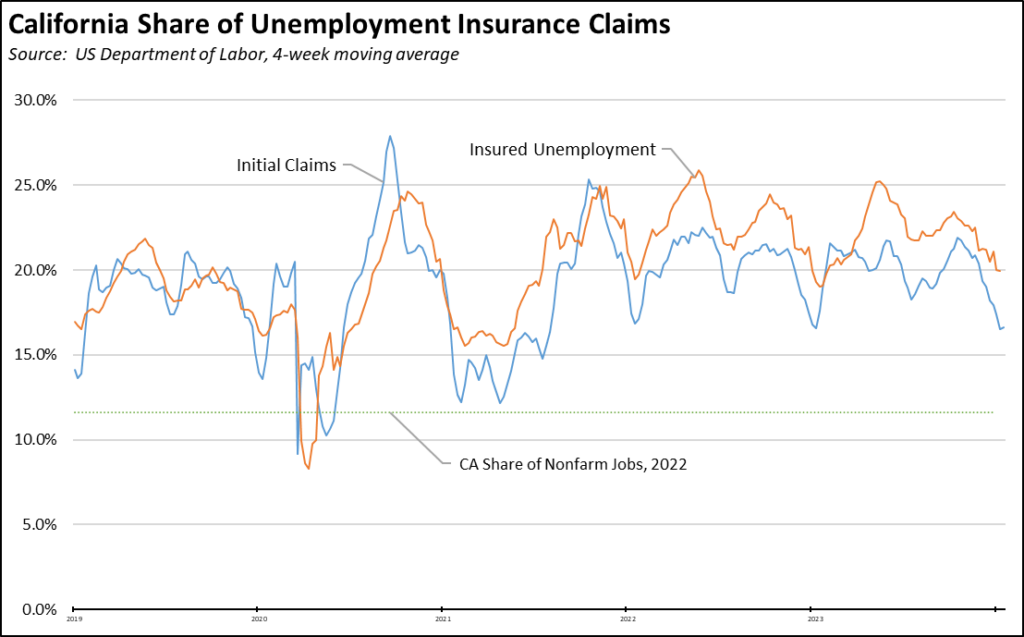
In these latest results, California—which accounts for 11.6% of the nation’s jobs—had 16.6% of all initial claims and 19.9% of all insured unemployment, a proxy for continuing claims.
As a result of the state’s failure to use the federal funds provided specifically to deal with the problem, California’s federal debt now stands at $20.1 billion. Even as employers are being charged higher taxes to pay off this burden, EDD’s most recent projections now expect the size of the debt to grow even in the absence of another economic downturn. Total debt is expected to grow to $20.8 billion by the end of 2024, and $21.0 billion by the end of 2025. This deficit—stemming from the expansion of benefits without changes in funding—has led LAO to conclude that the fund is now “structurally insolvent.”