The Center for Jobs and the Economy has released our full analysis of the February Employment Report from the California Employment Development Department. For additional information and data about the California economy visit www.centerforjobs.org/ca.
Highlights for policy makers:
- Average Hourly Wage Up 3.1%
- Nonfarm Jobs: 32,300 Gain
- Employment Still 243,100 Below Pre-Covid Level
- Labor Force Participation Rate
- Unemployment Rates by Legislative District
- Unemployment Rates by Region
- Employment Recovery by Region
- MSAs with the Worst Unemployment Rates
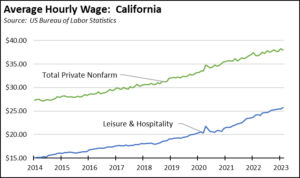
Average Hourly Wage Up 3.1%
The average private nonfarm hourly wage rose 3.1% for the year in February, while lower wage Leisure & Hospitality saw higher gains of 6.5%. As shown in the chart below, the total number began a steeper rise at the beginning of the pandemic period primarily from a composition effect. The state’s job policies in this period had a much greater effect on lower wage jobs, removing them from the calculation and raising the overall average. This effect has diminished substantially, although as discussed in a subsequent section, many lower wage industries have yet to pass the pre-pandemic peak recovery level.
These wage levels, however, also have to be considered from the standpoint of inflation which has diminished the real value of wages. Since the current inflationary upsurge began in March 2021, the California CPI rose 10.8% through the latest data for December. In this period, the average private nonfarm hourly wage grew 5.8%, with this rate in part reflecting the reopening of the previously closed lower wage jobs. Leisure and Hospitality, however, grew faster than inflation at a total rise of 17.6%.
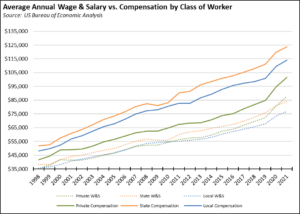
Wages and salary, however, only represent a portion of total worker compensation as benefits have become a larger part of the overall package. While the 2022 data will not be available until September, the data through the first two years of the pandemic period show strong growth in both average annual wage/salary and total compensation.
In the chart below, the results for the private sector averages are biased upwards as a result of the composition effect mentioned above, with many lower wage jobs removed from the workforce and the overall average consequently rising. The results shown for state and local workers, however, are not affected by this factor and in contrast to the previous recession beginning in 2008, show a substantial rise in this initial pandemic period. The average private sector wage/salary is shown rising above the state average in 2021, but as a result of this composition factor.
Putting this consideration aside, average annual wage/salary has tracked closely across these three classes of workers, with the state average generally above and at times growing faster.
Total compensation, however, shows considerably wider gaps. In the data, compensation includes wages and salaries, actual and imputed contributions for pension and insurance funds, and employer contributions for government social insurance. It does not include higher levels of vacation and holiday hours, value of permanent employment for public workers, and essentially guaranteed raises through step increases and cost of living adjustments.
In the latest results, the benefits covered by the compensation numbers were 16% for private workers, 47% for state workers, and 48% for local workers. Average compensation for state workers was 31% higher than private workers in 2019 (last year without the composition effect) and 21% in 2021. The comparable numbers for local government workers were 19% in 2019 and 12% in 2021.
Nonfarm Jobs: 32,300 Gain
Nonfarm wage and salary jobs were up 32,300 (seasonally adjusted) in February, while the previously reported January gains were scaled back 29,100 to 67,600.
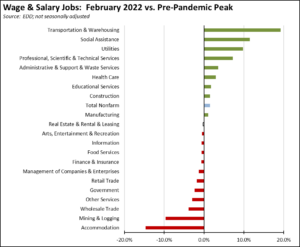
Using the unadjusted series, recovery beyond the pre-pandemic peaks continues to vary widely across industries. Job growth remains highest in the generally blue-collar, middle class wage Transportation & Warehousing and in lower wage Social Assistance, which is largely composed of government-funded In-Home Supportive Service (IHSS) workers. Transportation & Warehousing while continuing to lead in overall job creation in February, was down 3.8% from its recent high in December 2022.
Jobs recovery continues to lag the most in Accommodation, one of the industries hit hardest by combination of the state-ordered shutdowns and the collapse of travel during the pandemic, and Mining & Logging, a generally blue-collar, higher wage industry specifically being targeted for reductions by state policies.
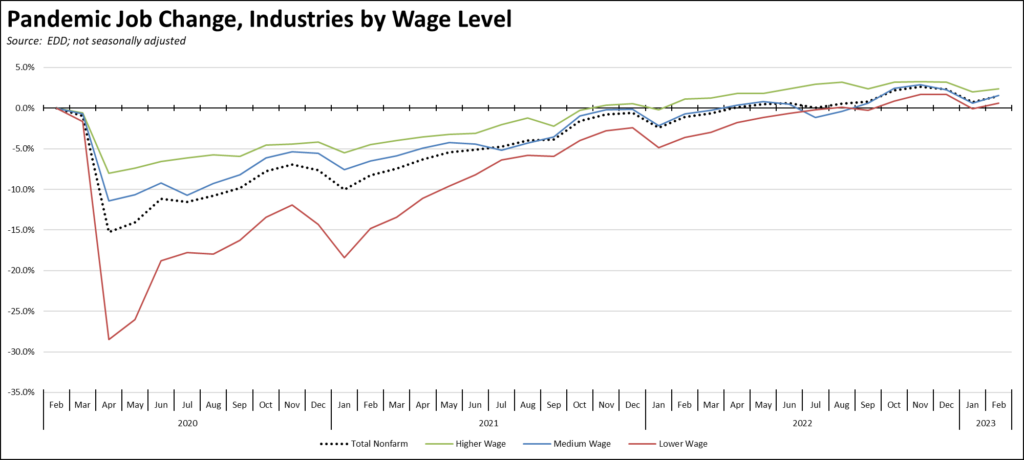
By wage level, again using the unadjusted series, all three job groupings remained above the pre-pandemic peaks. Higher wage industries—which were the least affected by the state pandemic job policies—saw the earliest recovery but have remained largely stable due to the tech industry layoffs and slowed hiring. Middle wage industries continued to track the overall economy, while the lower wage industries showed some growth above recovery levels even after accounting for seasonal factors.
Employment Still 243,100 Below Pre-Covid Level
Employment (seasonally adjusted; February preliminary) was essentially unchanged with a dip of 5,400. The number of unemployed rose 26,700.
The reported unemployment rate notched up 0.1 point to 4.3% largely due to small growth in the labor force. California had the 8th highest unemployment rate among the states, and contained 14% of the total number of unemployed workers in the US.
In the national numbers, total US employment grew by 177,000, and the number of unemployed grew by 242,000. Again, as the result of labor force growth, the reported unemployment rate was up 0.2 point to 3.6%.
![]()
Labor Force Participation Rate
The California labor force participation rate edged up 0.1 point to 62.2%, while the US number also rose 0.1 point to 62.5%. The California rate still remains below the pre-pandemic level of 63.0%, which in turn was down substantially from prior years. Accounting for workers leaving the workforce since February 2020, there were an estimated 1.0 million out of work in February 2023.
Unemployment Rates by Legislative District
We will be pausing publication of these estimates until the necessary data is available for the new legislative district boundaries from the American Community Survey.
Unemployment Rates by Region
Unemployment rates (not seasonally adjusted) compared to pre-pandemic Feb. 2020 are shown below.
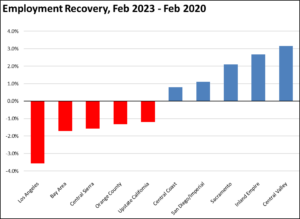
Employment Recovery by Region
Los Angeles Region continues to lag the rest of the state in recovery to the pre-pandemic peak employment levels (not seasonally adjusted). Upstate California remains in the negative column primarily due to seasonal factors.
MSAs with the Worst Unemployment Rates
The number of California MSAs among the 25 regions with the worst unemployment rates in January rose from 9 to 12. Los Angeles-Long Beach-Anaheim MSA was largely unchanged at #297 in a tie with 6 other MSAs in other states. The best performing California urban region was again San Jose-Sunnyvale-Santa Clara MSA, dropping to a tie with 14 other MSAs at #103, with an unemployment rate of 3.1% compared to the best performing regions, Rapid City, SD MSA and Sioux Falls, SD MSA, at 1.9%.