The Center for Jobs and the Economy has released our full analysis of the January Employment Report from the California Employment Development Department. For additional information and data about the California economy visit www.centerforjobs.org/ca.
Highlights for policy makers:
- February Job Numbers Signal Weakness in the California Economy
- Employer Hiring Plans Improve Modestly
- The Unknown Federal Factor
February Job Numbers Signal Weakness in the California Economy
As detailed in our preliminary analysis of the February economic data, signs are pointing to continued weakness in the state economy:
- Nonfarm wage and salary jobs fell in both January and February, for a combined loss of 28,900. These latest declines come on top of the annual data revisions, which reduced the estimated number of jobs in the state at the end of 2024 by 97,000.
- Employment—the number of workers—was more positive, rising 27,700 over the two months. However, the rate of increase was only 0.15% compared to 1.1% in the overall US average.
- More critically, California is not creating jobs to match the skills available in its unemployed work force. Unemployment remained at 5.4%, the second highest unemployment rate tied with Michigan and DC and just behind Nevada. The number of unemployed, which only dipped slightly, remained above the 1 million mark for the 14th month in a row. Compared to an 11.4% share of total population, California contains 15.0% of the nation’s officially unemployed, counting only those looking for work and not additional discouraged and marginally attached workers.
- Jobs growth remains concentrated in government and government supported Healthcare & Social Services, while other private industries in total continue to shed jobs. California’s economy continues to depend on using public funds to buy jobs rather than maintaining competitive policies enabling the private sector to create them.
- California Real GDP grew at an anemic annualized rate of 1.4% in the 4th Quarter of 2024, below the US average of 2.4% and 44th highest among the states. Government and government-supported Healthcare & Social Services were the source of 55% of net Real GDP growth in the 4th Quarter (vs. 25% in the 3rd Quarter), while the budget-critical High Tech industry embedded in Information and Professional, Scientific & Technical Services contributed only 4% (vs. 34% in the 3rd Quarter).

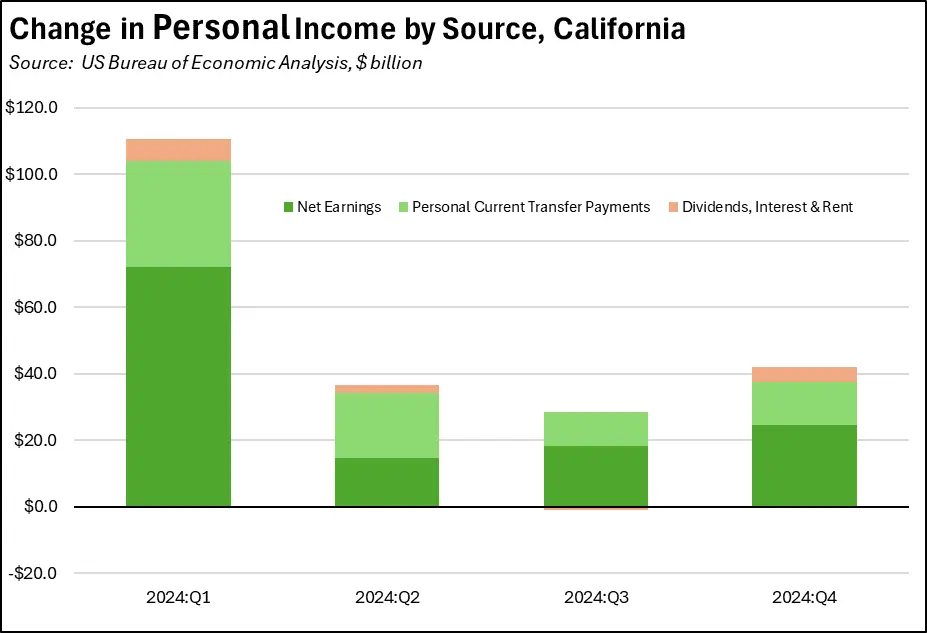
- California Personal Income was somewhat more positive, growing at an annualized rate of 5.1% in the 4th Quarter, above the US average of 4.6% and 13th highest among the states. Compared to its 11.4% share of population, California’s reliance on current transfer payments is higher at 12.5% of the national total.
Employer Hiring Plans Improve Modestly
Coming off a low point in the 3rd Quarter last year, employer hiring plans as represented by unfilled job openings have shown modest improvement in the last few months. Unfilled jobs indicate the immediate potential for jobs expansion in the near term assuming the appropriately skilled labor force is available. California’s potential—as measured by the job openings rate (job openings as a percent of jobs plus job openings)—at 3.8% in January was 48th highest among the states and DC and remains below the US average of 4.6%. Job investments and expansion potential continue to be substantially higher in the other states.
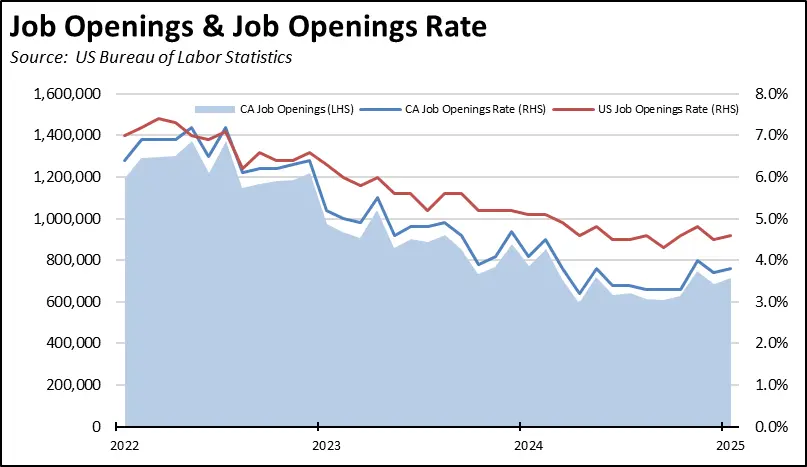
The inventory of unfilled jobs also shows few prospects for major inroads into the state’s high unemployment levels. Measured by the number of unemployed to job openings ratio, California is the lowest among the states, with 1.5 unemployed workers for every available job opening. By comparison, the overall US average is 0.9 worker per job opening, and individual states range as low as only 0.4 worker per opening.
The Unknown Federal Factor
Current efforts by the Trump Administration to reform federal programs and bring the unsustainable federal deficit under control creates another source of uncertainty over the future jobs trend in general and the ability of state and local budgets specifically to continue funding the dominant source of the state’s jobs growth. With the sustained rise in regulations, taxes, and fees heavily affecting private sector jobs, the state instead has come to rely on buying jobs through state and local spending, with a heavy reliance for this purpose on the federal funds. Among the important considerations are the following issues:
- California has more federal jobs than any other state. In the latest numbers for February 2023, California had 251,100 federal (include Defense) jobs, or 1.4% of the state’s total nonfarm jobs (not seasonally adjusted). This number has been essentially level, growing only by 3,300 since February 2022. The more appropriate comparison base for DC, however, is the DC MSA incorporating both the District and surrounding suburbs. On this basis, California comes in second behind the DC metropolitan region with 374,600. California has 8.4% of all federal jobs. Direct reductions in federal jobs consequently are likely to affect California to a greater extent other than the DC core.
- Federal jobs within the state cover a wide range of skill and wage levels. The following table shows the more detailed distribution from the latest Quarterly Census of Employment & Wages.
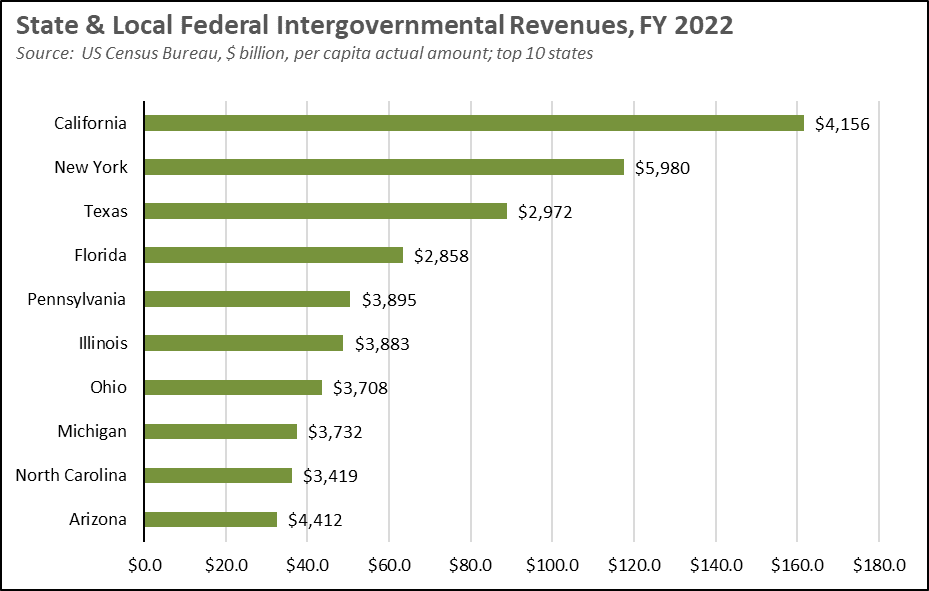
- Using the most current data from US Census Bureau, California state and local budgets received $161.7 billion in intergovernmental revenues from the federal government in FY 2022, the highest of any state. California received 12.9% of all federal funding, above its population share that year of 11.7%. On a per capita basis, California’s $4,156 was 18th highest among the states and DC, and well above the leading job creating states Texas ($2,972), Florida ($2,858), and North Carolina ($3,419).
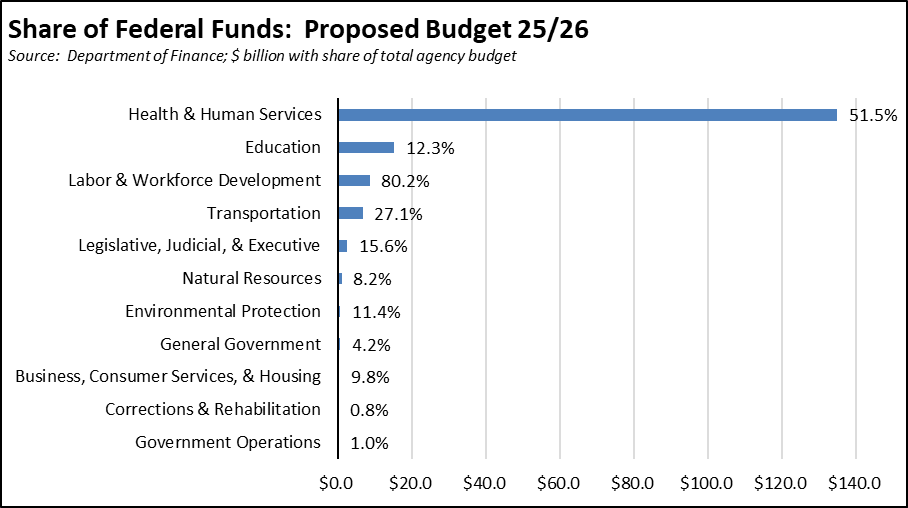
- Federal funds are expected to support 34.6% of total expenditures contained in the governor’s Proposed Budget for 2025/26. The expected $170.6 billion federal funds are distributed across the various agencies as shown in the following chart, ranging up to 80.2% of total expenditures for Labor & Workforce Development and 51.5% for Health & Human Services. The HHS component in particular is a key source of the state’s current job growth, supporting the Healthcare jobs component as well as the minimum wage, part-time, and limited term In-Home & Supportive Services (IHSS) jobs that make up a major share of the state’s jobs growth. This chart does not include the $21 billion and growing Unemployment Insurance Fund debt to the federal government.
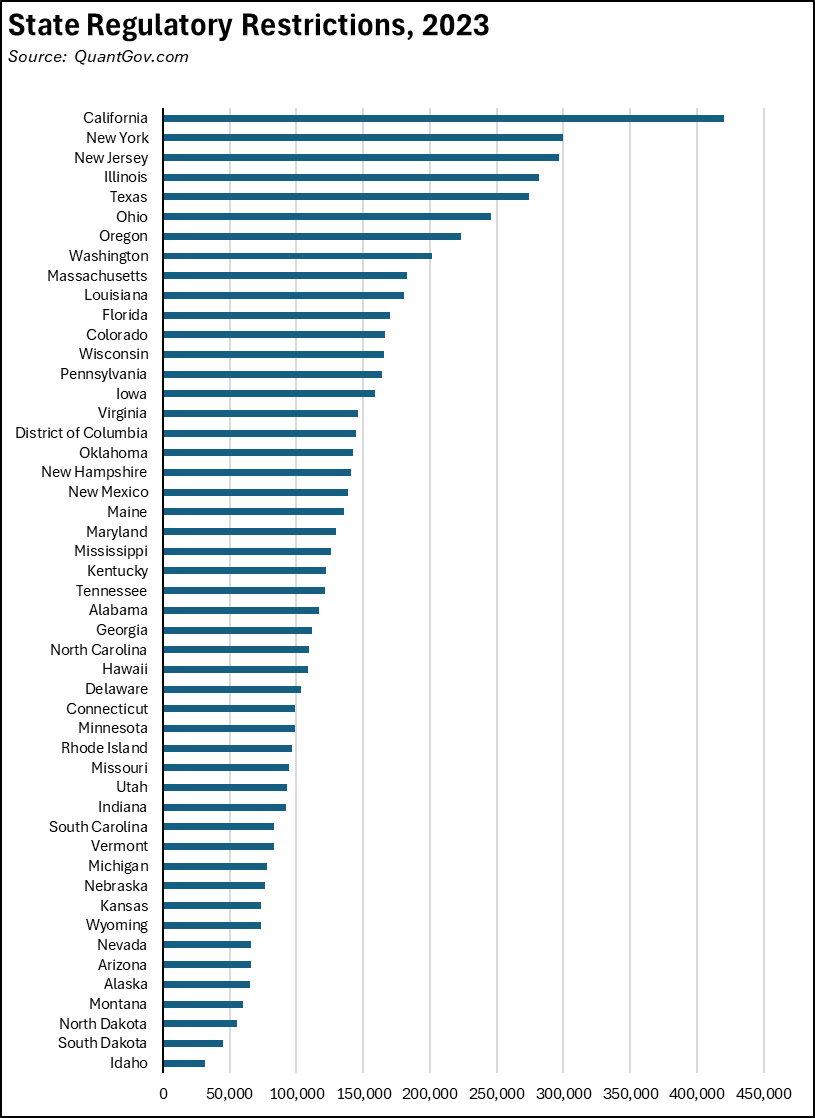
- As federal regulations are reformed under current efforts, differences in state regulatory burdens will become more apparent and likely to become more significant in overall capital and job investments. On this basis, California’s burden is not just higher, it is substantially higher than any other state. Putting aside the 11 states that have already launched their own DOGE efforts to increase their competitiveness, QuantGov.com provides a quantitative comparison tracking state regulatory restrictions by year. In the most current data for 2023, California led with 420,434 regulatory restrictions, while second place New York had 300,095 and lowest rated Idaho had only 31,497. The chart below covers only state regulations. California is also fairly unique in its proliferation of regulatory authorities across a multitude of regional and local authorities.