Highlights for policy makers:
- Nonfarm Jobs Down 19,900 in February; 2nd Worst Among the States
- Policy Matters
- Unemployment Above 1 Million Since 2024; Black Unemployment at 10%
- Public Pessimism About the Economy at Recession-level Highs
Nonfarm Jobs Down 19,900 in February; 2nd Worst Among the States
In February, California posted a preliminary loss of 19,900 nonfarm jobs (seasonally adjusted), the 2nd worst result among the states and above only New York. The job numbers, however, were affected by strikes, as will be the upcoming results for March as union members returned to their jobs. Combining these issues with the relatively high seasonal adjustment factor for January, the job reports will not be showing more normalized results until the April estimates are released.
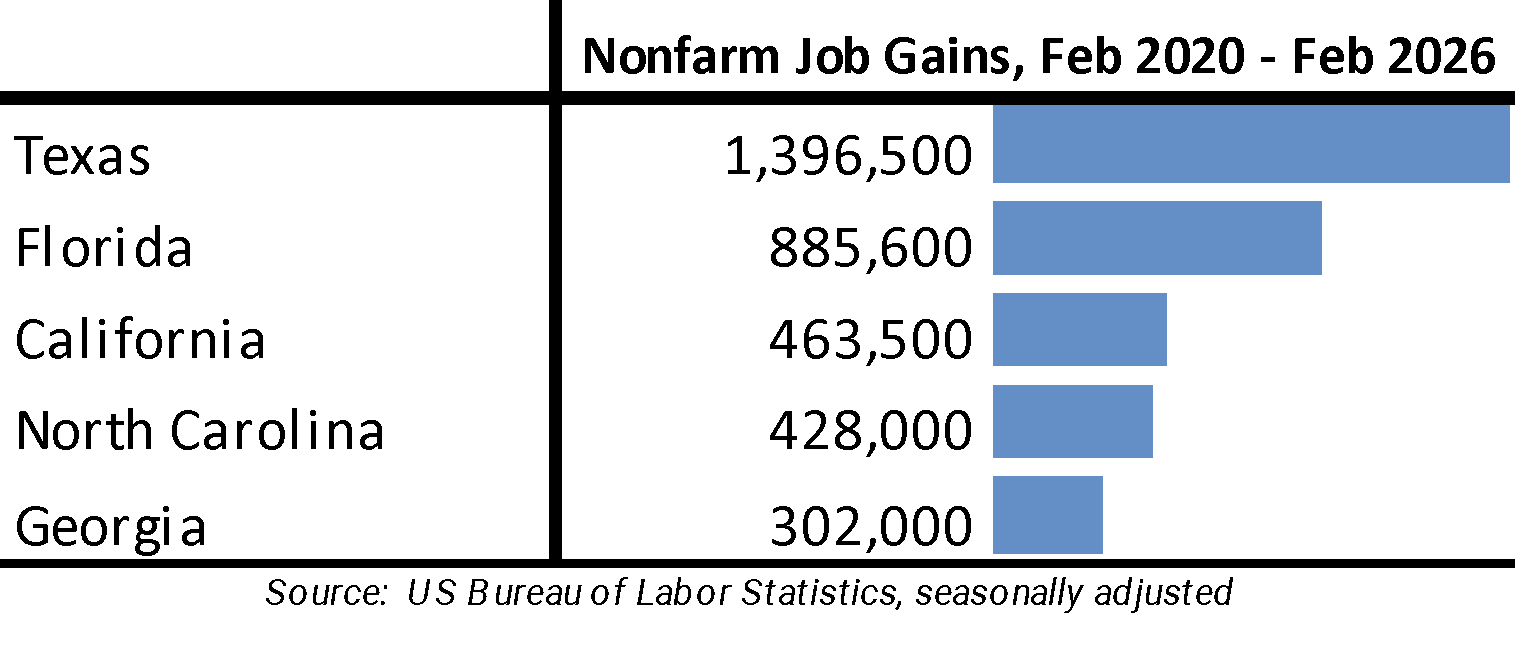
Comparing net job gains from the pre-pandemic peak, California still remained in 3rd place, but by only 35,500 ahead of much smaller North Carolina. California’s net job gains to date are under a third of those posted by Texas and just half of the Florida results.
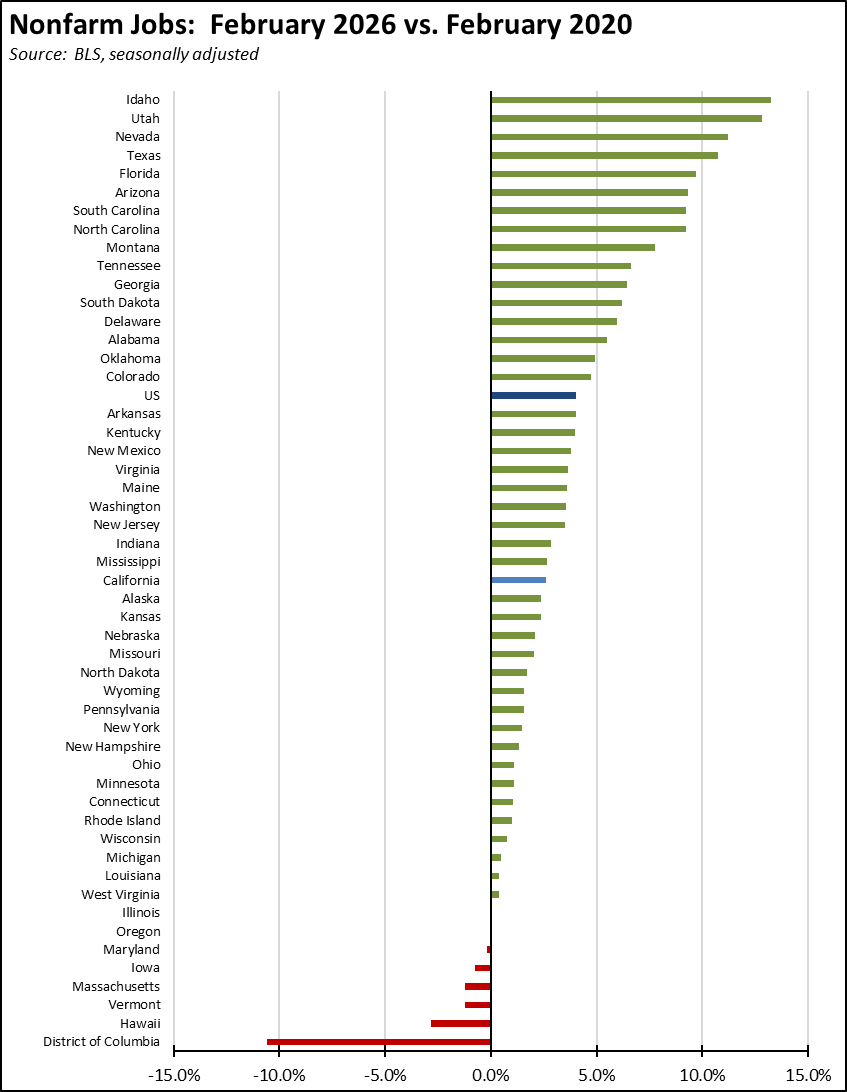
Adjusted for size, California’s job performance continues to rank in the middle, at 26th highest among the states and DC. Five states and DC have yet to recover to their pre-pandemic levels.
Policy Matters
California’s relatively weak job performance—in particular the jobs stagnation of the past two years—stems largely from factors limiting job creation in the private sector.
Although the industry has shown some geographic dispersion, California remains the center for the high tech industry, including the current shift to AI. But that status is reflected in the industry’s outsized contributions to state income, state GDP, and state revenues. Beyond the Bay Area, however, the industry has not been a significant contributor to overall state jobs since its surge in the twenty-teens, as support and ancillary operations such as manufacturing have gone to other states and countries and more recently as the industry pursues restructuring under the general mantle of the current AI shift.
As we have discussed previously, the state’s job picture instead has been sustained by government and government-supported Healthcare & Social Assistance as the result of substantially increased expenditures from both state and federal funds in recent years. These jobs came from the temporary surge in federal pandemic assistance funds and, as is the case of California, temporary surges in PIT revenues along with the continuing increase in Medicare spending as the population ages. As these funds recede, so will the ability of the state to support the expenditures behind these jobs.
This result is shown by drilling down in the previous chart. As indicated, California Total Nonfarm Jobs have gained 2.6% since the pre-pandemic peak. All Private Nonfarm Jobs—including Healthcare & Social Assistance—have grown 2.8%. But Other Private Nonfarm Jobs—excluding Healthcare & Social Assistance and representing 68% of the state’s total jobs base—have shrunk by 1.8%. As shown in the chart, all the worst-performing states are marked by this weakness as well, while all the top-performing states show more balanced jobs growth.
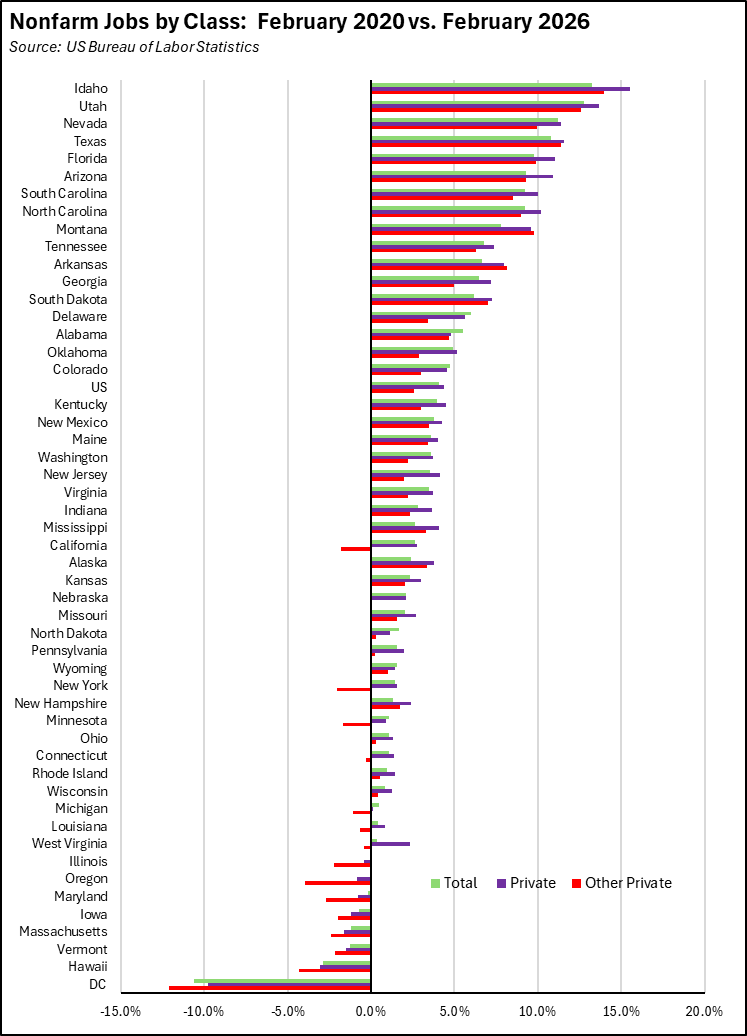
The best and worst performing states have more in common. While not necessarily the only factor leading to these outcomes, the best performing states measured by Other Private Jobs growth tend to be low tax and lower regulation, while the worst performing states (putting DC aside) fall on the opposite end of the scale:
- The best performing states have low or no personal income (PIT) and corporation income tax (CIT) rates, with an average top rate of 3.2% for PIT and 3.6% for CIT. With Iowa as the exception, the worst performing states are significantly higher, with an average top rate of 8.8% for PIT and 8.1% for CIT. California has the highest PIT rate and the 6th highest CIT rate in 2026. All tax rates are from Tax Foundation.
- Tax rates in the top performing states are also becoming lower. Since 2020, all 7 of the top performing states with a PIT have reduced their top rates, while 5 of the 8 with a CIT have reduced those top rates as well. Florida is a special case. Their temporary CIT rate reductions during the pandemic expired in 2022. While the table consequently shows the rate increasing by 1% from 2020, the rate simply returned to the pre-pandemic level. On the other end, 3 of the worst performing states increased their top PIT rate and 1 increased the top CIT rate. Again as the exception, Iowa substantially reduced both.
- The regulatory component is measured by the change in state regulatory restrictions between 2020 and the latest data for 2023 as catalogued by QuantGov.org. With Texas as the outlier in this case, the highest performing states saw little change in regulations or included 2 of the 6 states reducing regulations through reform efforts in this period. With Iowa as the outlier on the other end, the lowest performing states were more active in increasing the regulatory burden on their employers. California by far ranks the highest by adding nearly 25,000 new regulatory restrictions in this period. At 420,434 in 2023, California also ranks the highest by total number of regulatory restrictions, 42% more than 2nd place New Jersey with only 296,926. Note that data entries are not available for all the states. The QuantGov data does not include 2 states in 2023 and 8 in the 2020 comparison base.
- Although well out of line with the other states, California’s regulatory burden also is undercounted in the QuantGov data that only looks at state regulations. In general, the other states tend to centralize regulations especially the more economically sensitive regulations at the state level. California in contrast delegates a substantial portion of this regulatory power to regional and local agencies such as air districts, other special districts, and local governments, while also allowing—under its tradition of home rule—local agencies to add to state regulations on most issues as long as the state minimum is kept. The result, again unlike most other states, is a general expansion of the state’s already high regulatory burden, especially for those employers operating in more than one location within the state.
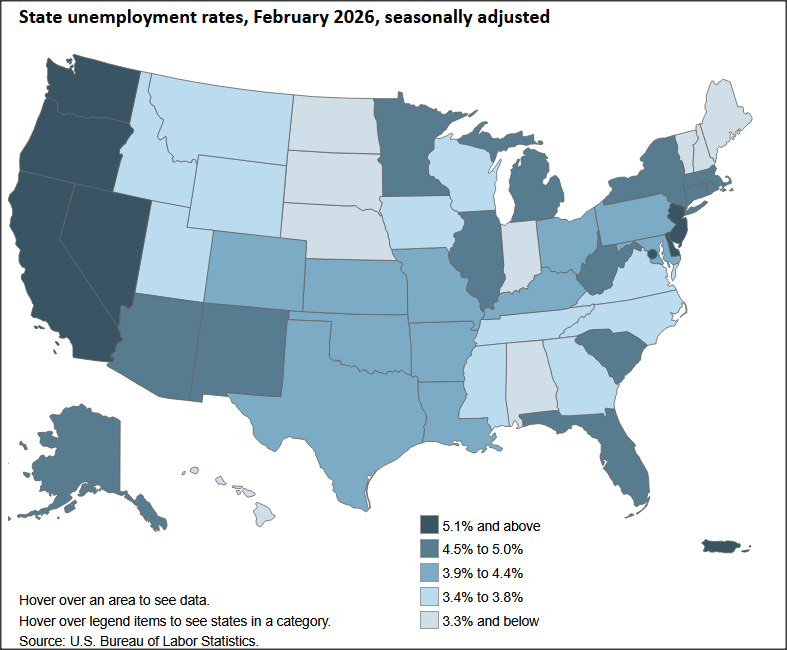
Unemployment Above 1 Million Since 2024; Black Unemployment at 10%
In the preliminary February numbers, California tied with Delaware for the highest unemployment rate among the states at 5.4% (seasonally adjusted). DC again was higher at 6.5%. The US rate was 4.4%.
Reflecting the stagnating jobs picture, the preliminary number of unemployed at 1.07 million remained above the 1 million mark for the 26th month in a row.
The lack of jobs, however, is not evenly spread through the labor force.
By ethnicity/race, Latino and White workers have seen comparable increases in unemployment compared to pre-pandemic February 2020. Asians have seen only a marginal change. Black workers in contrast have seen their unemployment rate nearly double to 10.0%.
By age, prime working age (25-54) and seniors (55+) also have seen generally comparable increases. Youth (16-19) and Young Adults on the other hand have seen more substantial increases as the state and local minimum wages have increased, including in the fast food industry that previously employed many of these workers. The Youth unemployment rate in particular has soared by more than two-thirds, eliminating the early employment and early acquisition of workplace skills that are associated with higher lifetime earnings, especially for workers in the lower educational attainment categories.
Underemployment, measured by U-6, similarly has shown a significant increase. U-6 covers the labor force universe covered in the monthly reported rate, but also includes workers in part time jobs because full time jobs are not available as well as workers who are only marginally attached to the labor force.
Note that the data in the table derives from a different accounting than the model-based monthly estimates, but relies on the same core Current Population Survey (CPS) data. To provide statistically valid estimates, the table data shows the 12 month average from the CPS. As a comparison, the average California rate as shown is 5.3% from this method, while the average of the not seasonally adjusted model-based estimates for the same period is 5.5%.
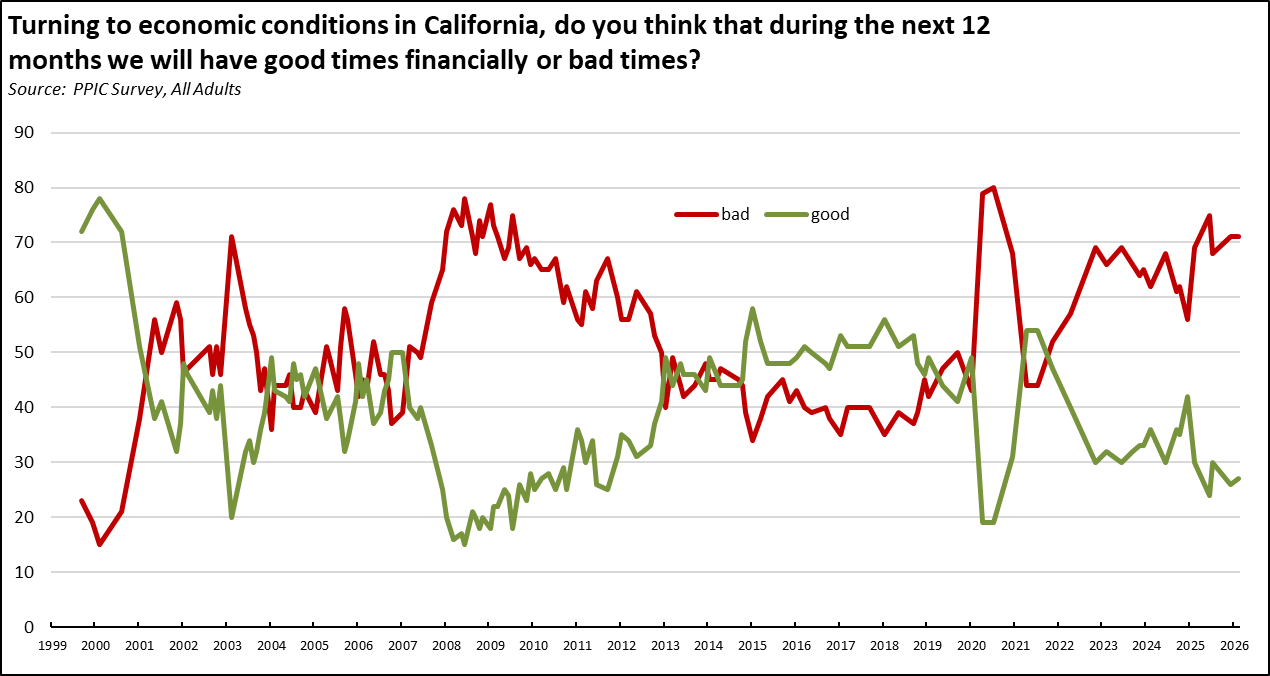
Public Pessimism About the Economy at Recession-level Highs
As a proxy for consumer sentiment, the Center follows the PPIC Survey tracking question: “Turning to economic conditions in California, do you think that during the next 12 months we will have good times financially or bad times?” As reflected in the February 2026 results, 71% of all adults expect bad times ahead, with a gap of 44 points between the pessimists and the optimists. These results mirror responses only seen previously during recessionary periods. These results also mirror the continuing stagnant economic conditions reflected in the jobs and unemployment data along with the continuing pressures of unaffordability in the state.