The Center for Jobs and the Economy has released our full analysis of the January Employment Report from the California Employment Development Department. For additional information and data about the California economy visit www.centerforjobs.org/ca.
Highlights for policy makers:
- Nonfarm Jobs Revisions Drop California's Recovery to 4th Highest
- Nonfarm Jobs By Industry
- Employment Drops in 7 of the Last 8 Months
- UI Trust Fund Goes Further into Deficit
- Business Formations Trend Down in 2023
Nonfarm Jobs Revisions Drop California's Recovery to 4th Highest
As discussed in our preliminary report, nonfarm jobs in January posted a 58,100 gain in the preliminary estimate. While stronger than prior months, January only regained a portion of the ground lost due to the 231,800 downward adjustment in December coming from the annual revision process.
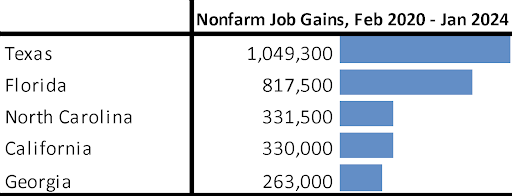
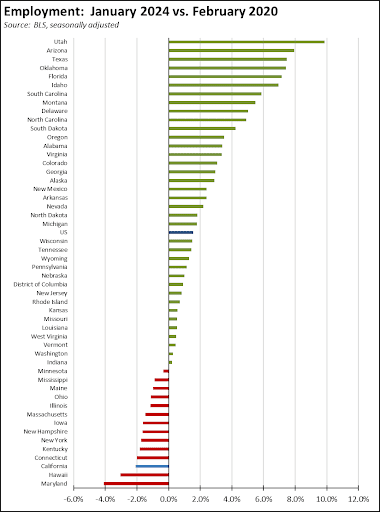
Even with the January gains, California’s recovery from the pandemic period job closures is far weaker under the annual revision than even shown in the previous estimates. California has seen a gain of only 330,000 jobs since the pre-pandemic peak, dropping the state into 4th place behind North Carolina. California’s net job gains in this period were only 6.3% of the 5.224 million jobs created nationally. While California remains the largest economy among the states, jobs expansion has moved to other regions.
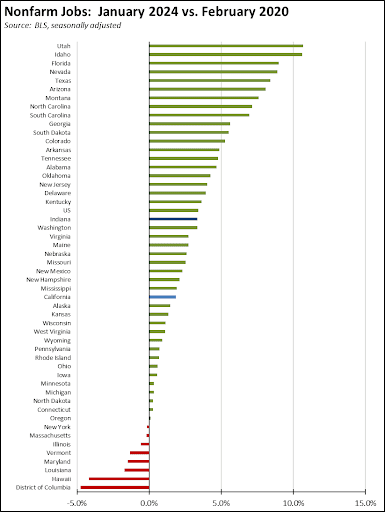
Adjusting for size, California’s recovery rank sinks even lower. While previously tracking close to the overall US average in the preliminary estimates last year, the revised data shows California nonfarm jobs gaining only 1.9% since the pre-pandemic peak, 29th highest among the states and DC and almost half the US average of 3.4%. California in fact ranks only marginally below Mississippi.
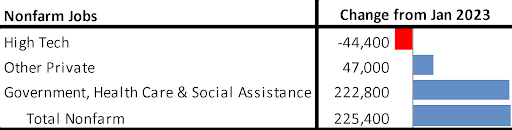
Nonfarm Jobs By Industry
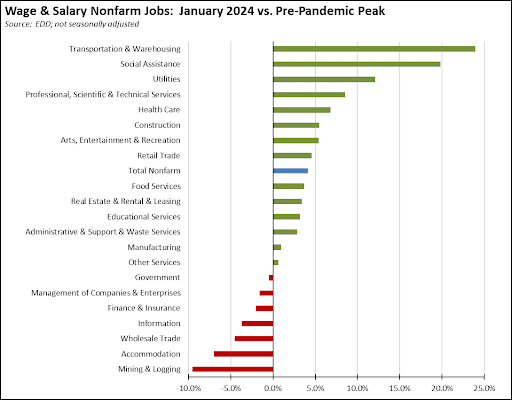
Using the not seasonally adjusted series to show more detail, job growth since the pre-pandemic peak remains concentrated in blue-collar middle class wage Transportation & Warehousing, lower-wage government supported Social Assistance, and higher wage Utilities and Professional, Scientific & Technical Services. Mining & Logging moves into last place, reflecting the success of state policies designed to eliminate a substantial portion of these higher wage blue-collar jobs.
Using the Current Employment Statistics data for comparable categories where available under the Center’s definition of the industry, total California High Tech employment dropped 44,400 over the year, with only about a quarter of the losses coming in the manufacturing components. This drop was just barely offset by gains in other Private industries. The bulk of the state’s job growth came from the industries largely dependent on public funding ranging from 100% in the case of government, to mostly all in the case of Social Assistance and its composition coming largely from In-Home Supportive Services (IHSS) workers, and a mix including the Medi-Cal and Obamacare driven growth in the case of Health Care.
Employment Drops in 7 of the Last 8 Months
In January, employment (the number of people working) dipped by 8,000, and the number of unemployed grew by 23,000. The unemployment rate notched up 0.1 point to 5.2%, the highest since January 2022. Under the revised data, employment has dropped in 7 of the last 8 months. Unemployment has risen in 15 of the last 16.
California’s unemployment rate was the 2nd highest among the states and DC, behind only Nevada with a rate of 5.3%. Adjusted for size, the continued employment losses put California even further back away from the goal of recovery from the pandemic period, pushing the state down to 49th highest, ahead of only Hawaii and Maryland.
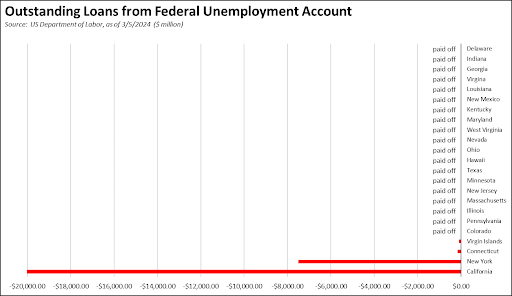
UI Trust Fund Goes Further into Deficit
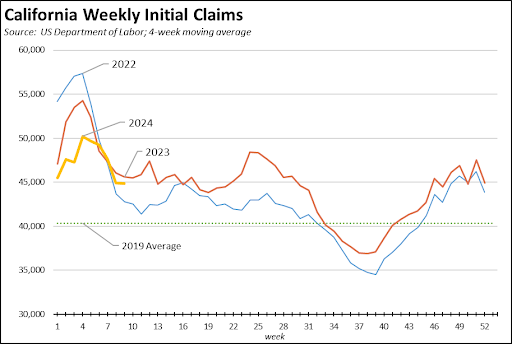
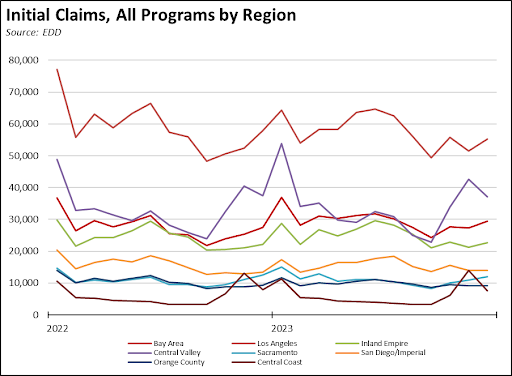
After a more promising start at the beginning of the year—reflecting the January job results—initial claims for unemployment insurance in recent weeks have begun to track the relatively higher trend at the beginning of 2023. As an indicator, initial claims consequently have yet to show much movement away from the recessionary conditions California experienced in 2022 and the first half of 2023.
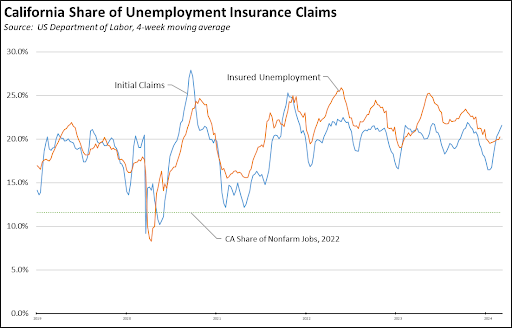
Unemployment insurance claims also remain well above the state’s share of total employment, stemming both from overall job conditions as well as the relatively more generous administration of these benefits under current state law. In the most recent 4-week moving averages, California accounted for 21.6% of all initial claims in the US, and 20.2% of all insured unemployment, a proxy for continuing claims.
As a result of the way California administers the program as well as the diversion of federal pandemic assistance that otherwise could have been used for this purpose, California’s federal fund debt continues to increase. Between December 28 and the latest accounting for March 5, the state’s failure to manage this debt saw it expand by another $800 million.
By region, the largest increases in claims during the last quarter of 2023 were: Central Coast (137.2%), Central Valley (62.3%), Sacramento (44.2%), and Bay Area (20.2%).
Business Formations Trend Down in 2023
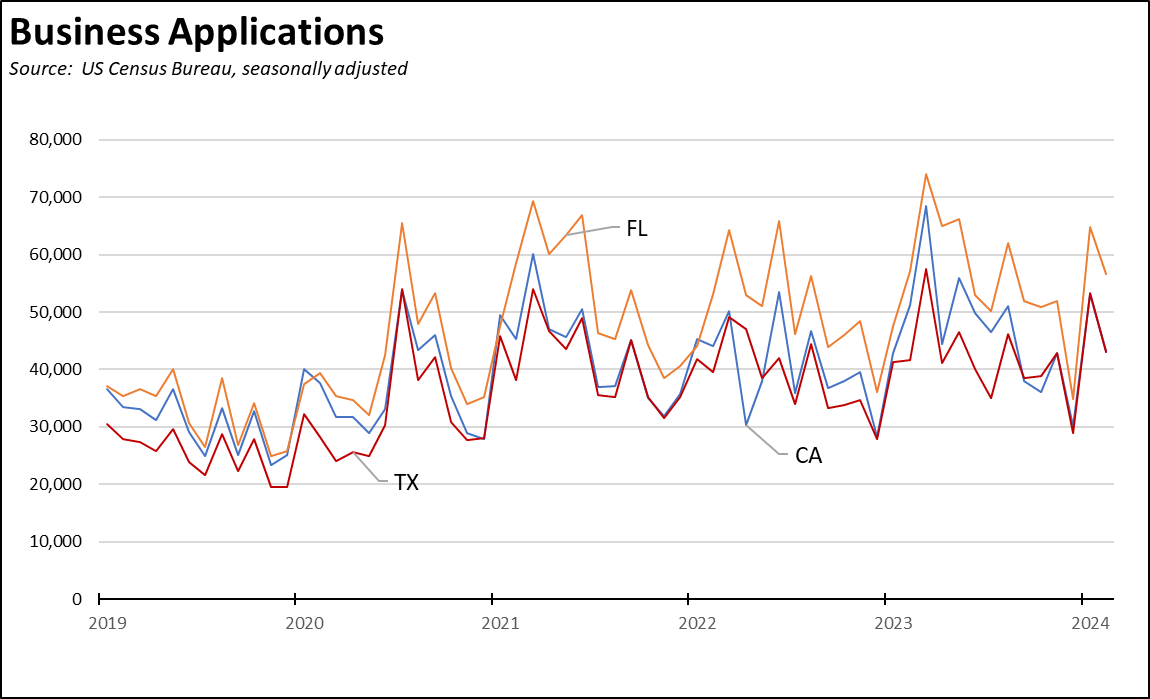
New business formations followed a general decline in 2023, but as in prior years, saw a spike at the end of the year. All business formations generally reflect more on overall economic activity as they capture both new businesses as well as new investments within existing companies organized as separate entities such as an LLC. Business formations with planned wages instead likely indicate a new company. As indicated, the rate of new firms has shown little variation.
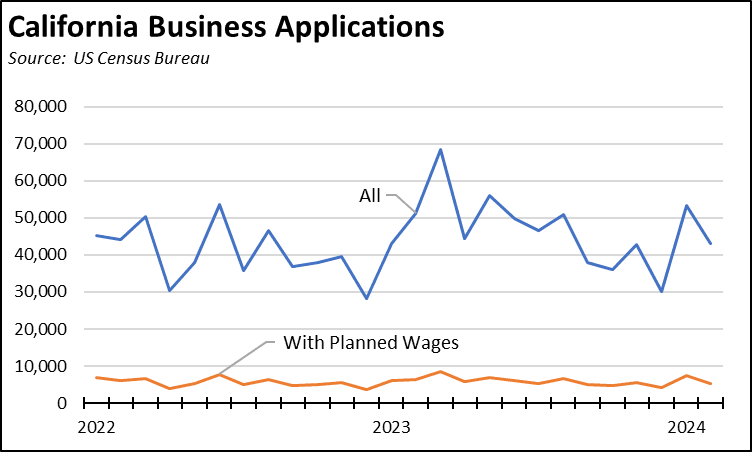
California formation activity also continues to show few differences with those in Florida and Texas. New Florida business formations have outpaced California in most months. The differences between California and Texas, except for the fact that Texas is a smaller state for now, are few.