Highlights for policy makers:
- 2025 GDP Reports: California Slips into 5th Place?
- Personal Income Meets Budget Projections
- Nonfarm Jobs: January Up 93,500; Annual Revisions Show Little Change
- Labor Force: Ties with Delaware for Highest Unemployment Rate; Total Employment Barely Passes Recovery
- Wages Up; Hours Down
- Unemployment Insurance Claims
2025 GDP Reports: California Slips into 5th Place?
US Bureau of Economic Analysis just released the 2025:Q4 and full year 2025 estimates for GDP and Personal Income.
In the 4th Quarter, California’s real GDP grew at an annualized rate of 0.9%, tied with New Jersey as the 18th highest among the states but above the revised US average of 0.5%. California’s growth rate was down from 4.5% in the prior quarter and from 2.5% in 2024:Q4.
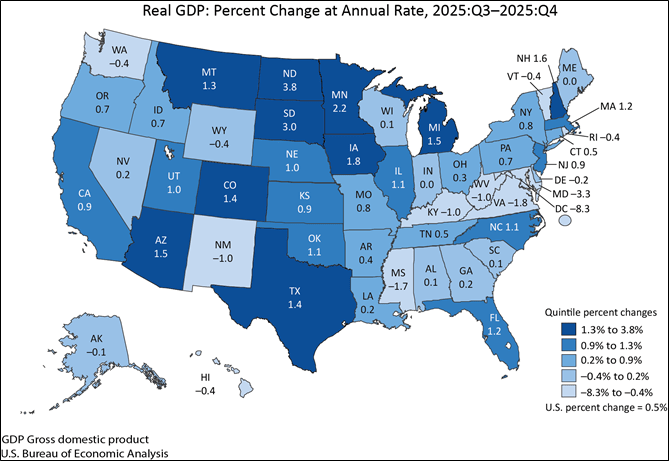
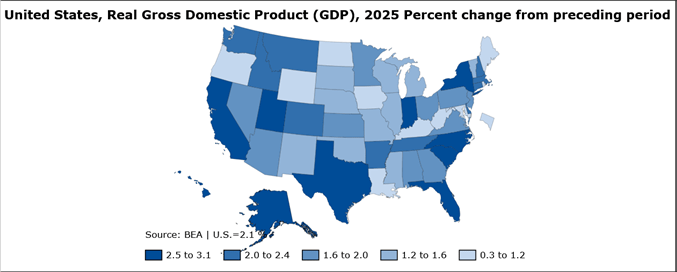
For the year, California Real GDP grew 2.5%, tied with Texas and Indiana for the 7th highest but above the US average of 2.1%.
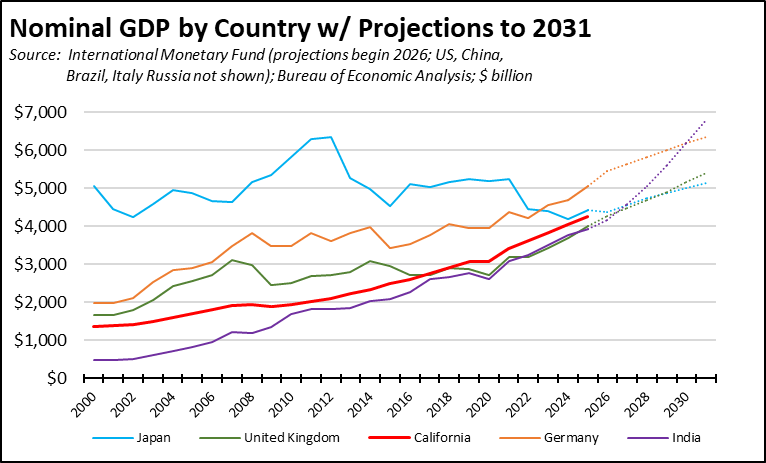
Combined with the updated IMF country GDP reports, California was revised from 4th largest economy in 2024 to the 5th largest. The 2025 data also results in California remaining in 5th place. Note that IMF reports 2025 results for most countries, but fiscal year 2024/25 for India putting its total somewhat lower than what a full calendar year would show.
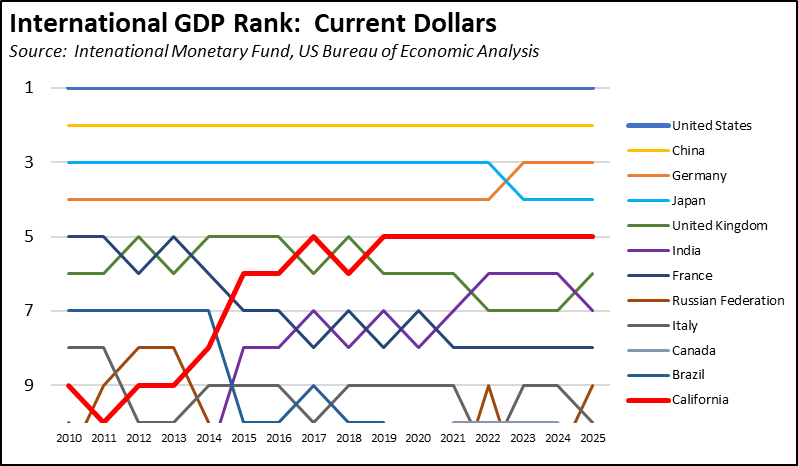
At this point, however, the differences are small and are affected by revisions in the country reports along with shifts in the value of the dollar and the fiscal year report base for India. Looking at the IMF projections and considering the current global economic volatility, California is likely to remain ahead of Great Britain in the next few years, but India’s growth is rapidly moving that country up in the rankings. California’s position relative to Japan likely will be dependent on conversion values, but the state is no position to overtake Germany as speculated in a previous Bloomberg editorial. The Bloomberg editorial remains just that—speculation with plenty of superlatives but little real analysis.
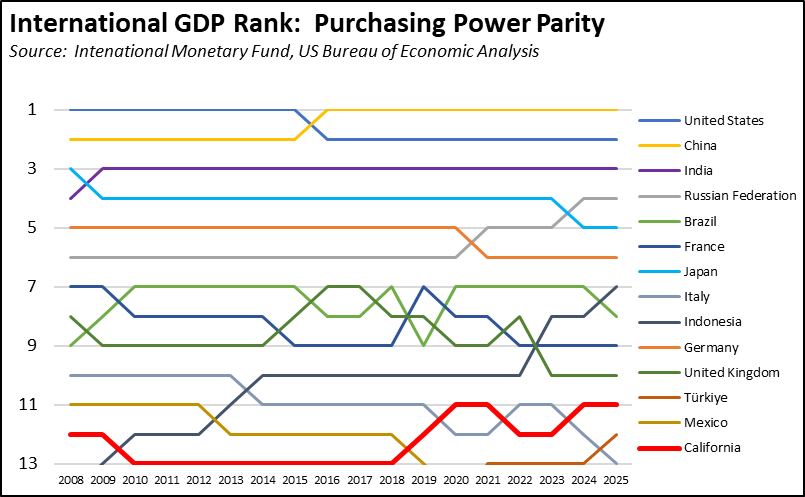
But as we have discussed in past postings on the issue, California dissipates much of its GDP value through high and growing costs. In real terms, a dollar of GDP in California buys less than a dollar of GDP in Texas or Indiana, and in this context a dollar of GDP in France or Indonesia. The IMF tracks cost-adjusted GDP through their Purchasing Power Parity GDP. A comparable value is constructed for California using the US Bureau of Economic Analysis Regional Price Parity series, using the most recent 2024 value for 2025 as well.
Looking at the real purchasing power of GDP as degraded by California’s high costs, California ranked as the 11th largest economy in both 2024 and 2025.
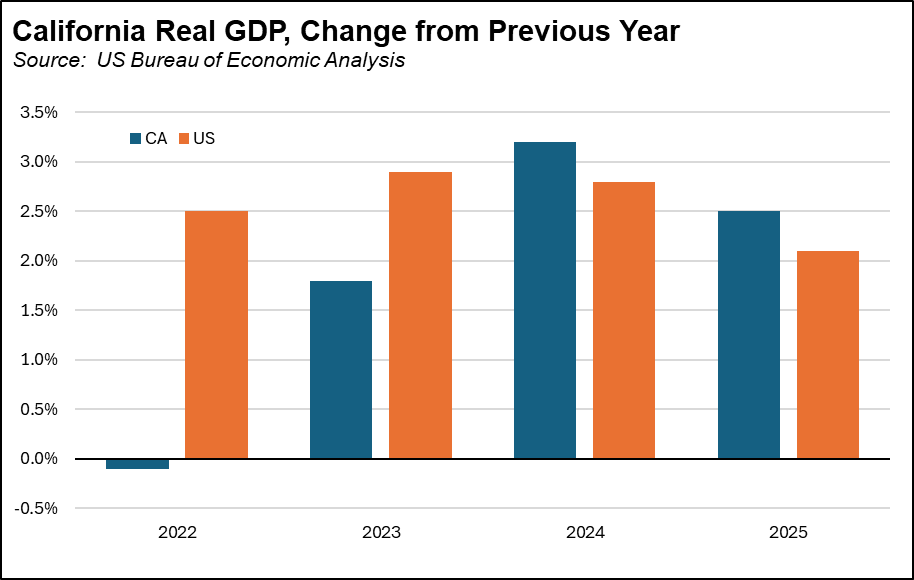
With these results, California’s Real GDP growth was somewhat better in 2024 and 2025 than the overall US average, while previously lagging behind in 2022 and 2023. Overall, between 2018 and 2025, California grew at an average annual rate of 2.5%, not that much different from the US average of 2.4%.
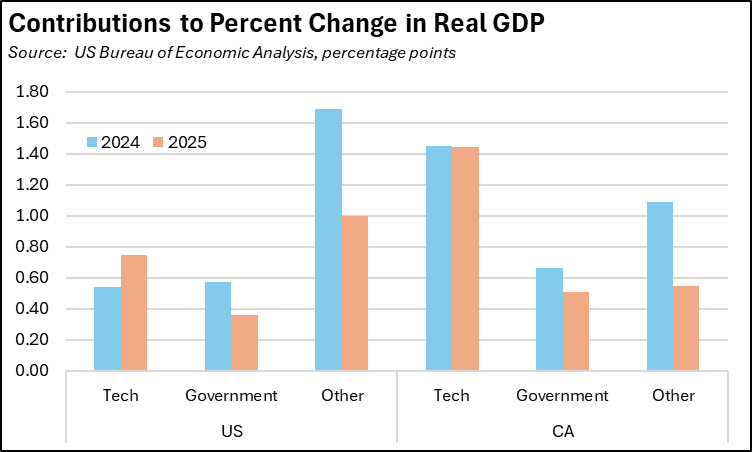
California’s Real GDP performance is heavily reliant on the tech industry. Broken out by contribution by industry (percentage points), the tech industry contributed 58% of California’s Real GDP growth in 2025 compared to only 36% in the US average. Government and government-supported Healthcare & Social Assistance was also somewhat higher at 20% compared to the US average of 17%. All other private industries in California grew by only 0.55% in 2025, compared to nearly double at 1.00% in the US average. While California’s continued status as the tech industry center boosts its GDP performance, the rest of the country experiences more balanced growth across a broader range of its economy.
Based on the current IMF estimates for 2025, California’s results would downgrade the state from 4th largest to 5th largest economy behind Japan but still 3% ahead of India. IMF will be updating their data this month with the actual 2025 figures, and we will provide an update at that time. Because the difference is small—as is the current situation for the 4th largest bragging rights—the final ranking will depend on both Japan’s 2025 data and exchange values.
Personal Income Meets Budget Projections
In the 4th Quarter, California’s Personal Income grew at an annualized rate of 2.9%, tied with Colorado, Maine, and Ohio as the 26th highest among the states and below the US average of 3.4%.
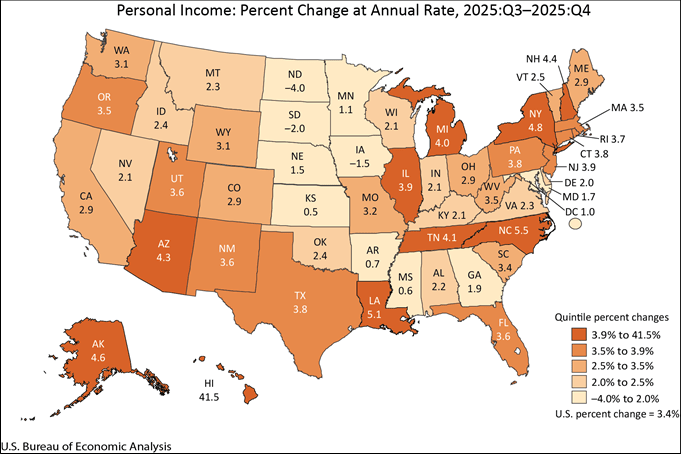
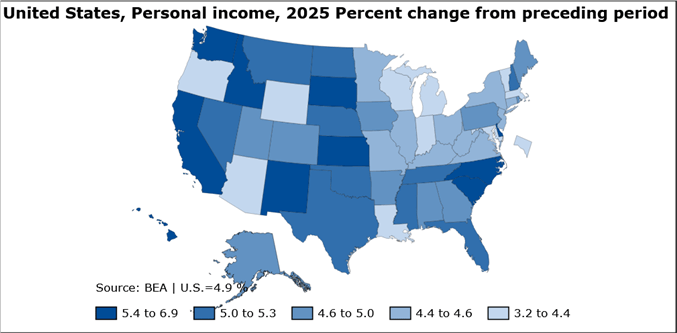
For the year, California Personal Income grew 5.5%, tied with Washington for the 8th highest but above the US average of 4.9%. The results show little difference with the Department of Finance projections that serve as the basis for the January revenue estimates. The Q4 number was only 0.2% higher, while the 2025 annual number was only 0.4% higher.
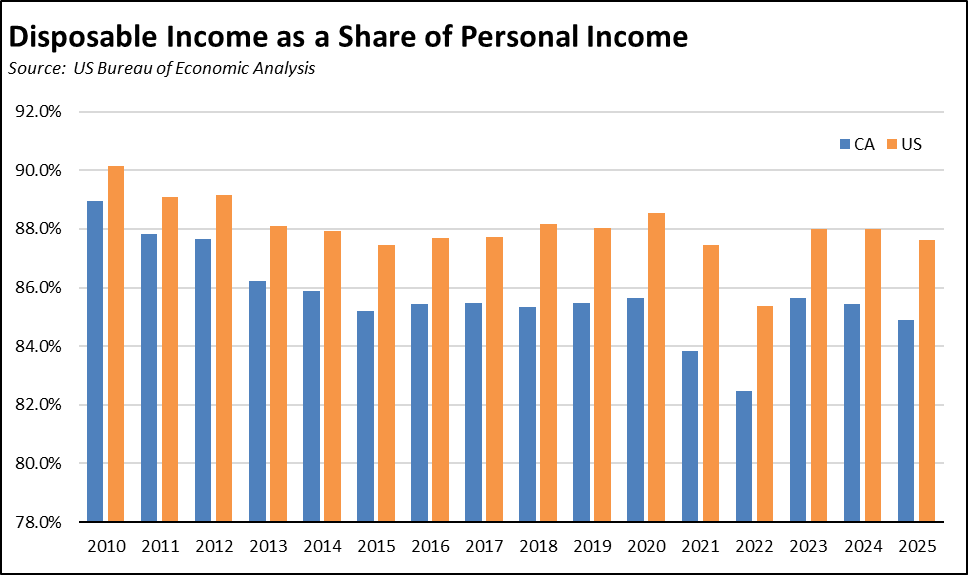
Overall, between 2018 and 2025, California Personal Income grew at an average annual rate of 5.8%, again not that much different from the US average of 5.9%. A key difference, however, is that California extracts more of personal income through taxes and away from consumption and investment. Disposable income (personal income less current personal taxes) required by households to cope with the state’s high costs is relatively lower, with the gap from the US average growing from 1.2 percentage points in 2010 to 2.7 points in the most recent data.
All of this most recent data is subject to revision in the next release later this year.
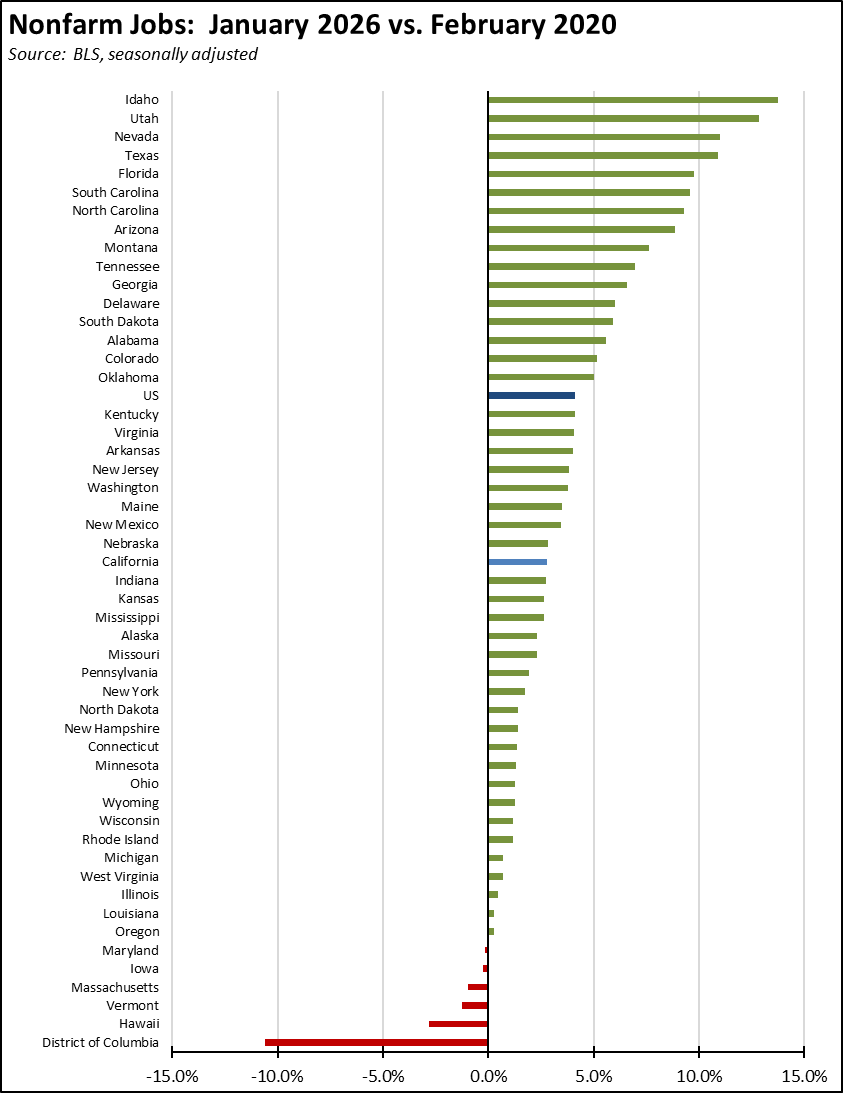
Nonfarm Jobs: January Up 93,500; Annual Revisions Show Little Change
The preliminary estimate for January reports that nonfarm jobs grew by 93,500 over the month. This high estimate is the product of the seasonal adjustment process. In the unadjusted series that reports on actual job estimates in each month, nonfarm jobs contracted by 208,900.
The January seasonally adjusted estimate, however, affected some of the previous rankings. California led the states, well ahead of second place Texas with a gain of 40,100 for the month. Over the year, California jobs grew by 131,200 compared to Texas at 112,200.
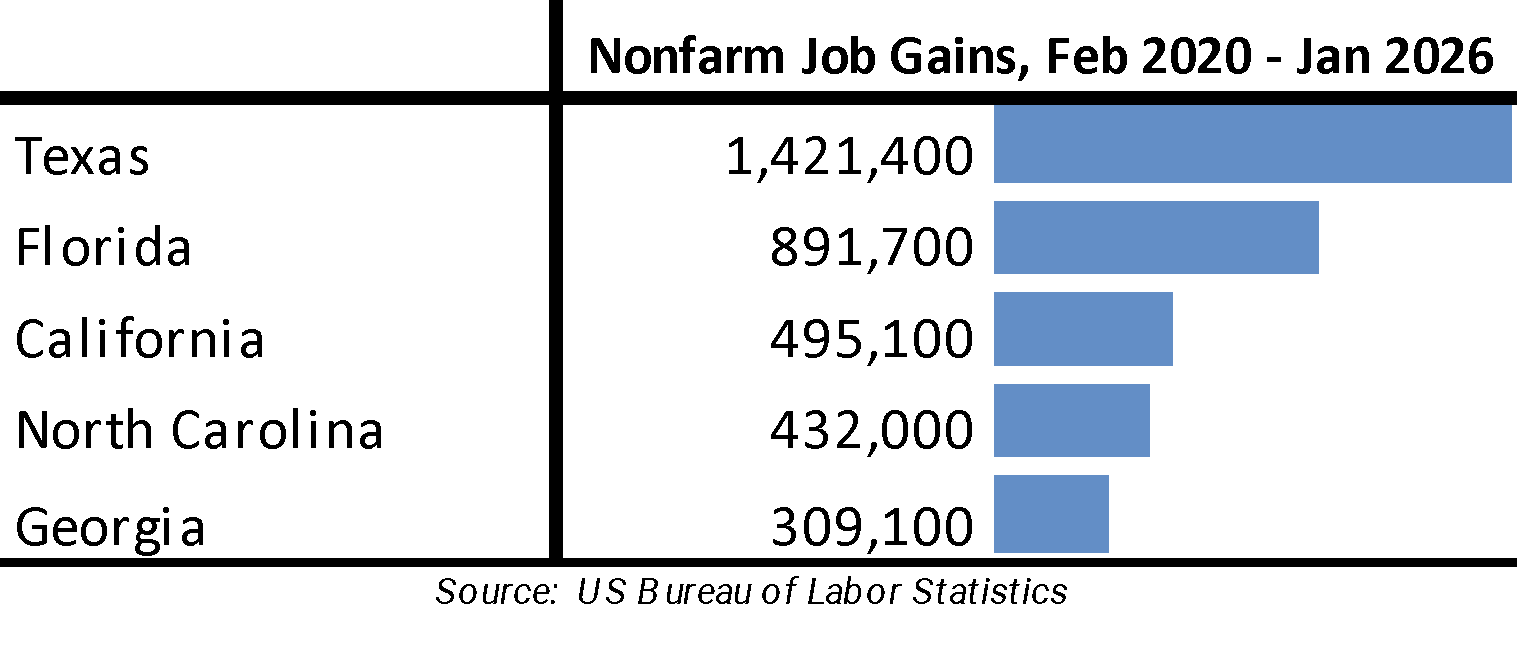
The January results also affected the state’s performance compared to the pre-pandemic peaks. Measured by net job creation, California returned to third place ahead of North Carolina, but in total has seen net job expansion at just under a third of Texas.
Adjusted for size, California’s ranking showed strong improvement to 25th highest among the states, while 5 states and DC now do not show recovery from the pandemic job effects.
As discussed in our preliminary jobs report, the annual data revisions unlike recent years were generally more positive but also produced significantly smaller adjustments. As shown below in our revision tracking chart, the revisions were somewhat improved in 2025 but only by a marginal amount, with the final total at the end of the year revised up by only 41,300 from the preliminary estimate.
As a result, the broader jobs picture still largely shows the California economy stagnating over the prior two years. Under the revised numbers, nonfarm jobs grew by only 56,600 (0.3%) in 2025, and by 96,800 (0.5%) in 2024.
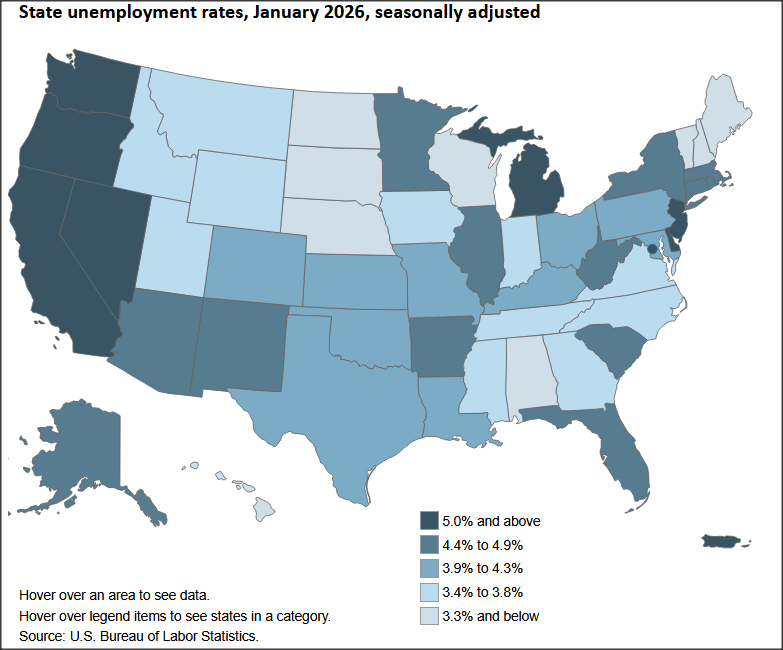
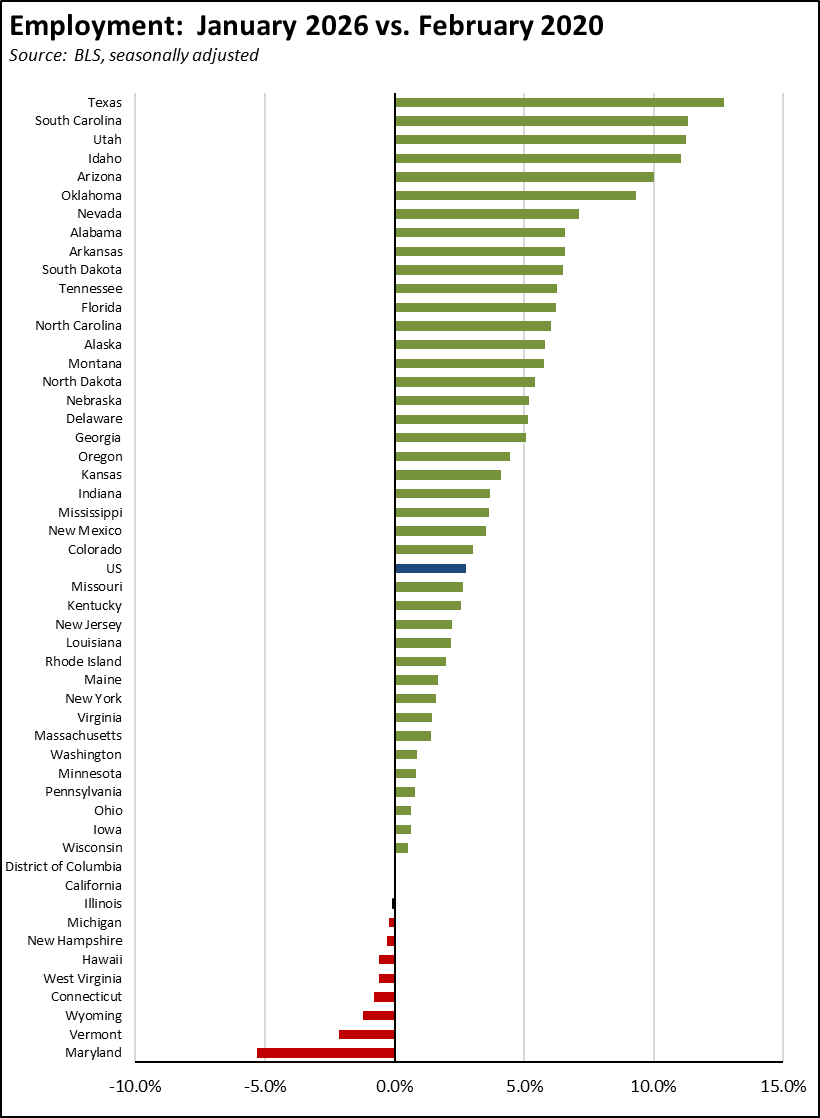
Labor Force: Ties with Delaware for Highest Unemployment Rate; Total Employment Barely Passes Recovery
Also as discussed in our preliminary report, the labor force revisions were small but showed marginally negative adjustments in the 2025 numbers. In the revised data, California tied with Delaware with the highest unemployment rate among the states (DC was somewhat higher), at 5.4% compared to the US average of 4.3%.
Because of the corresponding upward revisions in 2024, employment gains in 2025 were downgraded from 221,100 to 83,900, or only 7,000 a month. Compared to pre-pandemic February 2020, the new numbers show employment is barely in recovery, showing a nominal net gain of only 11,800. Combining these effects and adjusting for size, California now ranks 42nd among the states and DC in employment recovery from the pandemic job actions.
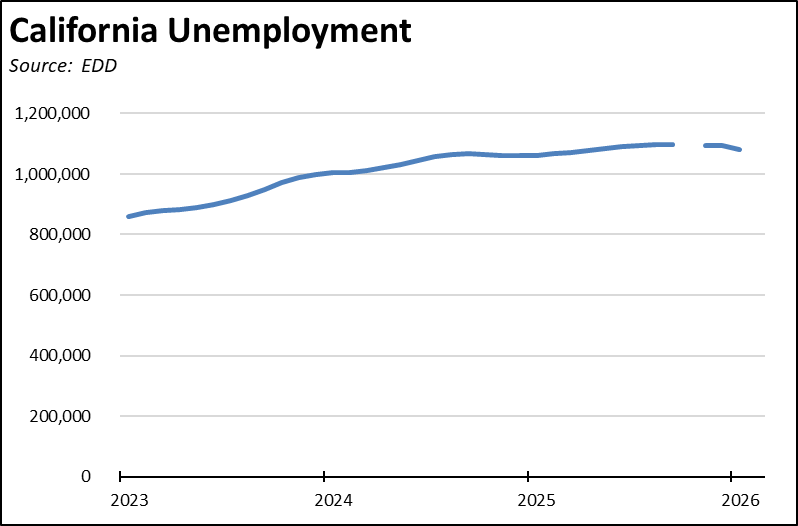
The revisions also saw little changes to the estimated number of unemployed. California unemployment has now been above the 1 million mark every month since January 2024. While containing 11.5% of the nation’s population, California has about 15% of the total unemployed.
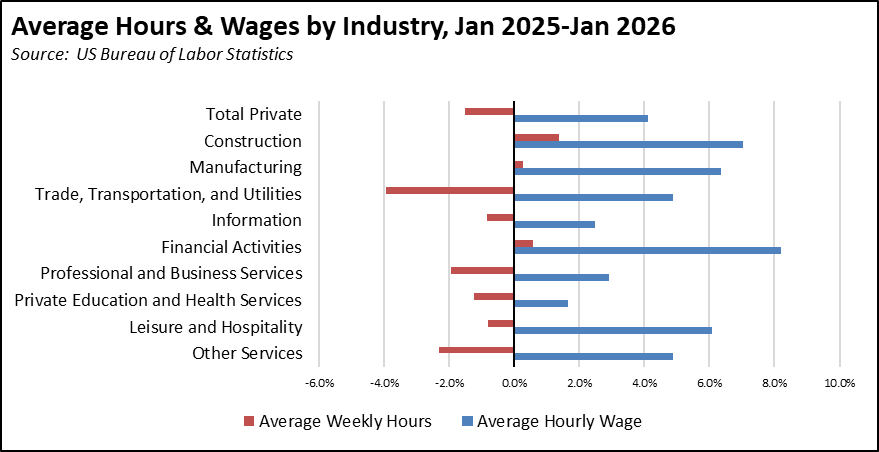
Wages Up; Hours Down
The private industry hours and wages data again followed the recent trend of rising hourly wages combined with offsetting reductions in weekly hours worked. Total private industry average hourly wage rose 4.5% over the year, evidencing improvement in real terms, while average weekly hours dipped 2.3%. This pattern generally was seen across all industries except Construction, Manufacturing, and Financial Activities which saw small upticks in hours.
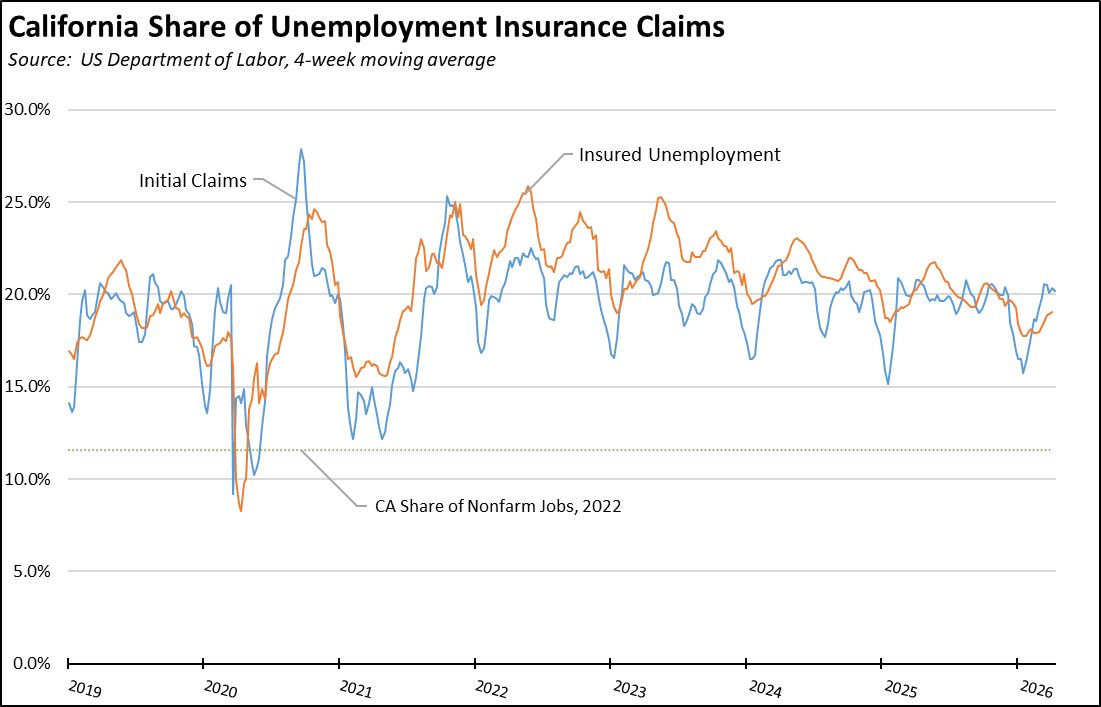
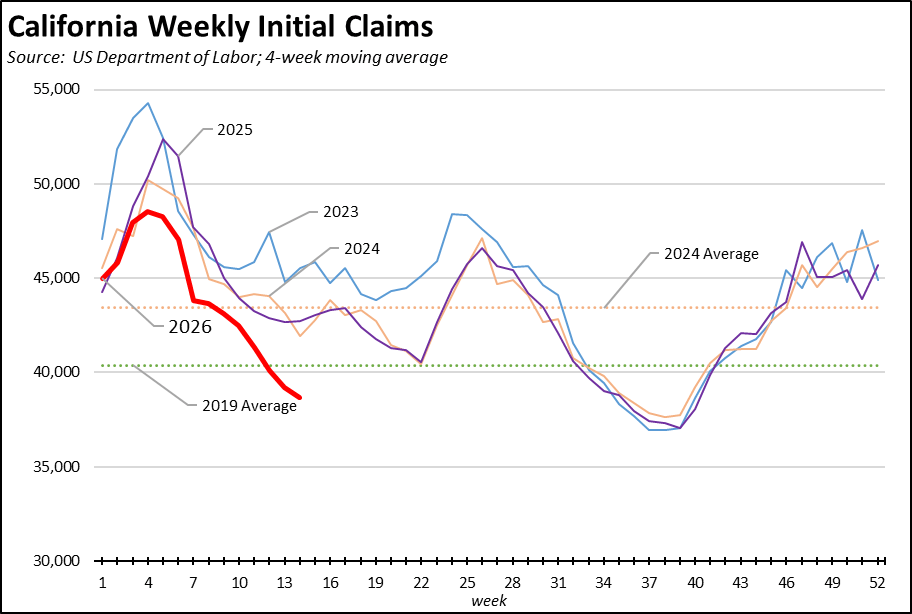
Unemployment Insurance Claims
Likely reflecting uncertainty in the labor supply, unemployment insurance initial claims have begun trending lower than recent years as has insured unemployment, a proxy for covered claims.
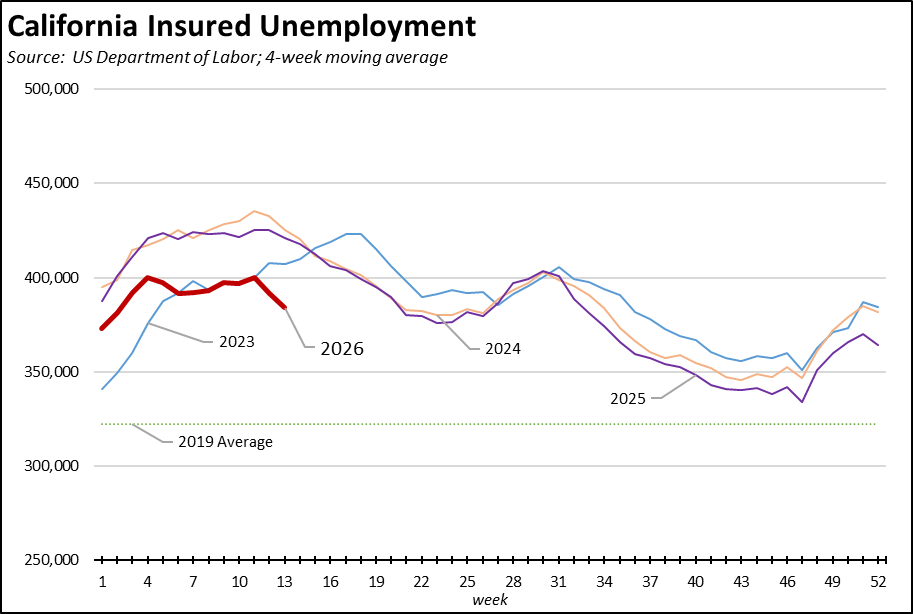
But even with these dips, California continues to have about a fifth of the total national caseload for this program. In spite of the indicated importance of this program to California workers, the state instead has chosen to keep it finances in functional bankruptcy even though California—along with every state that used them for this purpose—was given federal pandemic assistance to bring the program back into stability.