The Center for Jobs and the Economy has released our full analysis of the June Employment Report from the California Employment Development Department. For additional information and data about the California economy visit www.centerforjobs.org/ca
Highlights for policy makers:
- California Unemployment Rate Highest Among the States for 5th Month in a Row
- Nonfarm Jobs: Selected Industry Focus
- CaliFormer Businesses
- State UI Fund Sinks Further through Multi-year Deficits
California Unemployment Rate Highest Among the States for 5th Month in a Row
As discussed in our preliminary report, nonfarm jobs posted more positive results over the past two months, with June’s preliminary number coming in near the pre-pandemic monthly average from 2019. The labor force numbers in contrast, although showing the best results since last December, still reflected a continuing weakness in the state economy. Tying with Nevada, California at 5.2% had the highest unemployment rate among the states for the 5th month in a run. Total unemployment just barely missed the 1 million mark by only 100 workers. Total employment although up in June was down 93,000 for the year and remained 386,000 short of recovery to the pre-pandemic peak.
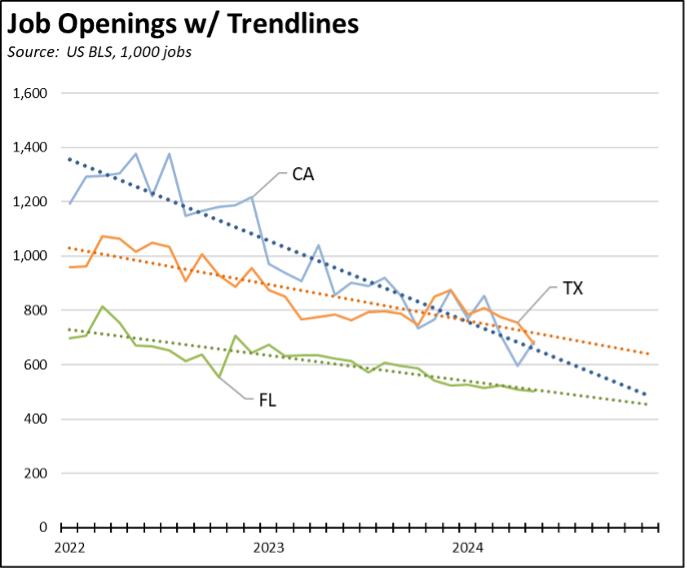
This weakness is also reflected in the overall trend for unfilled job openings in the JOLTS (Job Openings & Labor Turnover Survey) data for the state. Although the recent results for May show improvement from the prior month, the current trend shows a steady deterioration as California employers have cut back on their hiring plans. Even at its improved level, the results for May were 10% below the pre-pandemic average in 2019. In contrast, Texas has been showing job openings near or above California since last fall. At the current trends, even Florida would surpass the state by the beginning of next year.
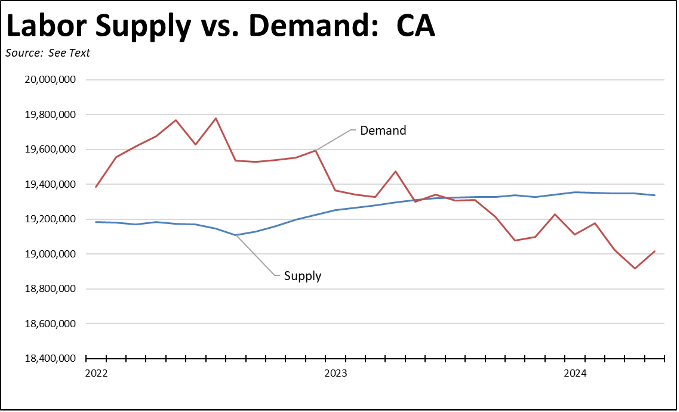
While a portion reflects typical friction in jobs due to labor turnover, the job openings data also provides insights into future jobs growth potential, especially at the historically elevated levels experienced in the post-pandemic period. Combined with the labor force data, this indicator can also provide a rough measurement of overall labor supply (number of employed plus number of unemployed) vs. labor demand (number of employed plus number of job openings) in the state economy. As indicated in the chart and putting aside any mismatch in the types of skills required for the available jobs compared to those present in the workforce, the recent upsurge in unemployment is consistent with the shift in the state from labor shortages to labor surpluses. The result is seen not only in the unemployment rate but a weakening of the potential for sustaining the wage growth experienced in recent years.
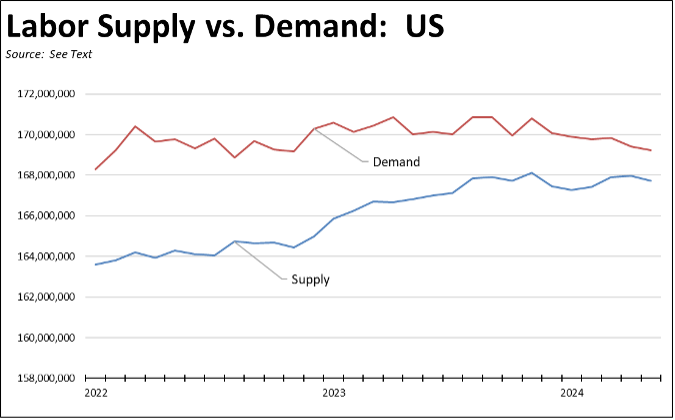
The national economy in contrast although easing still indicates labor shortage conditions, suggesting not only jobs but also wage increases remain more available in other states. Total demand, however, has begun to ease in the past few months while supply has remained more level.
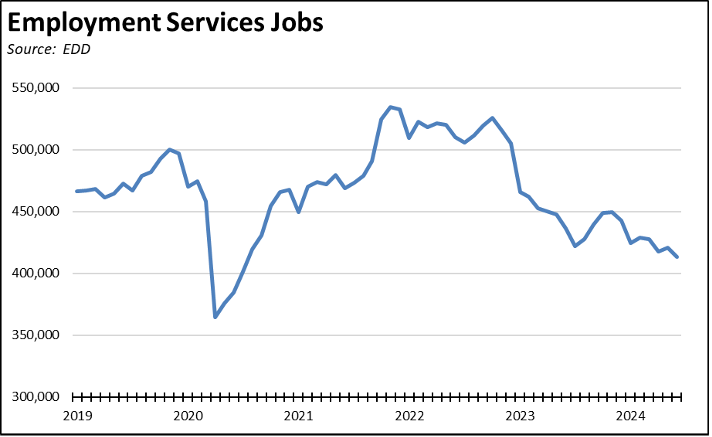
In yet another sign of softening in the labor numbers, businesses are also pulling back on temporary workers in the state just as they are on the national level. EDD does not include the Temporary Help Services industry in its monthly estimates, but instead includes these jobs in the slightly broader Employment Services. Temporary Help Services, however, is the substantial component of this broader industry, accounting for about 90% of the change in the job levels.
Often used as an adjusting tool during periods of rising or falling demand, jobs in this industry are down by nearly a fifth compared to their levels during 2019, and down by nearly a quarter from their peak last year.
Nonfarm Jobs: Selected Industry Focus
Even with the combined gain of 65,800 jobs over the past two months, California still ranks 4th among the states in terms of net jobs created since the pre-pandemic peak. But as we have discussed in previous reports and as noted by the LAO, the survey used for the monthly job numbers appears to be overestimating the California numbers in particular. Downward adjustments comparable to those made earlier this year in the annual data revisions are likely to be made for this year’s preliminary results as well.

Putting this caveat to one side, job growth in the state also continues to rely to an extreme degree on state and federal spending rather than innate dynamism in the state economy as in the past. Using the not seasonally adjusted series to provide more detail on jobs growth over the year, government and industries heavily reliant on government spending provided 88% of total nonfarm jobs growth in this period. High Tech and other private industries subject to the state’s high tax and regulatory burdens combined produced only an average of 2,300 jobs a month. The state’s jobs trend consequently will continue to come under challenge as the private sector base generating the required public revenues remains in neutral.

The job dampening effects of the state’s regulatory burdens are exemplified in the current collapse of jobs growth within the restaurant industry. A recent tweet from the administration appears to claim that the recent rise in fast food worker minimum wage to $20 an hour is having no effect on these jobs. The tweet refers to an article in the Orange County Register assessing monthly employment numbers for Limited-Service Restaurants, the industry including the fast food chains directly subject to the new wage. The numbers, however, only apply to the 4-county Southern California region and include no context for evaluating them.
Taking a broader look at the data, hiring in this industry—both Southern California and the state—slowed markedly in the months leading up to the effective data for the new wage and basically collapsed after that. This outcome is especially evident when compared to the industry jobs trend in the rest of the country. Jobs growth in the first half of 2023 closely matched or grew faster than the rest of the country. Jobs growth in the first half of 2024 instead has fallen dramatically behind, with industry jobs for the state down 1,100 (-0.1%) in June. Note that the US industry data for June is not yet available.
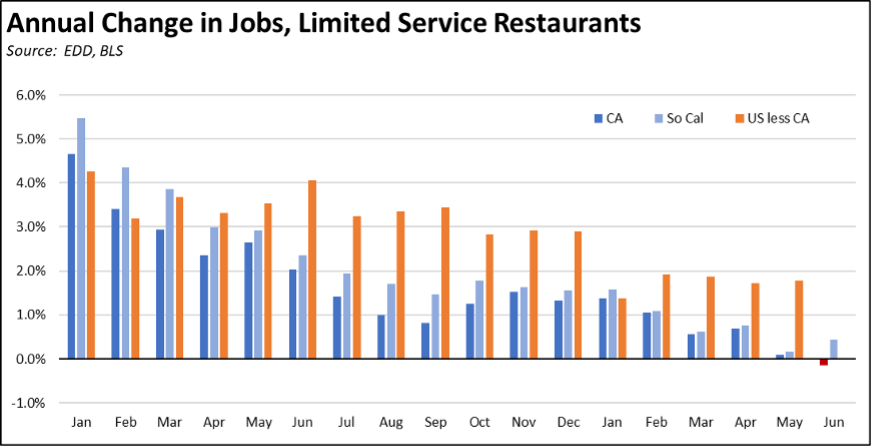
While the minimum wage hike applies only to fast food chains, as usual the state rules have a much broader dampening effect. The labor supply is not segmented. Smaller companies compete with the larger chains for the same workers and now face comparable wage pressures. This effect also extends to the broader restaurant industry, particularly at a time that many previous full-service establishments are shifting more to limited-service offerings in response to the general minimum wage increases along with other cost pressures such as utilities.
As a result, the jobs effect shown above for limited-service companies is being amplified in the comparable results for the broader restaurant industry. Restaurant jobs growth in the state has been near or below zero for the past 5 months while continuing to grow in the rest of the US.
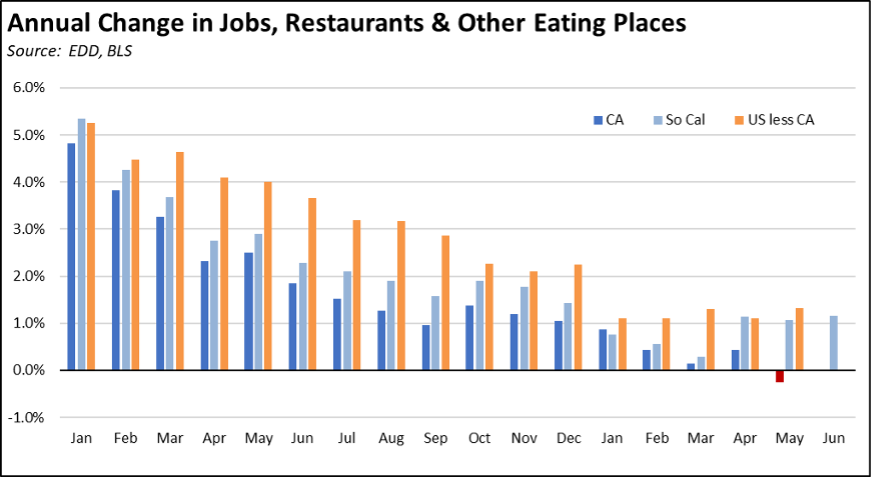
Because the jobs data for these industries is only available in the not seasonally adjusted series, the comparisons in the charts are based on calculating the change over a year (e.g., June 2024 vs. June 2023). This approach correctly accounts for the seasonal factors affecting these jobs.
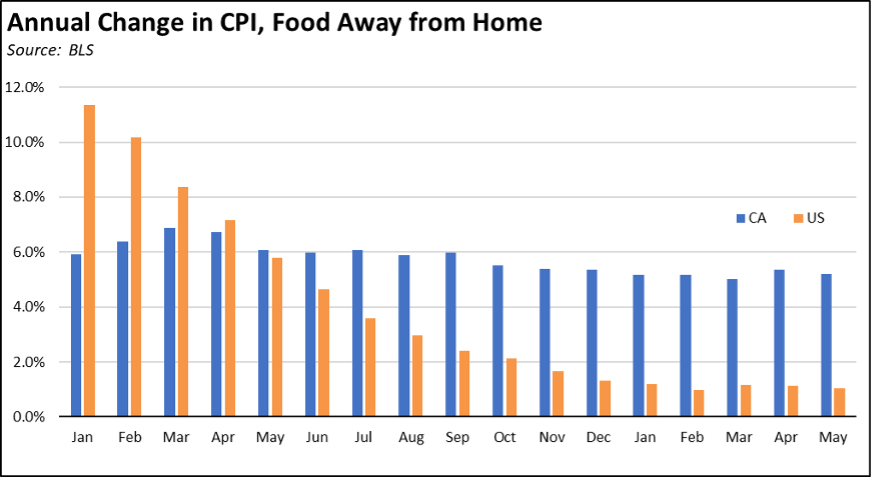
And while restaurant jobs have stalled and declined, the associated costs are being passed on to consumers. Applying the same formula Department of Finance uses to calculate the California CPI, inflation related to the Food Away from Home component (restaurants and take out) has largely abated in the country as whole. In contrast, restaurant prices are rising more than 5 times faster in California.
CaliFormer Businesses
Disney’s announcement in 2023 that it was canceling a planned $1 billion investment and 2,000 workers in Florida set off a brief moment of schadenfreude among the state’s leaders. At the time, however, we noted that the cancelation was in line with the broader shifts being taken by the company, and that substantial other investments outside California were still on the table. Those plans were confirmed recently under a deal to invest $17 billion creating 13,000 jobs in Florida.
Additional CaliFormer companies identified since our last report are shown below. The listed companies include those that have announced: (1) moving their headquarters or full operations out of state, (2) moving business units out of state (generally back office operations where the employees do not have to be in a more costly California location to do their jobs), (3) California companies that expanded out of state rather than locate those facilities here, and (4) companies turning to permanent telework options, leaving it to their employees to decide where to work and live. The list is not exhaustive but is drawn from a monthly search of sources in key cities.
State UI Fund Sinks Further through Multi-year Deficits
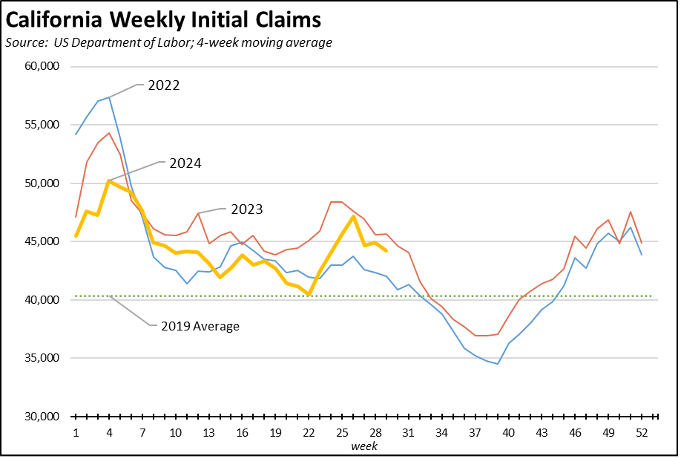
Measured on a 4-week moving average basis, the number of initial claims has experienced a sharp rise in the last seven weeks but still remains just below the 2023 levels for the same period.
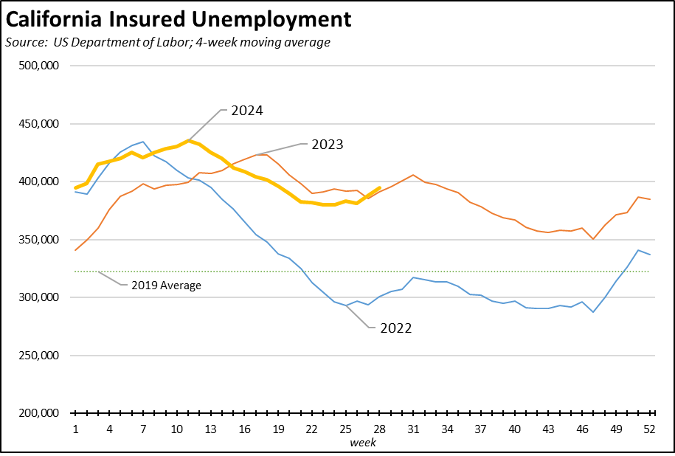
The number of workers receiving unemployment—as measured by insured unemployed (a proxy for continuing claims)—has just poked above the 2023 numbers during this period, remaining substantially elevated above the levels in 2022.
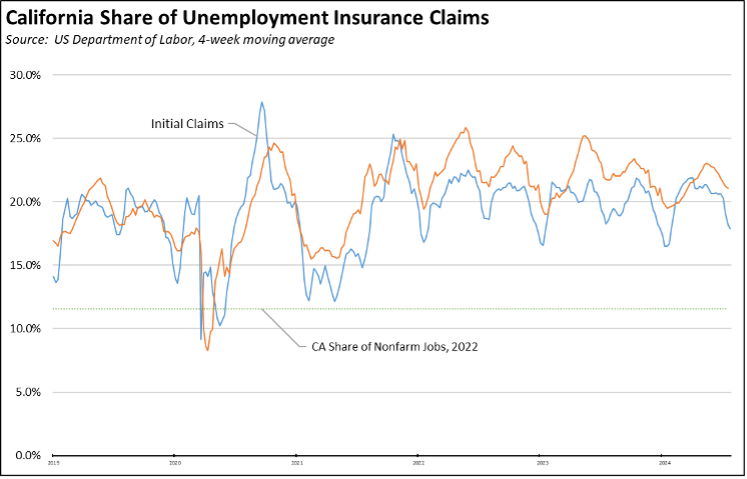
California’s reliance on this program as a substitute for earned wages also remains well above its total share of the national economy.
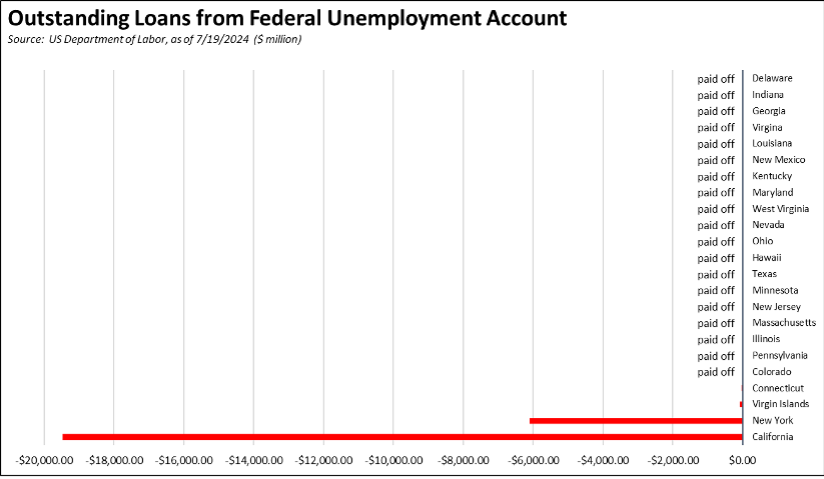
Yet in spite of the importance of this program made even more so by increasing unemployment in California, the state fund continues to sink further into functional bankruptcy. California continues to be one of only two states still carrying a UI Fund debt over from the Pandemic, substantially so in the state’s case. And as indicated in our report last month, the most recent forecast released by Employment Development Department expects the program to pay out 42% more ($2.018 billion) than what it will take in from the Employer Contributions in fiscal year 2024, and 30% more ($1.554 billion) than what it will take in in fiscal year 2025. These forecasts assume no new economic slowdown in this period.
