The Center for Jobs and the Economy has released our full analysis of the May Employment Report from the California Employment Development Department. For additional information and data about the California economy visit www.centerforjobs.org/ca.
Highlights for policy makers:
- State GDP Slips 0.2%
- State Personal Income Up 5.2%
- Revenue Watch
- Nonfarm Jobs Rise 17.7k in May—Third Highest Among the States
- Job Numbers Likely to be Revised 102.7k Lower
- Benefits Instead of Jobs
- Califormers: New PPIC Study on Company HQs Leaving the State
State GDP Slips 0.2%
California’s Real GDP eased at an annualized rate of -0.2% in the first quarter of 2025, according to data released by US Bureau of Economic Analysis. California’s rate was the 15th highest among the states but somewhat better than the revised national average of -0.5%. Leading states were South Carolina (1.7%), Florida (1.4%), and Alabama (1.0%).
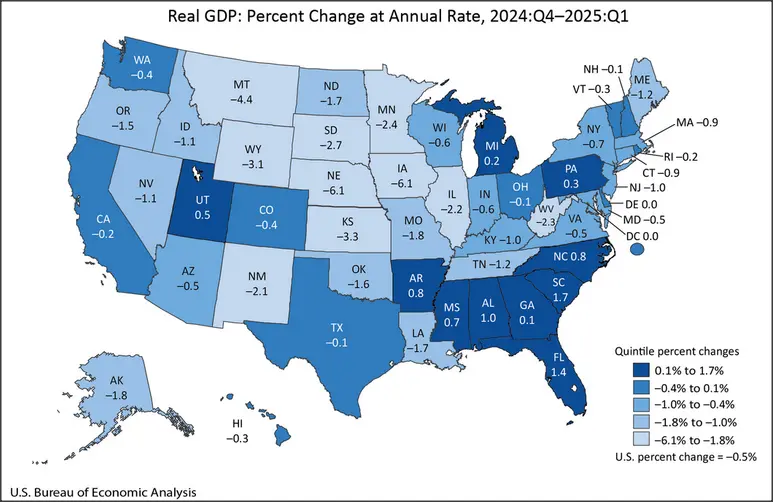
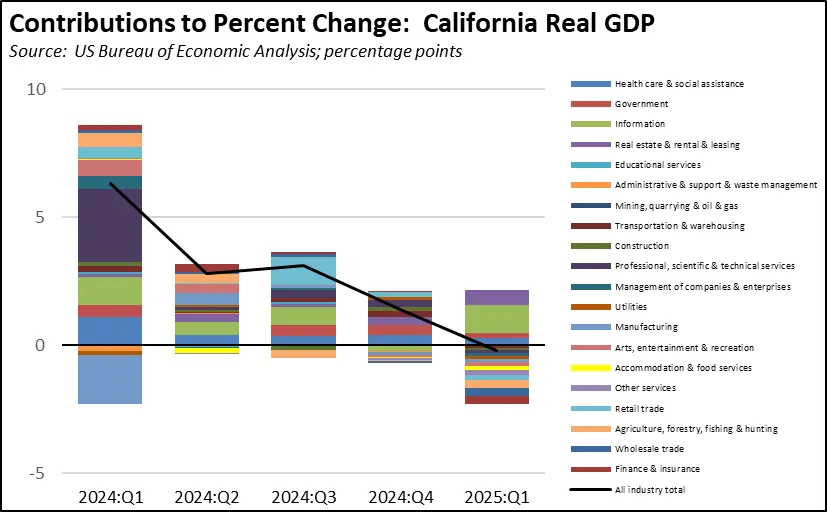
High-tech containing Information showed the strongest growth in the 1st quarter followed by Real Estate, Rental & Leasing. Most other industries other than Government and Healthcare & Social Assistance experienced a contraction compared to the 4th quarter of 2024.
State Personal Income Up 5.2%
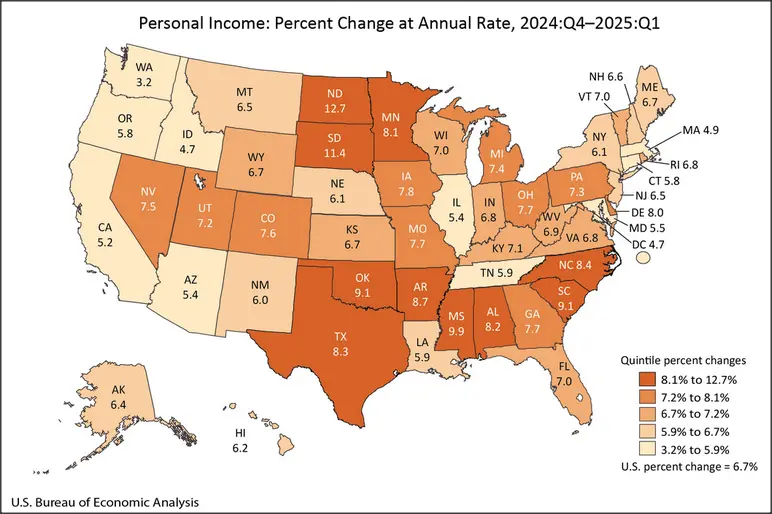
California’s Personal Income rose at an annualized rate of 5.2% in the first quarter of 2025, according to data released by US Bureau of Economic Analysis. California’s rate was the 47th highest among the states and below the national average of 6.7%. Leading states were North Dakota (12.7%), South Dakota (11.4%), and Mississippi (9.9%).
BEA also released revisions to the 2024 data, showing only minor changes to the California results. Personal Income was revised down by about $3 billion in the first half of 2024, but saw a $20.5 billion upgrade in the 4th quarter.
Government and government-supported Healthcare & Social Assistance contributed 37% of the increase in the net earnings portion of Personal Income, compared to only 25% in the national average.
Revenue Watch
The recently signed budget bill produced another deficit budget—the 4th in as many years—reliant on fund switches, budget borrowing, upgraded revenue forecasts, and the by-now traditional budget gimmicks. Rather than bring spending back in line with long-term revenue trends, the results instead appear aimed at maintaining the strong rise in expenditures of the past few years that were based on far rosier but ultimately variable revenue forecasts. Current general fund deficit projections now are pegged at $17-$24 billion over the following three fiscal years, while deficit spending in the special funds has also been rising but not included in the projections.
This level of spending combined with the growing backlog of budget borrowing that must be paid off at some point can only be sustained under: (1) the hope that revenues somehow return to the boom projections from recent years or (2) the state will consider substantial new taxes as will be evaluated by the Legislative Analysts’ Office in a study to be completed by November.
Looking at the first option, current revenue numbers are based on the economic projections prepared and updated by the Department of Finance as the budget proceeds. Upswings in revenue are only likely to the extent the state’s economic performance begins to improve on these expectations. Looking at selected indicators in the most current projections underlying the May Revise numbers, there are only minor deviations from the recent economic data. As indicated above, state Personal Income came in $29.3 billion (0.8%) above the Finance projections, while nonfarm jobs were 45,300 (-0.3%) lower. The labor force numbers essentially showed no difference. As discussed below, however, the job numbers are likely around 100,000 lower than currently estimated, expanding the likely difference from the projections to -0.8%.
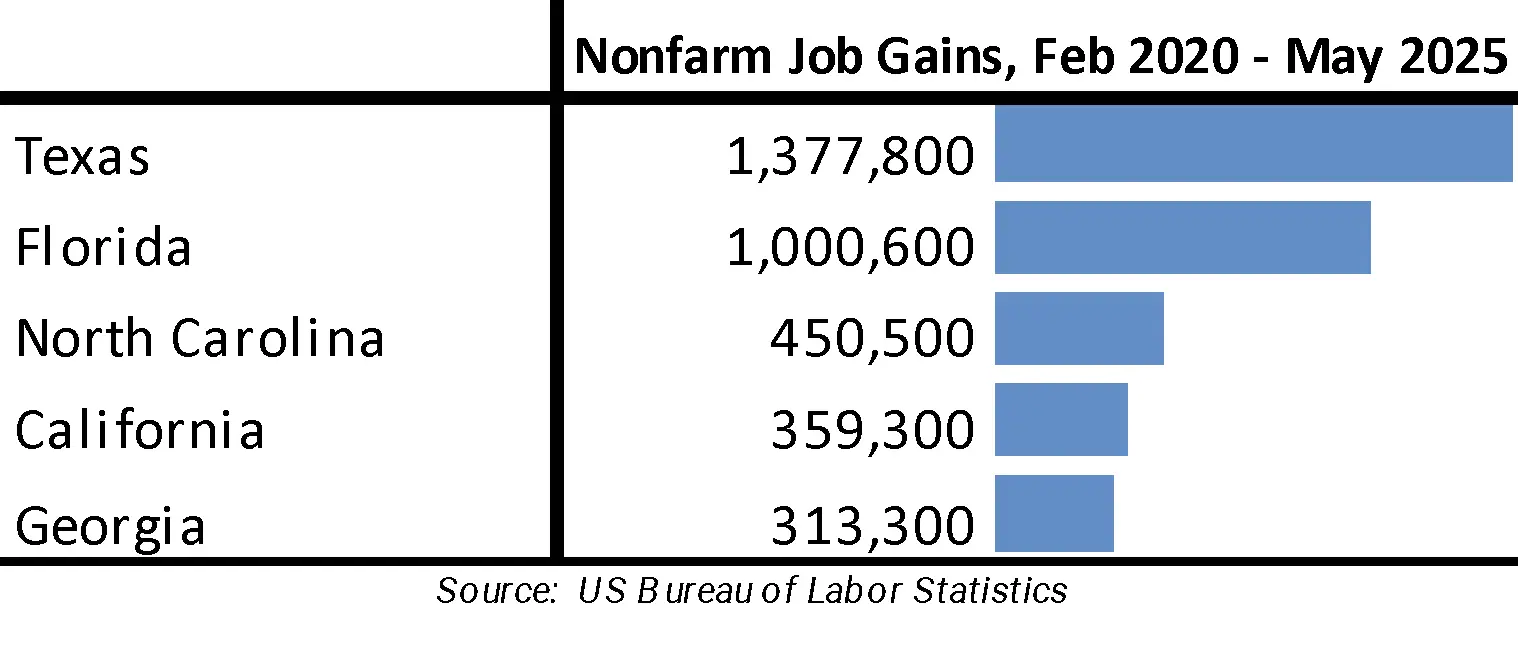
Nonfarm Jobs Rise 17.7k in May—Third Highest Among the States
As reported earlier, the preliminary nonfarm job numbers show a rise of 17,700 in May, the second time this year the monthly estimates show a gain rather than a loss. Cumulatively for the year to date, California now shows a loss of 9,200.
California’s gains were the 3rd highest among the states, which were led by Texas at 28,100 and Florida at 20,500.
Adjusted for size, California’s jobs performance since the pandemic ranks much lower. As the result of recent actions affecting the level of federal jobs, DC also continues to slip lower.
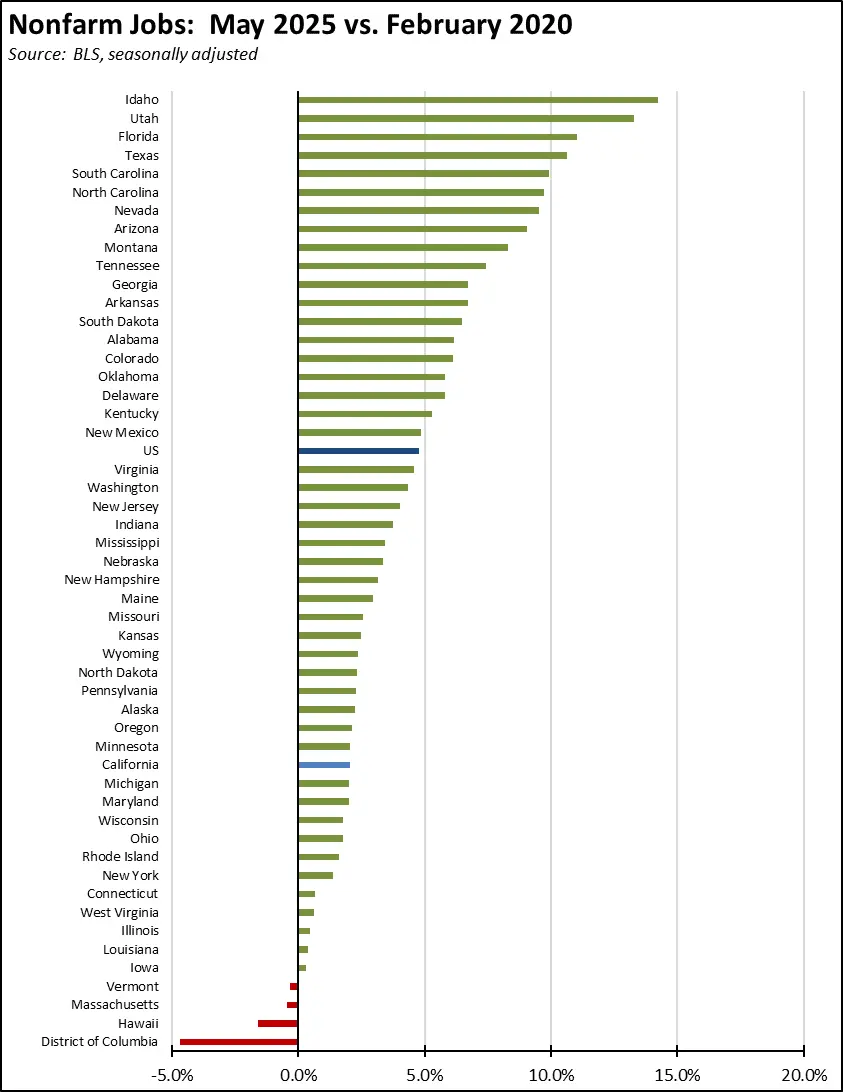
Compared to the pre-pandemic peak in early 2020, the gains over the past two months also have not been large enough to move California out of 4th place. California still trails North Carolina by a substantial margin, and remains only 46,000 ahead of much smaller Georgia.
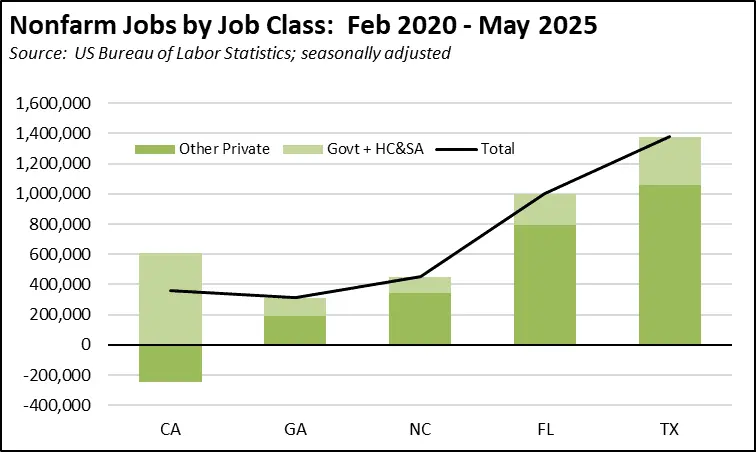
The base of the indicated jobs growth in each state also differs substantially. In the other 4 states, government and government-supported jobs in Healthcare & Social Assistance are a portion of their overall jobs growth along with other private sector jobs. In California, publicly-funded jobs expansion has replaced other private jobs growth. The state’s substantial projected budget deficits—which are little affected by the present budget agreement and that are expected to remain in the $17-$24 billion range in the upcoming years—threaten to undermine this sole source of jobs expansion in the state as does the state’s reliance on $174 billion in federal funding for this purpose.
Job Numbers Likely to be Revised 102.7k Lower
As we have discussed in the past, the monthly job numbers from the Current Employment Statistics (CES) are survey- and model-based estimates subject to revision based primarily on the actual wage and salary job counts in the Quarterly Census of Employment & Wages (QCEW). The national data has moved to quarterly revisions as the QCEW data is released. State data, however, continues to be revised only annually each March. California’s job numbers have seen substantial downward revisions in recent years.
Preliminary estimates for the states are available through the Early Benchmark Revisions from the Philadelphia Federal Reserve Bank, using the same methodology as for the quarterly national revisions. Based on the recent release of the 2024:Q4 QCEW data, these preliminary estimates indicate California’s nonfarm jobs were 102,700 lower in December than shown in the CES monthly estimates. As a result, nonfarm jobs likely were essentially unchanged in the 4th quarter. Instead of growing by 153,700 (0.9%) in 2024, nonfarm jobs likely edged up by only 51,000 (0.3%).

In the chart, the Early Benchmark revisions are shown in the solid red line covering the 4th quarter. These estimates also contain an Extended Forecast portion based on industry-specific change rates in the CES data, shown as the dotted red line.
Benefits Instead of Jobs
Rather than reform the barriers to more robust job creation across all industries and wage levels, California policies have instead given more priority to public benefits expansion—income redistribution rather than the income expansion pursued by other states. As a measure of the extent to which this policy choice has taken hold, the following chart uses Personal Current Transfer Receipts from the US Bureau of Economic Analysis (BEA) personal income data from the most recent year available.
![]()
Using the state’s population share of 11.6% as the comparison base:
- The share of retirement benefits paid to state residents is substantially lower due in no small part from the disadvantages of California as a retirement location, coming from high costs and high tax/fee rates even though California is one of the states that do not tax social security benefits.
- Income assistance provided through the tax codes is also significantly lower, reflecting the fact that EITC is predicated on earned income and California is lagging on expanding these earned income opportunities.
- The various public assistance and unemployment programs in contrast show a significantly higher incidence in the state, with residents far more reliant on these income sources due to the lag in the state’s job creation. In the chart, “other income maintenance” includes Temporary Assistance for Needy Families (TANF), general assistance, Special Supplemental Nutrition Program for Women, Infants, and Children (WIC), refugee assistance, foster home care and adoption assistance, Additional Child Tax Credits, and energy assistance. “Public assistance medical care benefits” includes Medicaid (Medi-Cal), Children’s Health Insurance Program, and general medical assistance. Including the Unemployment programs, California’s share ranges from 13.0% of Workers’ Compensation payments (11.6% higher than population share), to 14.4% of Public Assistance Medical Care (24.1% higher), to 19.6% of Unemployment Insurance payments (68.4% higher).
Maintaining these benefit levels is, of course, reliant on somehow sustaining the current deficit spending levels in the state budget. As the private sector, tax revenue source of the state’s economy continues to remain static or contract, those deficits will continue or get worse.
Much of this benefits approach is also dependent on federal funding, pegged at $174 billion in the current budget version. Using the May Revise numbers, 79% of those funds go to the Health & Human Services Agency as the provider of most of the listed benefits, while the state also relies on federal forbearance on its $22 billion and growing debt to sustain operations of its unemployment insurance program. Overall, just half of the HHS budget comes from the federal funds.
Califormers: New PPIC Study on Company HQs Leaving the State
Using a new data source, PPIC recently released a comprehensive analysis of company headquarters leaving the state between 2011 and 2021. While the study concludes the total number leaving is relatively “small,” it also notes that this number increased over the period they considered. As summarized in the report:
- The number of firms whose headquarters have left the state is small. From 2011 to 2021, 1.9 percent (789) of the state’s more than 47,000 headquarters left California on net. The decrease in jobs resulting from these relocations represented 3.7 percent (about 77,600) of all headquarter jobs. Roughly half of the headquarters that left California were in manufacturing, wholesale trade, or business services.
- The annual number of relocations has trended upwards. About 150 headquarters left California in 2011, compared to over 200 in 2021. Over this time period, headquarter relocations from other states to California declined from almost 140 to just under 70. Headquarters that leave California tend to go to other large states like Texas, New York, and Florida, or to nearby states like Nevada and Arizona.
- Headquarters that move out of state keep other branches and jobs in California. Further, companies that move headquarters to other states do not appear to shrink non-headquarter employment in the state relative to firms whose headquarters stay in California. Job loss due to relocation appears mostly limited to headquarter jobs.
- California headquarters that relocate tend to go to states with lower taxes and less regulation. The same pattern is evident among headquarters relocating nationally. Over the period studied, California did not reduce tax and regulatory burden as much as other states—a potential reason behind the uptick in headquarters leaving the state.
- Relocations are a small fraction of overall headquarter activity. Between 2011 and 2021, far more headquarters launched (7,250, 17% of companies headquartered in California) and closed (12,700, 30%) than moved out of state, with no clear upward or downward trends.
The study focuses on headquarters moves, an important but not the only component of the overall dynamics affecting business migration. As indicated in our—albeit less comprehensive—Califormers tracking, most business moves do not entail moving a whole company or even its headquarters. Instead, over time businesses make relocation decisions that affect individual business units and expansion/upgrade investments, and these decisions are heavily affected by the economic factors stemming from the differing regulatory and tax costs. In the military base retention world, this type of incremental migration is referred to as “mission creep,” and the end result is that once a decision point on which bases to keep is finally reached, the decision essentially has been made as operating units have moved to new centers around the country. The same dynamic is present for companies as well. Especially for medium to larger size companies, the decision to leave California often comes after much of the company has already relocated through moves and new investments to another state.
Additional CaliFormer companies identified since our last report are shown below. The listed companies include those that have announced: (1) moving their headquarters or full operations out of state, (2) moving business units out of state (generally back office operations where the employees do not have to be in a more costly California location to do their jobs), (3) California companies that expanding out of state rather than locate those facilities here, and (4) companies turning to permanent telework options, leaving it to their employees to decide where to work and live. The list is not exhaustive but is drawn from a monthly search of sources in key cities.