Highlights for policy makers:
- Nonfarm Jobs Rose 3,100 in May; 21st Highest Among the States
- Unemployment Above 1 Million Since 2024; Black Unemployment at 10%
- AI and Jobs
- Califormers: 2026 Fortune 500
- Califormers: CBRE Headquarters Relocation Report
- Califormers Update
Nonfarm Jobs Rose 3,100 in May; 21st Highest Among the States
In May, California posted a preliminary gain of 3,100 nonfarm jobs (seasonally adjusted), the 21st highest result among the states and DC, which were led by Texas (17,800), North Carolina (17,400), and New York (13,700).
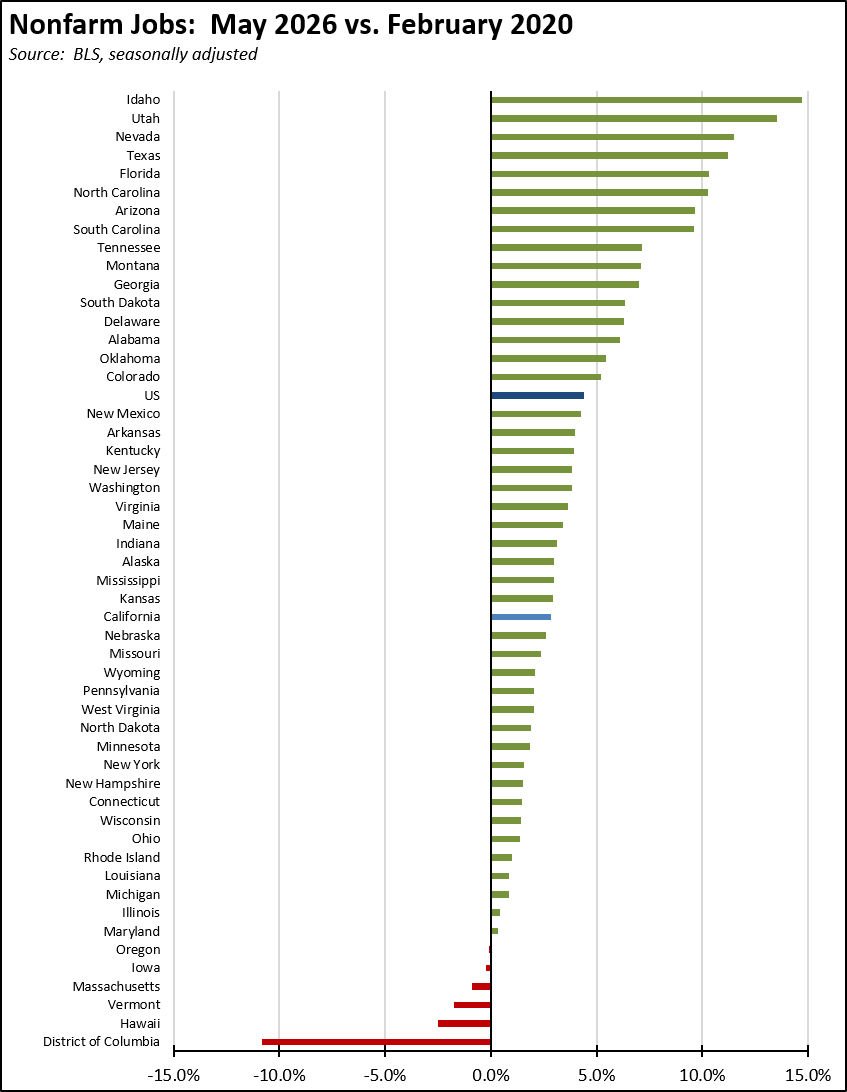
Comparing net job gains from the pre-pandemic peak, California still remained in 3rd place, but by only 27,700 ahead of much smaller North Carolina.
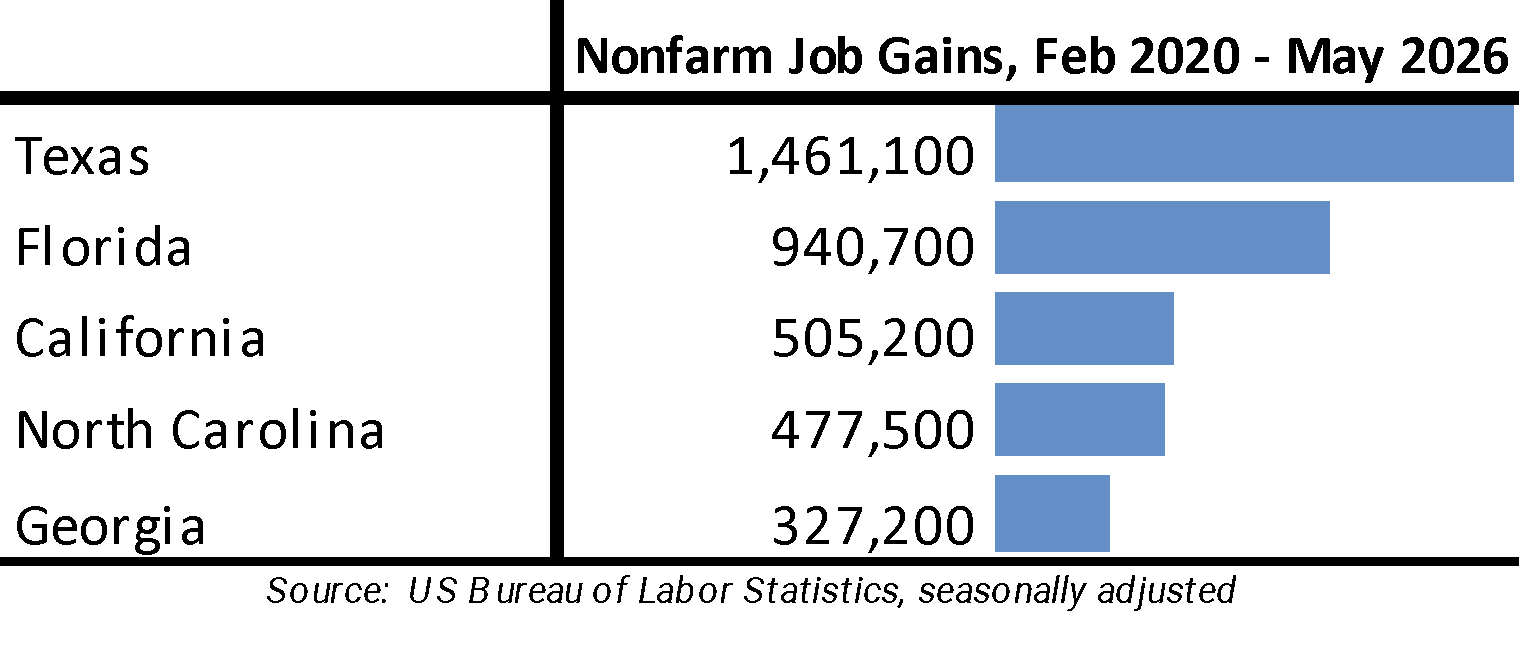
Adjusted for size, California’s job performance continues to rank in the middle, at 28th highest among the states and DC. Five states and DC have yet to recover to their pre-pandemic levels.
Unemployment Above 1 Million Since 2024; Black Unemployment at 10%
In the preliminary May numbers, California had the highest unemployment rate among the states at 5.3% (seasonally adjusted). DC again was higher at 6.1%. The US rate was 4.3%.
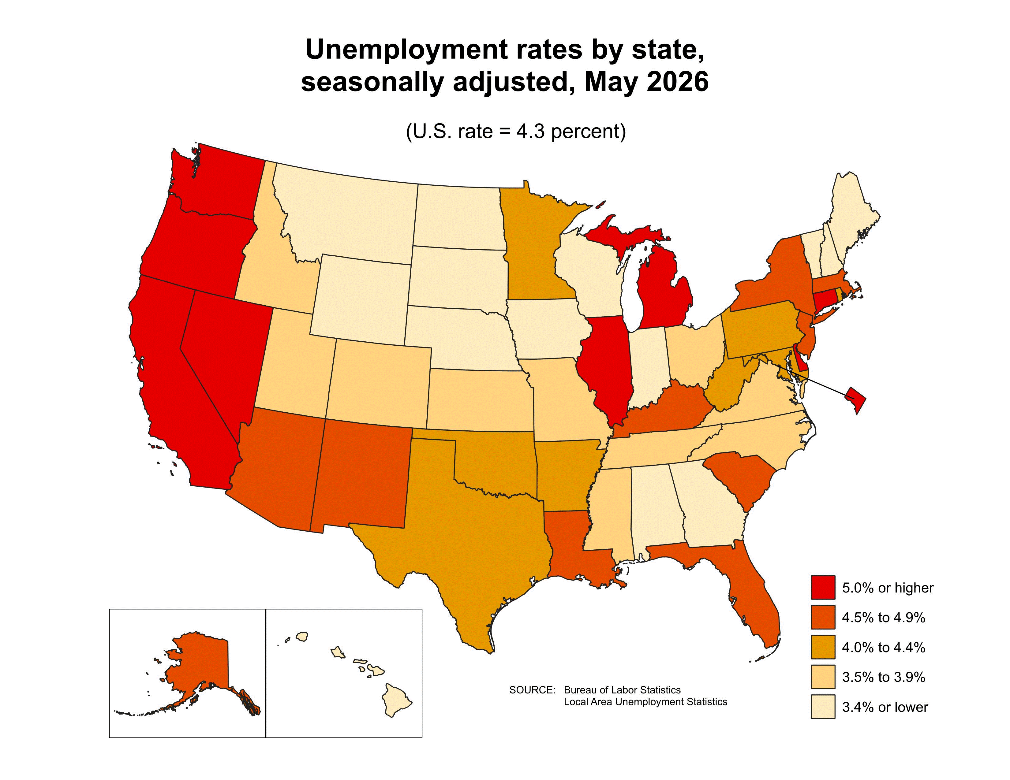
The preliminary number of unemployed at 1.08 million remained above the 1 million mark for the 29th month in a row. While the number of unemployed improved marginally, it did so as workers left the labor force rather than becoming employed.
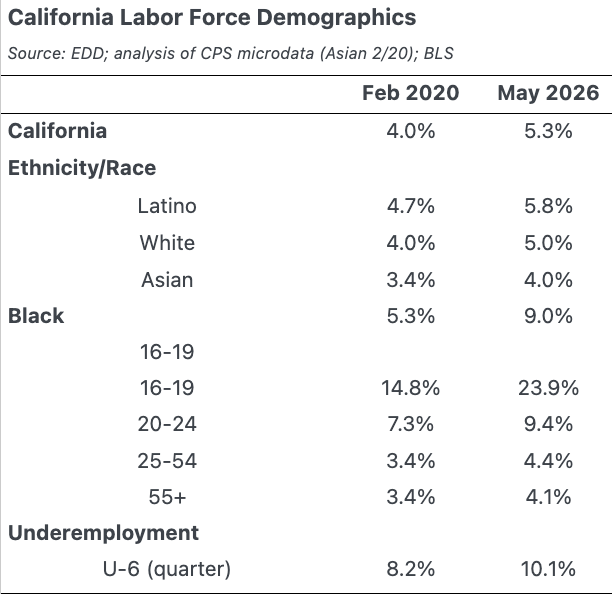
By ethnicity/race, Latino and White workers have seen comparable increases in unemployment compared to pre-pandemic February 2020. Asians have seen a smaller change. Black workers in contrast have seen their unemployment rate increase by two-thirds to 9.0%.
By age, prime working age (25-54) and seniors (55+) also have seen generally comparable increases. Youth (16-19) and Young Adults on the other hand have seen more substantial increases as the state and local minimum wages have increased, including in the fast food industry that previously employed many of these workers. The Youth unemployment rate in particular has soared by nearly two-thirds, eliminating the early employment and early acquisition of workplace skills that are associated with higher lifetime earnings, especially for workers in the lower educational attainment categories.
Underemployment, measured by U-6, similarly has shown a significant increase. U-6 covers the labor force universe covered in the monthly reported rate, but also includes workers in part time jobs because full time jobs are not available as well as workers who are only marginally attached to the labor force.
Note that the data in the table derives from a different accounting than the model-based monthly estimates, but relies on the same core Current Population Survey (CPS) data. To provide statistically valid estimates, the table data generally shows the 12 month average from the CPS and for U-6. As a comparison, the average California rate as shown is 5.3% from this method, while the average of the not seasonally adjusted model-based estimates for the same period is 5.5%. In addition, for periods including October 2025, the data is based on a moving 11-month average rather than 12-month as in prior years, because the required survey was not done.
AI and Jobs
As part of their Business Trends & Outlook Survey, the Census Bureau has been tracking the use of AI by businesses. The survey covers about 1.2 million businesses broken into 6 panels, including all but a few identified business sectors.
In the most recent (June 14) survey, about a fifth (22.2%) of California businesses reported using AI in any business function in the previous two weeks. This penetration level was only the 18th highest among the states.
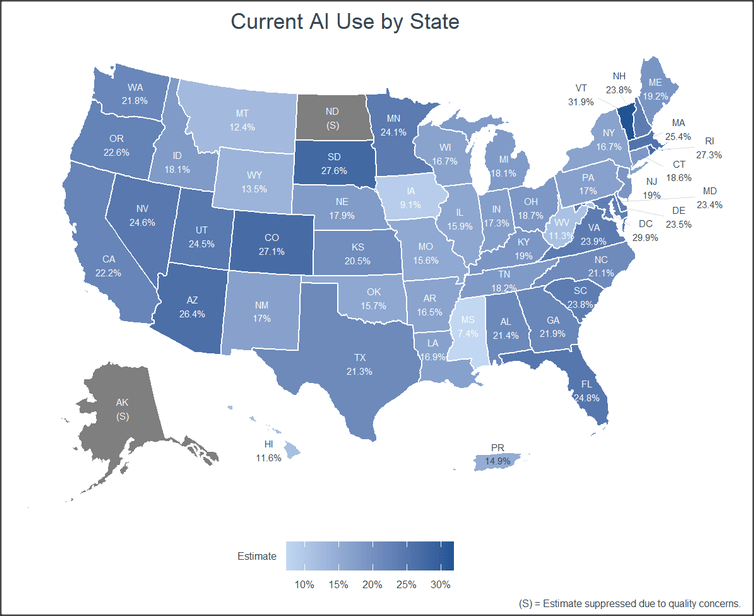
California businesses planning to use AI within the next six months is only marginally higher at 25.1%.
Using the national response data, AI use varies substantially across industries, ranging from 3.6% in Agriculture to 41.9% in the obvious leader, Information. The responses are statistically insignificant for two industries.
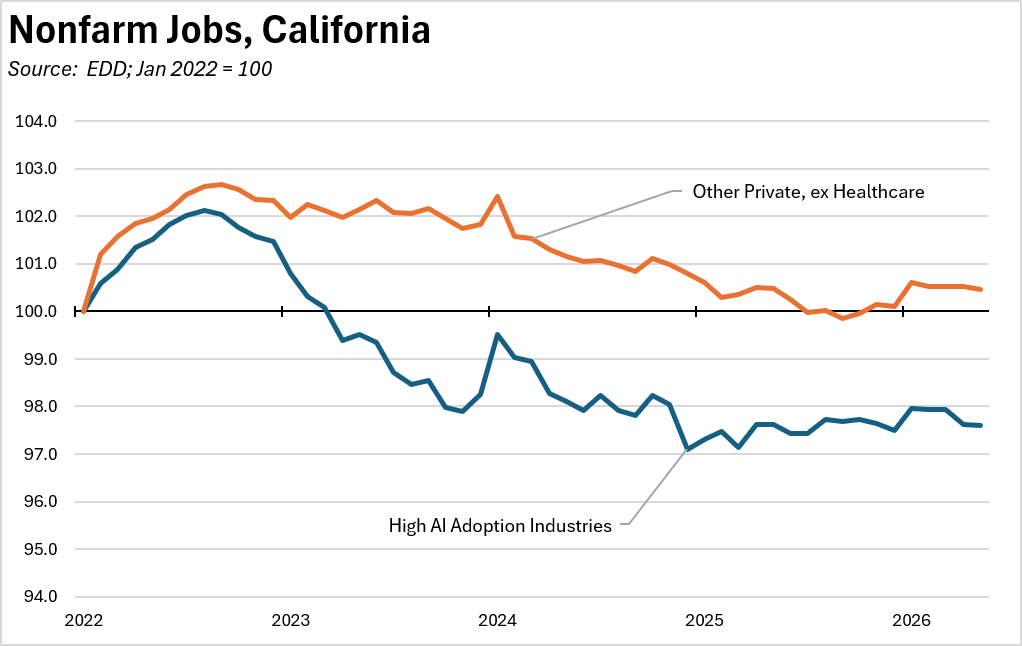
Comparing the California job numbers for the top 5 (except multi-unit companies) AI adopters with the rest of private industry—but removing the distorting effect of Healthcare & Social Assistance—there was a divergence in job trends following the release of ChatGPT in 2022. Since 2024, there has been no significant difference in job performance between the two industry categories.
Califormers: 2026 Fortune 500
In the most recent results for 2026, California lost its Number 1 ranking for Fortune 500 companies to Texas. California now has 56 companies on the list. Texas has 57. New York is third with 53. California previously held the number 1 slot in 2024 and 2025, and before that in 2014.
Texas gained the lead in large part due to the large number of corporate relocations to that state. The 2026 list includes 12 companies previously headquartered in California, including 7 that have moved since 2020.
California has lost Fortune 500 companies in the past as well, but it has remained in the top states as other companies such as Apple, Uber, Doordash, and Airbnb grew their way onto the list. The 2026 list is an exception. There are 12 new companies on the list this year. Three of them are in Texas. None are in California.
California in fact was the birthplace of one of those 12 new entrants, BitGo Holdings ranking at #273 in its debut. However, after bashing the proposed wealth tax by saying “Who in their right mind would found a new business in California if California does this?” the BitGo CEO relocated the company to South Dakota just ahead of its IPO this year. With BitGo, California would have tied with Texas. With the wealth tax proposal, it slipped into #2.
Califormers: CBRE Headquarters Relocation Report
In its most recent update, CBRE identified an upswing in corporate headquarters relocations in 2025, with 69 interstate moves and 26 international moves as foreign companies relocated to the US or formed a US subsidiary.
The Top 3 MSAs gaining headquarters were in Texas and Florida.
FIGURE 3: Top Cities That Gained Net New HQs (Interstate & International).
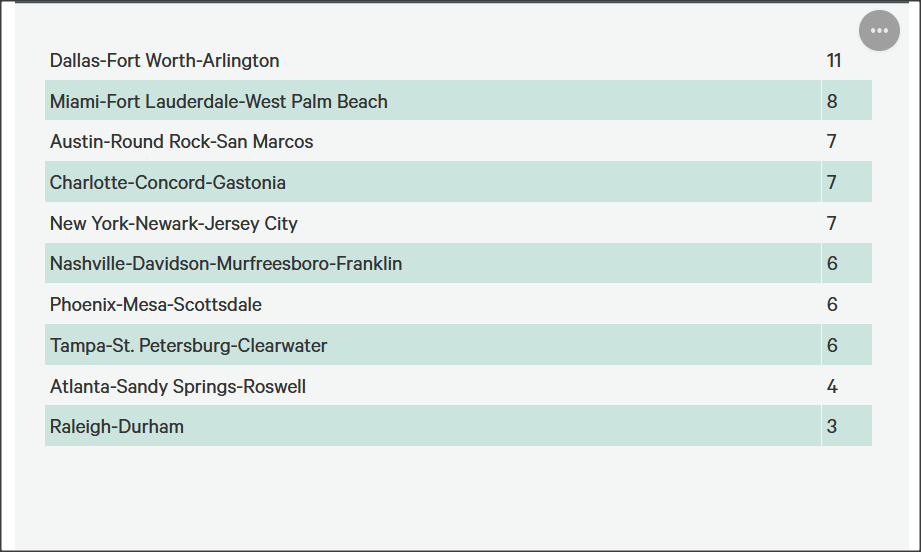
Source: CBRE Americas Consulting, 2026
California in contrast had 3 of the Top 4 regions losing headquarters.
Figure 4: Top Cities That Lost HQs
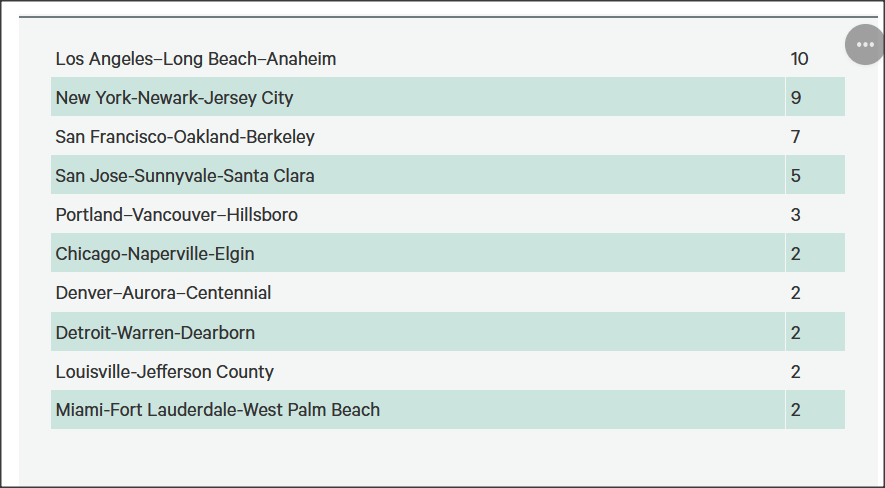
Source: CBRE Americas Consulting, 2026.
Califormers Update
Additional CaliFormer companies identified since our last report are shown below. The listed companies include those that have announced: (1) moving their headquarters or full operations out of state, (2) moving business units out of state (generally back office operations where the employees do not have to be in a more costly California location to do their jobs), (3) California companies expanding out of state rather than locating those facilities here, and (4) companies turning to permanent telework options, leaving it to their employees to decide where to work and live. The list is not exhaustive but is drawn from a search of sources in key cities.