The Center for Jobs and the Economy has released our full analysis of the November Employment Report from the California Employment Development Department. For additional information and data about the California economy visit www.centerforjobs.org/ca.
Highlights for policy makers:
- Key Takeaways
- The Year(s) That Was—California’s Economy & the Looming Budget Deficit
- Real GDP Grew in Q3 2023 for the First Time in 7 Quarters
- California Still the 5th Largest Economy in 2022
- California Became the Highest Cost State in 2022
- Population Fell for the 3rd Year in a Row
- Population Loss Driven by People Leaving the State
- Personal Income Squeaks Ahead of Inflation
- Nonfarm Job Growth Moderated in 2nd Half of 2023
- Jobs Growth Concentrated in 4 Industries
- Employment Drops 5 Months in a Row—Remains Short of Pandemic Recovery
- Unemployment Rate is 3rd Highest in the Nation
- Labor Force Participation Continues to Lag the US Average
- Labor Conditions Tighten
- California Provides the 3rd Highest Level of Social Assistance Among the State
- California’s Unemployment Insurance Program Covers a Fifth of the National Caseload
- Housing Shortages Persist
- Homelessness Rises Again in 2023
- Bay Area Economic Engine Has Stalled
- Budget Déjà vu
Key Takeaways
- State Budget Deficit: According to the LAO’s recent Fiscal Outlook, the state budget is projected to shift drastically from a $100 billion surplus in 2022 to a $68 billion deficit, mainly attributed to the impacts of minor shifts in private sector jobs and income on California’s volatile revenue structure.
- Economic Performance and Rankings: California’s real GDP displayed no growth throughout 2022 and the first half of 2023, lagging behind the US average and comparison states (such as Arizona and Texas). Despite marginally better performance in pandemic recovery, California ranks 21st in cumulative real GDP growth.
- Cost of Living and Population Trends: California’s rising cost of living made it the highest-cost state in 2022. The state’s population has declined for the third consecutive year, 75,400 people in 2023 alone, totaling around 538,000 over the three-year period, with significant domestic migration, particularly to Arizona, Texas, and Florida.
- Employment Challenges and Unemployment Rates: California’s job growth, especially in industries such as Social Assistance; Transportation and Warehousing; Professional, Scientific and Technical Services; Health Care, has been moderate, with employment still below pre-pandemic levels. California faces the third-highest unemployment rate among states, and labor force participation lags behind the national average.
The Year(s) That Was—California’s Economy & the Looming Budget Deficit
The LAO’s recent Fiscal Outlook expects the state budget (general fund) to shift from a $100 billion surplus in 2022 to a $68 billion deficit in the upcoming budget window. The report ties most of this reversal to a downturn in the state’s economy, once again demonstrating the extent to which even minor shifts in trends affecting private sector jobs and income quickly become magnified in the state’s highly volatile revenue structure. In this month’s report, we focus on an overview of the state’s economic performance through a “year that was” look back using recently released 2022 and, where available, the most current 2023-to-date data for several indicators. These indicators are considered from three perspectives: (1) California trends, (2) California compared to the top three states to which Californians are moving and suggesting reasons why they’re moving there, and (3) comparative California performance in recovery from its pandemic period economic policies and the effect those policies have had on long-term growth prospects.
Real GDP Grew in Q3 2023 for the First Time in 7 Quarters

In the recently revised data, California’s economy showed no real growth during 2022 and the first half of 2023. Real GDP (on an annualized basis) did not exceed the Q4 2021 level until the results for Q3 2023, which came in at 0.7% higher.
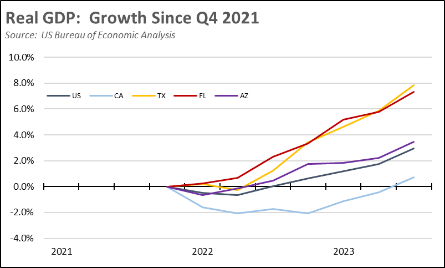
California’s performance in this period fell below the US average, which posted a cumulative growth of 2.9%. The comparison states also outperformed California, ranging from 3.4% for Arizona to 7.8% for Texas. The US has so far escaped the long-predicted recession. California instead has just come out of recessionary conditions—a primary factor in the steep drop in expected state revenues.
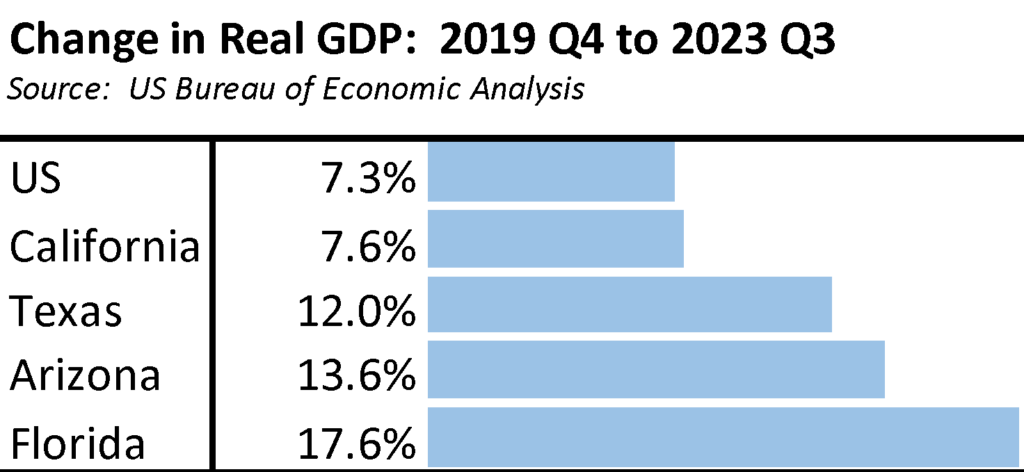
Looking instead at the pandemic recovery comparison, California’s Real GDP has performed largely in line but marginally better than the overall US average. California’s cumulative Real GDP growth of 7.6% ranks 21st highest in this period among the states and DC, which ranged from 17.6% in Florida to -2.6% in Hawaii.
California Still the 5th Largest Economy in 2022
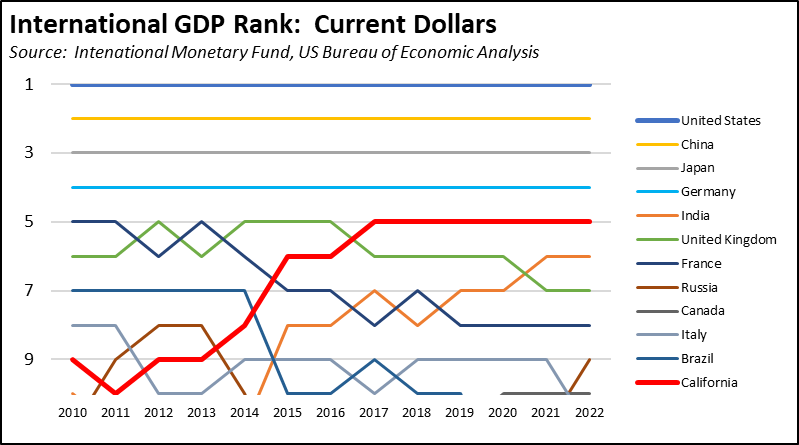
Towards the end of 2022, the state’s political leadership embraced the speculation in a Bloomberg op-ed piece that California could surpass Germany to become the 4th largest economy that year. It did not happen. With the full numbers now out, California remained in 5th place when measured by current dollars. Based on the IMF projections and California’s weak performance to date, the state in fact risks dropping to 6th largest behind India by 2024.
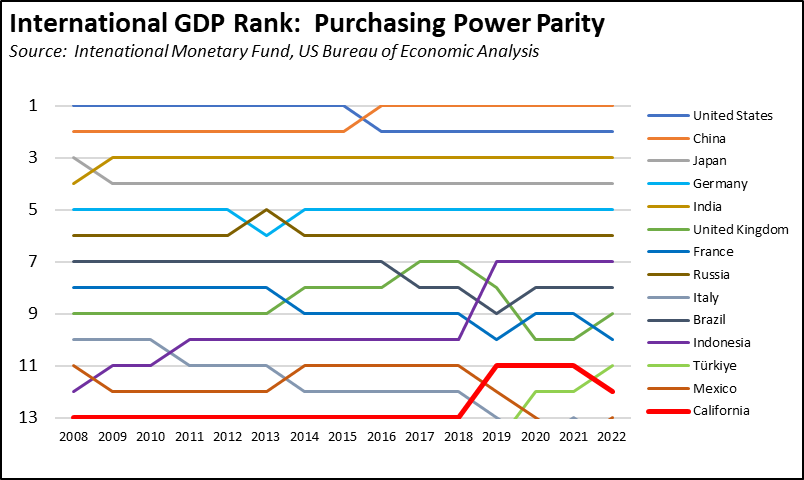
California, however, dissipates much of its economic growth through high and increasing costs of living. Adjusted to Purchasing Power Parity terms to reflect relative costs of living in each country—and adjusting California’s numbers using the US Bureau of Economic Analysis Regional Price Party series—California drops to 12th highest in 2022, down from 11th in 2019 through 2021.
California Became the Highest Cost State in 2022
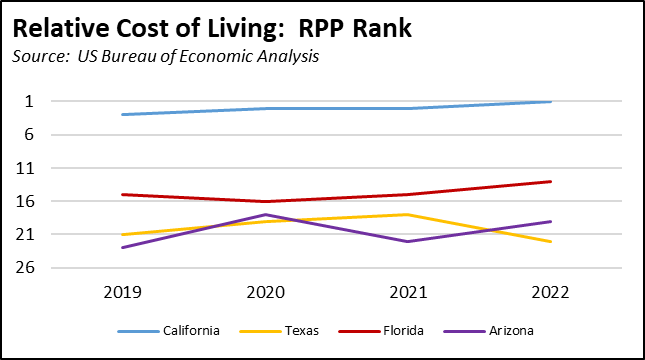
California’s relative drop came in part from its rising costs of living. After remaining in 2nd place behind Hawaii the prior two years, California became the highest cost state in 2022 based on the US Bureau of Economic Analysis Regional Price Parity series. The three comparison states in contrast posted within the (upper) middle ranks, reflecting core reasons why Californians have chosen to move there. Note that DC’s RPP was marginally higher, but among the states, California was the highest.
![]()
In addition, California in 2022 contained 8 of the 10 most costly urban areas in the country, and 14 of California’s 24 MSAs are in the 25 most costly.
Population Fell for the 3rd Year in a Row
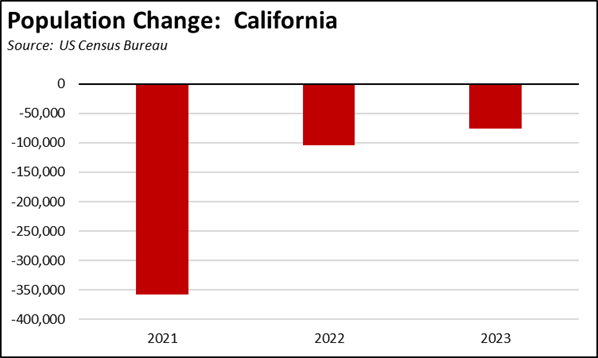
The most recent Census Bureau numbers indicate California’s population fell for the third year in a row. Population loss is estimated at 75,400 in 2023, and a total of 538,000 over the three-year period. To put this loss into perspective and using the Census Bureau projections for total US population in 2030, California could lose up to another 3-4 Congressional seats if recent trends continue. Texas and Florida would each gain up to about 4 seats if their trends continue.
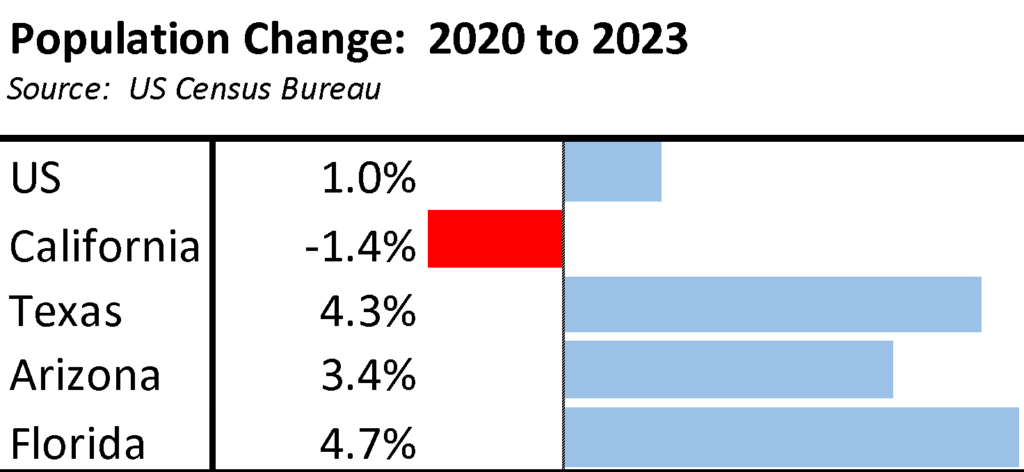
In this same period, overall population growth was up 1.0% for the US as a whole. California ranked 48th highest among the states and DC, which ranged from 6.2% in Idaho to -2.7% in New York.
Population Loss Driven by People Leaving the State
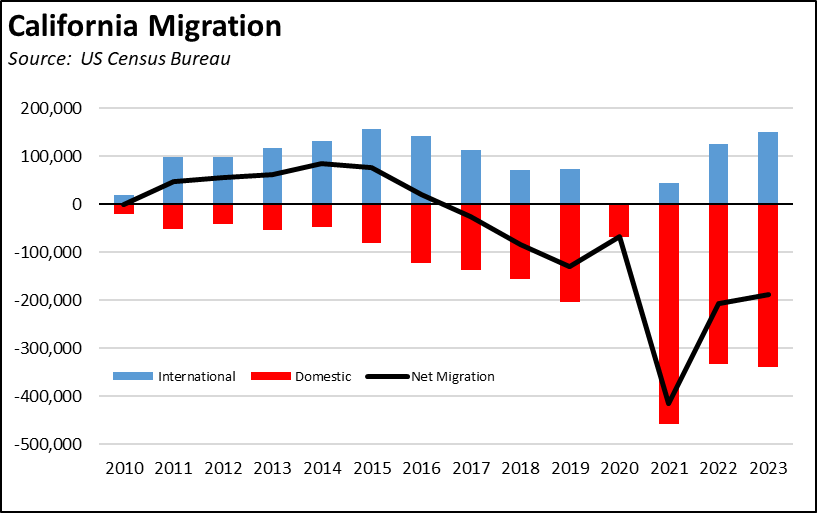
In the last few decades, California generally has seen population loss through domestic migration, with more leaving the state than moving here. The loss previously was relatively low and more than offset by international moves. Conditions began reversing in 2017, the year when California housing prices largely recovered from the drop during the Great Recession and made it financially feasible for more Californians to move and more costly for others to come here. The number of people leaving has also risen, with a net loss of 1.2 million since the pandemic and 1.7 million since the housing recovery in 2017.
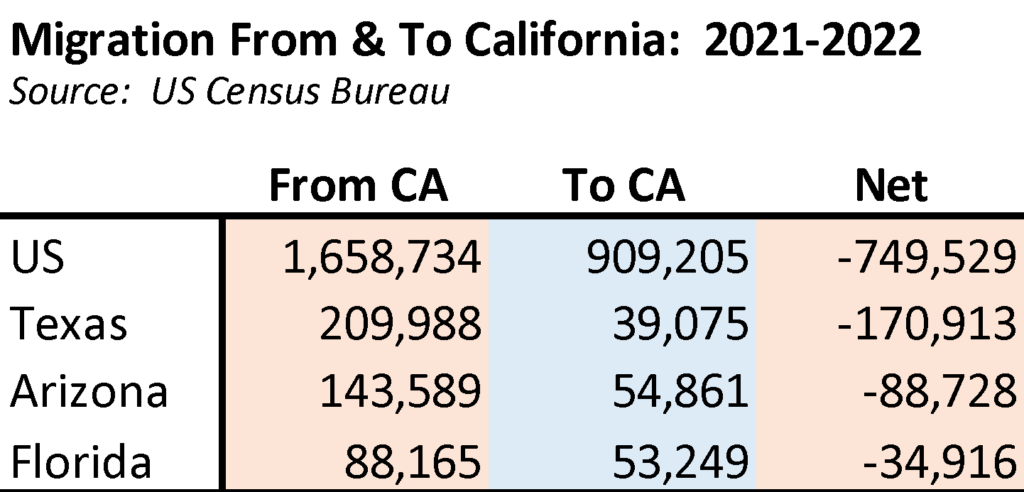
In 2022, Census Bureau data shows the top three destinations for the 817,670 Californians leaving the state were Texas (102,440), Arizona (74,160), and Florida (50,700). As the governor has correctly pointed out, some previous residents of those states have also moved here. While 2020 data is not available, the 2021 and 2022 results indicate there still is strong outflow dominating the results at least since the pandemic.
Personal Income Squeaks Ahead of Inflation
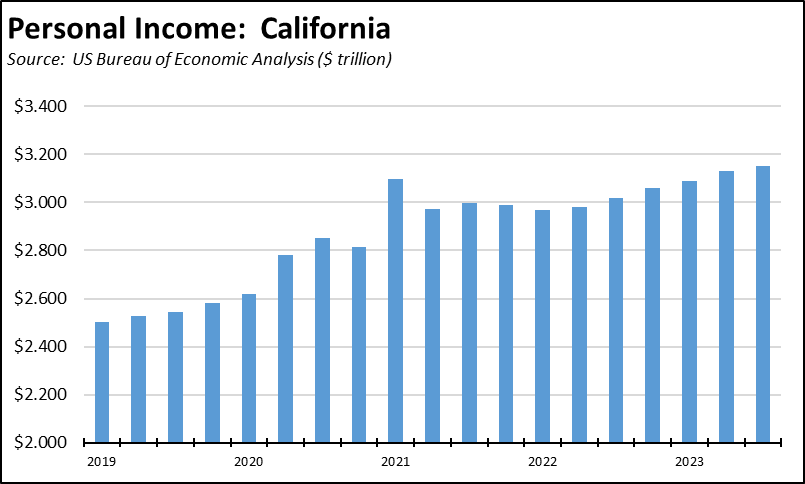
After rising under the influx of federal pandemic assistance in 2020 and 2021, total state Personal Income showed little change throughout most of 2022. Compared to the same quarter in 2022, Personal Income then rose 4.4% through Q3 2023. In this same period, however, inflation as measured by the Consumer Price Index rose 3.5%, erasing most of these gains. In real dollars, the state’s taxation base has seen little movement—other than out of state—since 2021.
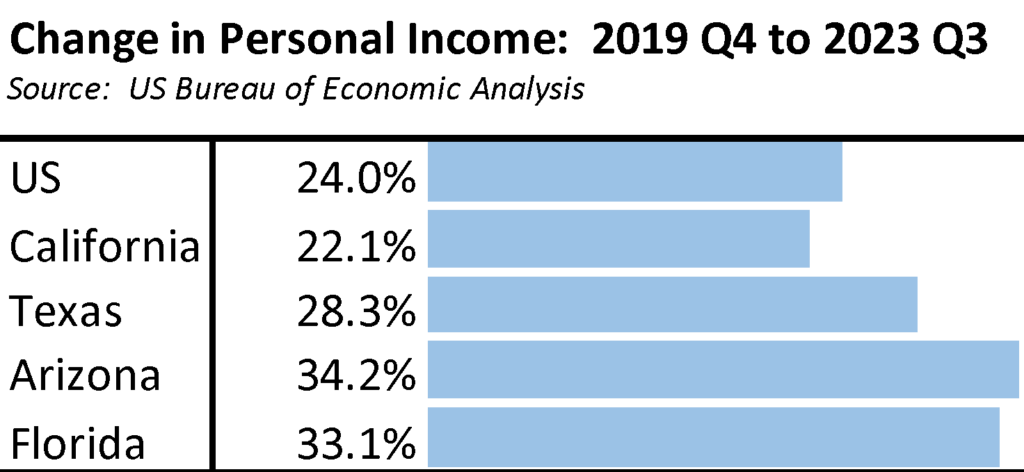
In the comparison since the pandemic, California’s Personal Income growth falls just below the overall US average, influenced by population loss and migration of higher income households. California ranked 35th among the states and DC, which ranged from 36.7% growth in Idaho to only 15.4% in New York.
Nonfarm Job Growth Moderated in 2nd Half of 2023
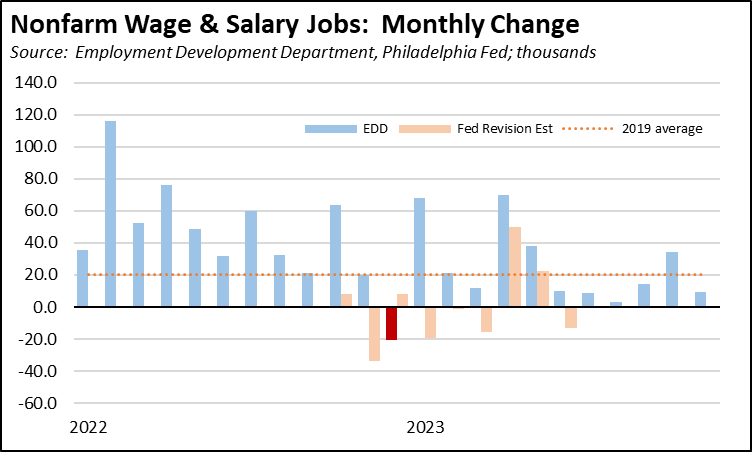
The high job gains in 2022 largely reflect businesses rebuilding sales levels after the state finally allowed them to reopen their doors. Rather than true growth, about two-thirds of the gains that year still came from the reopening recovery starting in mid-June 2021. Subsequent jobs growth was relatively strong in the first half of 2023, but since June has fallen well below the 20,500 monthly average previously experienced in 2019.
The job numbers reported monthly are based on a survey and modeling and subject to change as more data becomes available. The annual revisions to be released later in March are likely to take the numbers lower. As we previously discussed, the preliminary benchmark revision released by US Bureau of Labor Statistics shows a total downward revision to the national job numbers of 306,000, of which 197,800 would affect the California total. The preliminary revision is based on actual job counts coming from the Quarterly Census of Employment & Wages, and consequently is frequently changed based on revised estimates for the job classes not covered by the payroll tax filings used in that Census. Alternative revision estimates addressing both components—as shown in the light red bars in the chart—instead come from the Philadelphia Federal Reserve Bank. Based on their most current Q2 results, the California jobs total would be revised downwards by about 270,000.
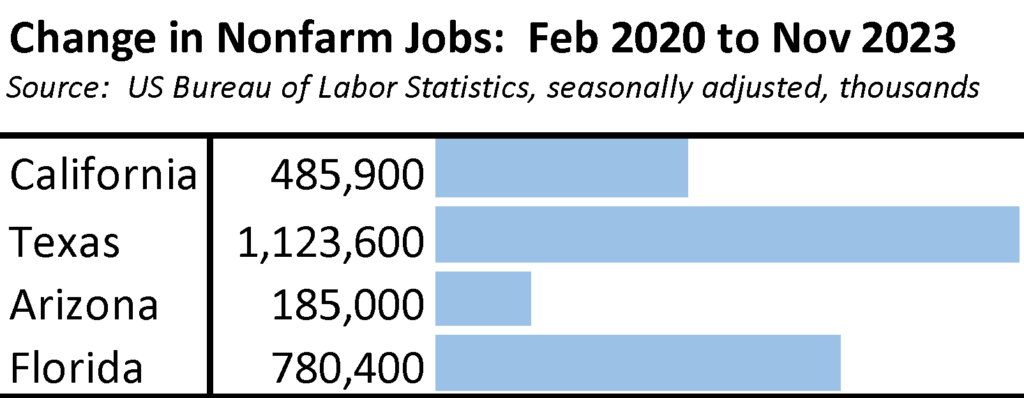
Using the current monthly estimates, however, California has gained 485,900 net jobs compared to the pre-pandemic peak. This total ranks as third among the states and DC, behind Texas with over 1.1 million net jobs and Florida with 780,400.
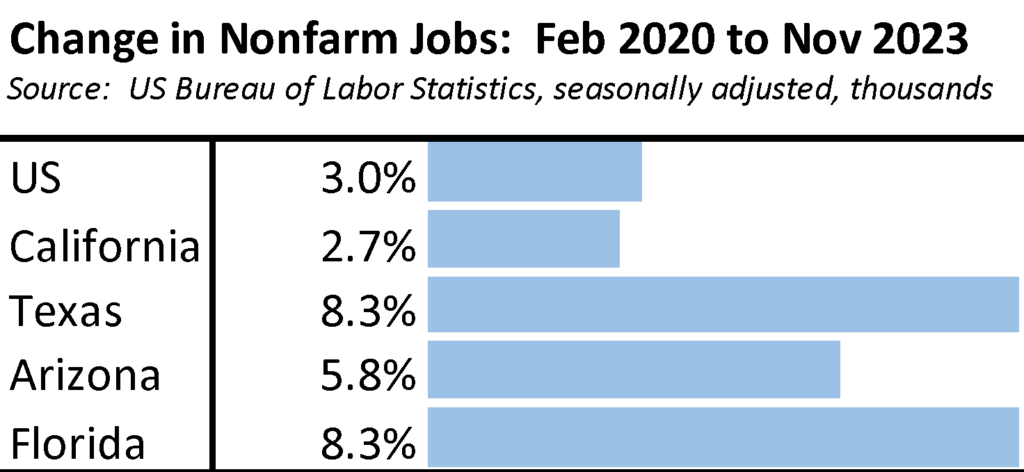
Adjusting for size, California’s job expansion at 2.7% remains somewhat below the overall US average. In the latest November results, California ranked 21st among the states and DC, which ranged from 11.7% growth in Idaho to -2.5% in Vermont.
Jobs Growth Concentrated in 4 Industries
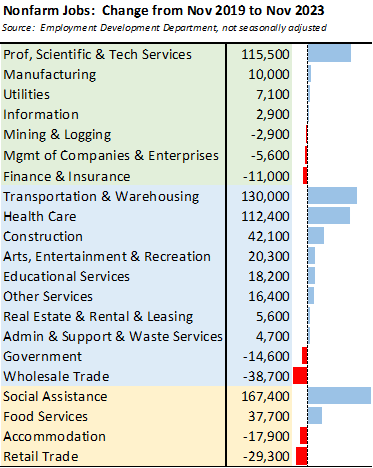
Using November 2019 as the pre-pandemic comparison point to account for seasonal factors, overall jobs growth in the state has been dominated by only a few industries, with state economic growth relying on 4 accounting for 92% of the net job gains in this period. And of these, only one is currently largely immune from adverse state actions and the looming deficit. In order of growth:
- Just under one-third of net jobs growth has been in Social Assistance, composed heavily of minimum wage In Home Supportive Services (IHSS) jobs paid through government funds. Much of this funding comes from federal dollars, but the total is also sensitive to state budget outcomes and regulations such as minimum wage requirements and last year’s unsuccessful domestic worker proposals.
- Transportation & Warehousing is the second largest growth center and the only blue-collar industry that kept growing throughout the pandemic. These middle-class jobs, however, remain under threat from continuing lawsuits especially under CEQA along with increasing regulations such as the South Coast AQMD indirect source regulatory program for warehouses and the ports.
- Professional, Scientific & Technical Services includes major components of the tech industry (Information is the other primary source), and growth during the pandemic benefited more than most industries from the rapid shift to telecommuting. This industry is the primary higher wage growth center, but with jobs that generally require an undergraduate degree or higher.
- Health Care contains a broader mix of wage levels and educational requirements. While generic growth will continue as the state population ages, a portion of the current gains has instead come from expansion of government health care assistance programs which are vulnerable to state budget actions and related regulations such as last year’s increase in the healthcare worker minimum wage—as the state is now finding out only after enactment of the subject legislation.
In the chart, the green shaded industries are those paying higher average annual wages (more than $100,000) in the latest results for 2023, blue are those paying medium average wages ($50,000 to $100,000), and gold those paying lower wages (under $50,000).
Employment Drops 5 Months in a Row—Remains Short of Pandemic Recovery
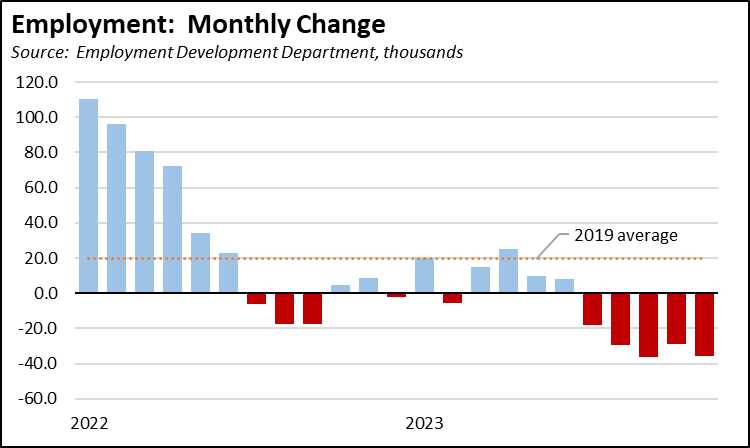
Employment began 2022 by following the nonfarm jobs trend, with substantial gains largely coming from reopening of the state’s businesses. Beginning in the second half, employment instead has shown disappointing results, falling well below the 2019 monthly average gain of 19,500 and posting losses in 10 of the subsequent 17 months.
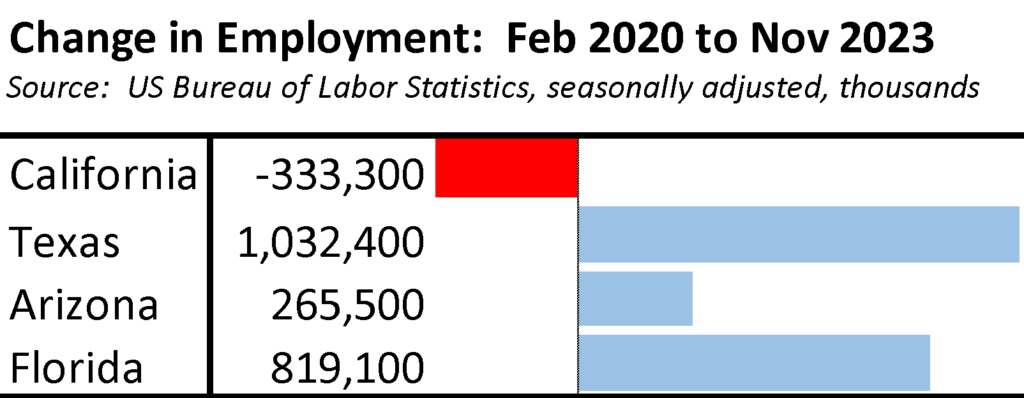
As a result, California employment in the latest results from November remains 333,300 below the pre-pandemic level.
Recovery has not yet been achieved, and in fact the trend is in the reverse direction. Population loss has had an effect on this outcome, but so too have the state’s policies increasing the costs of employing workers and the state’s increasing emphasis on benefits rather than earned income.
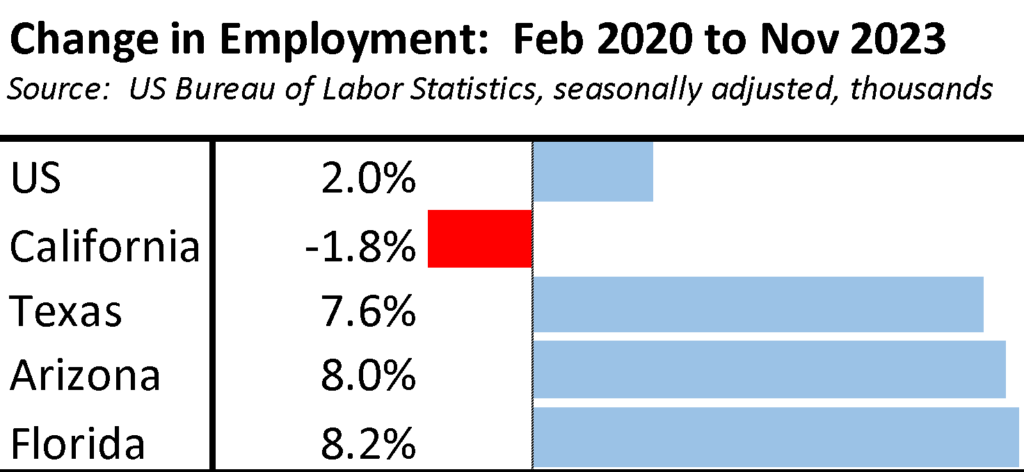
Adjusting for size, California’s employment loss of -1.8% remains well below the overall US average. In the latest November results, California ranked 47th among the states and DC, which ranged from 10.5% growth in Utah to -3.3% in Maryland.
Unemployment Rate is 3rd Highest in the Nation
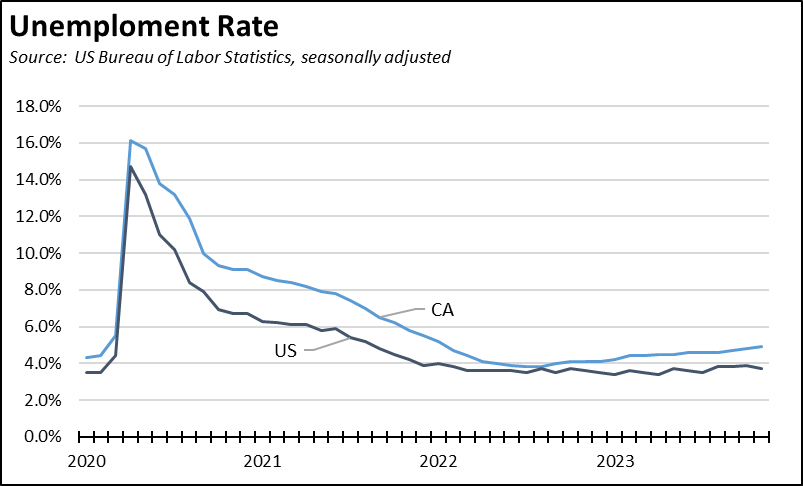
Unemployment is rising as well. While the US average rate has remained relatively level, the California unemployment rate (seasonally adjusted) has been on an upward trend since August 2022. After declining 324,300 in the first 8 months of 2022 to its lowest post-pandemic level, the number of unemployed (seasonally adjusted) in California has since risen by 230,200 as of the latest results in November 2023.
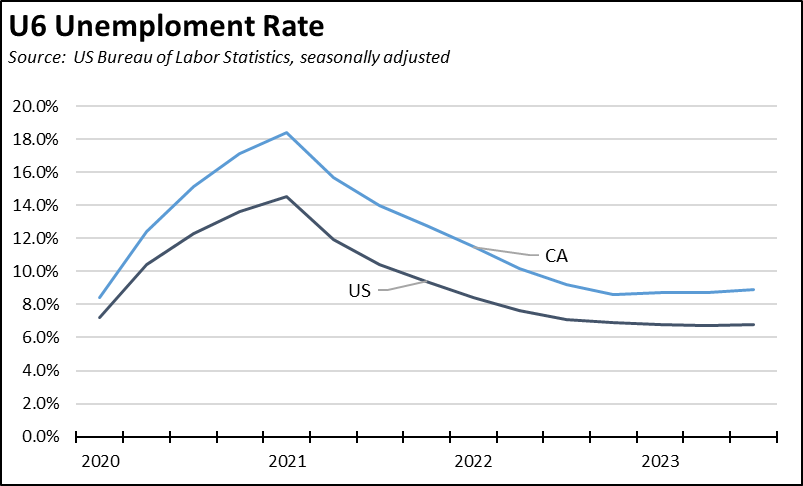
Underemployment is also rising but at a slower rate. While the unemployment rate reported monthly covers only those in the labor force—working or looking for work—U6 is a broader measure that also covers underemployed, marginally attached, and discouraged workers as well.
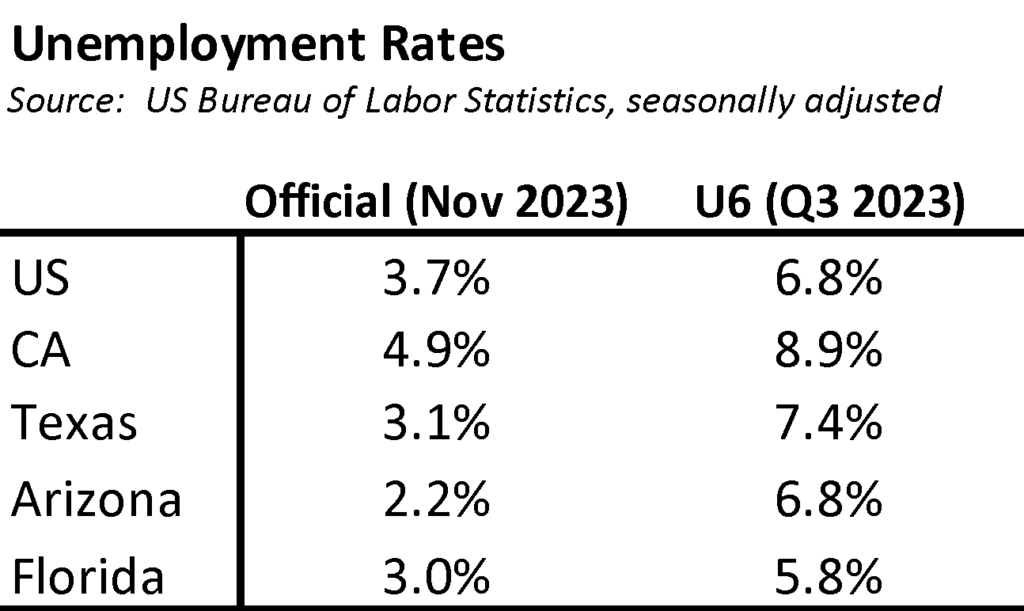
In the latest results from November, California again had the third highest unemployment rate among the states and DC, which ranged from 1.8% in Maryland to 5.4% in Nevada. California had the 2nd highest U6 rate in Q3 2023, which ranged from 3.8% in North Dakota to 9.1% in Nevada.
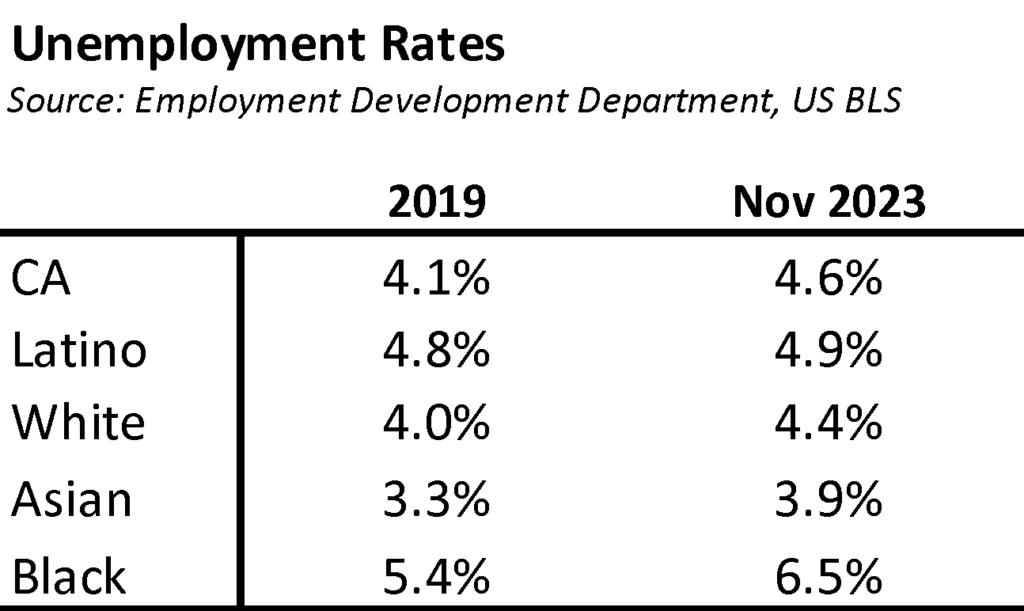
By ethnicity and race, Latinos have maintained a higher level of relative recovery although still with unemployment somewhat above the state average. The other groups have experienced a relatively higher incidence of unemployment compared to pre-pandemic conditions, with Black unemployment rates 40% higher than the state average. Note that the numbers in this table are based on a 12-month moving average of data from the Current Population Survey, and consequently differ from the modeled results reported each month.
Labor Force Participation Continues to Lag the US Average
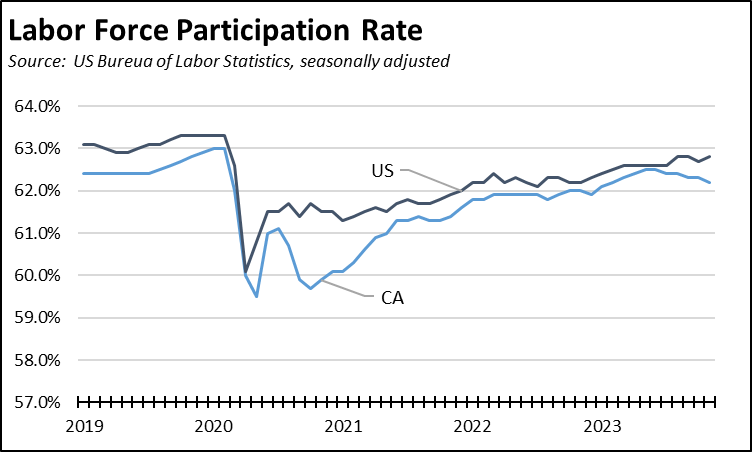
Although it still has a relatively younger population than the US as a whole, California’s labor force participation rate lags the overall US average. The two rates began converging at the beginning of 2023, but California’s has dropped since June while the US has remained relatively stable.
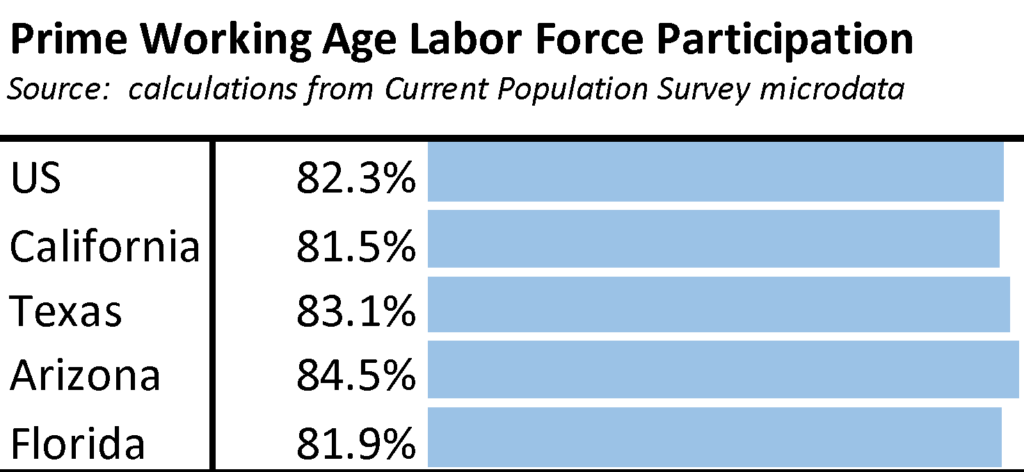
The total participation rate, however, increasingly is becoming sensitive to the aging of the workforce, particularly when considering accelerated retirements especially for men during the pandemic period. A more consistent comparison measure is the participation rate for prime working ages (25-54). Under this metric, California’s participation rate at 81.5% as of November 2023 is above the pre-pandemic level of 80.7% in 2019. Still, if California was showing the average US ratios, employment for this key age group would be 202,000 higher. If instead the state’s job policies followed Arizona more, employment would be 534,000 higher. Note that as above, the numbers in the chart are based on a 12-month moving average of the Current Population Survey data and may differ from the modeled estimates reported each month.
Labor Conditions Tighten
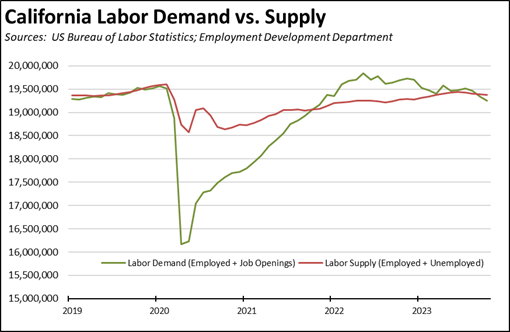
Labor force participation and the consequent labor supply has a direct effect on overall growth potential for the state’s economy. Throughout 2022 and the beginning of 2023, California along with the rest of the US experienced labor supply shortages. Jobs were available as shown by record unfilled job numbers in the US Bureau of Labor Statistics Job Openings and Labor Turnover Survey (JOLTS) data, but the workers to fill them all were not. Job growth lagged its potential although wages rose as a result. Supply conditions have subsequently tightened as labor demand has begun to ease as companies have cut back on hiring plans especially in the tech industry.
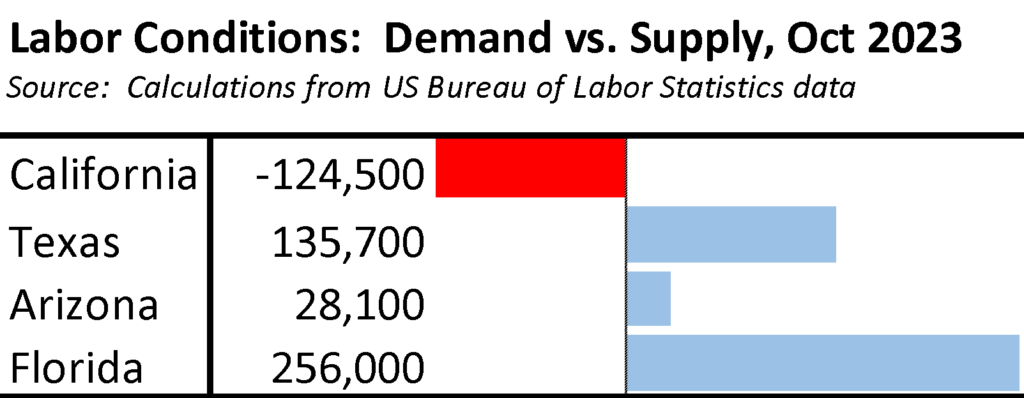
As of the latest data for October 2023, the comparison states continue to demand more workers than what their current labor pools can supply, conditions that are favorable to sustained migration into these states.
California Provides the 3rd Highest Level of Social Assistance Among the State
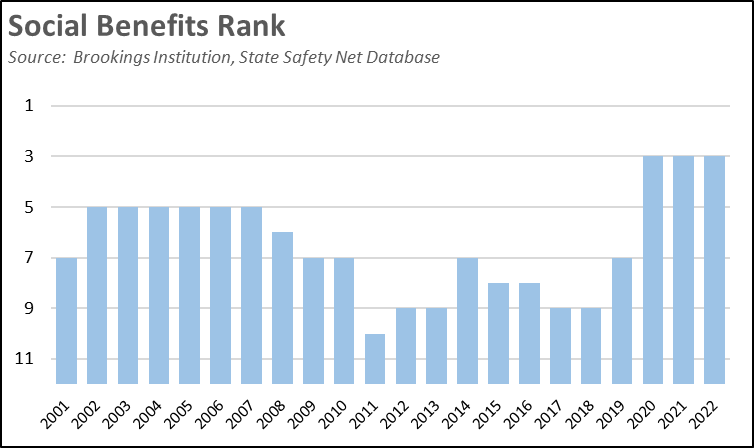
California’s expansion of its social benefit programs in recent years has jumped it to the 3rd highest among the states and DC, according to the State Safety Net Database developed by Brookings Institution. The rankings are based on the average benefits paid to single-parent families under 5 programs: state and federal earned income tax credit (EITC), Temporary Assistance for Needy Families (CalWORKs), Supplemental Nutrition Assistance Program (CalFresh), and the refundable portion of the Child Tax Credit.
The analysis is limited to just the 5 programs, and does not account for some of the largest components including healthcare, subsidized childcare, and utility subsidies. Our previous research provides a more comprehensive accounting of the different assistance programs available in the state but still does not include estimates for all including more targeted as well as less quantifiable programs such as WIC, SSI/SPP, veterans’ benefits, unemployment insurance, disability payments, tuition, and job training and other benefits provided as services rather than cash assistance. For comparison, these reports estimated that a single parent family with 2 small children in California and earning $15 an hour working full time in 2022 would have been eligible for assistance (cash and non-cash) totaling $39,500, with the largest addition coming from the value of public healthcare insurance and the second largest coming from the value of daycare services.
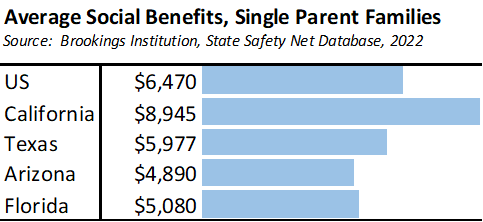
In the Brookings analysis for 2022, California ranked 3rd among the states and DC, which ranged from $10,650 in Hawaii to $4,695 in Arkansas.
California’s Unemployment Insurance Program Covers a Fifth of the National Caseload
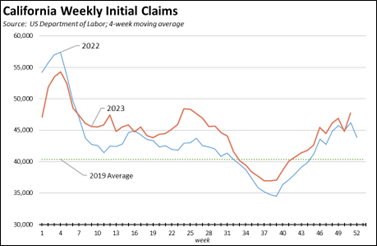
Unemployment Insurance (UI) claims provide a real time measure of the state economy as well as representing a key cash benefits program for the unemployed. Initial claims (on a 4-week moving average basis) have trended above the pre-pandemic (2019) level in both 2022 and to date in 2023, but the 2023 numbers after an initial rise mid-year have been only slightly above the prior year’s since.
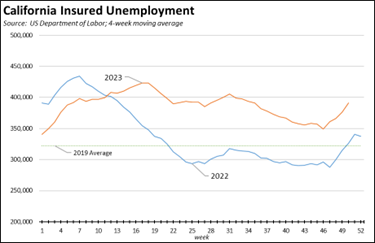
Insured unemployment, a proxy for continuing claims, in contrast has been trending much higher, with workers remaining unemployed for longer periods.
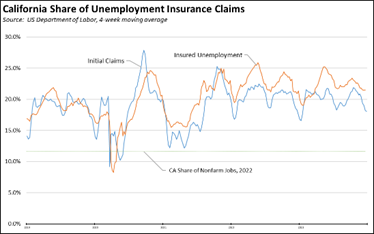
Part of the reasons behind this outcome is that the UI program is operated in a way that provides more generous benefits than in other states. While containing only 11.6% of all jobs in the US, the latest results indicate California handles 18.1% of all initial claims (as of the week ending December 23) and 20.7% of all insured unemployment (as of the week ending December 16). On a trendline basis, these levels have been relatively consistent throughout 2022 and 2023 and remain elevated above pre-pandemic 2019.
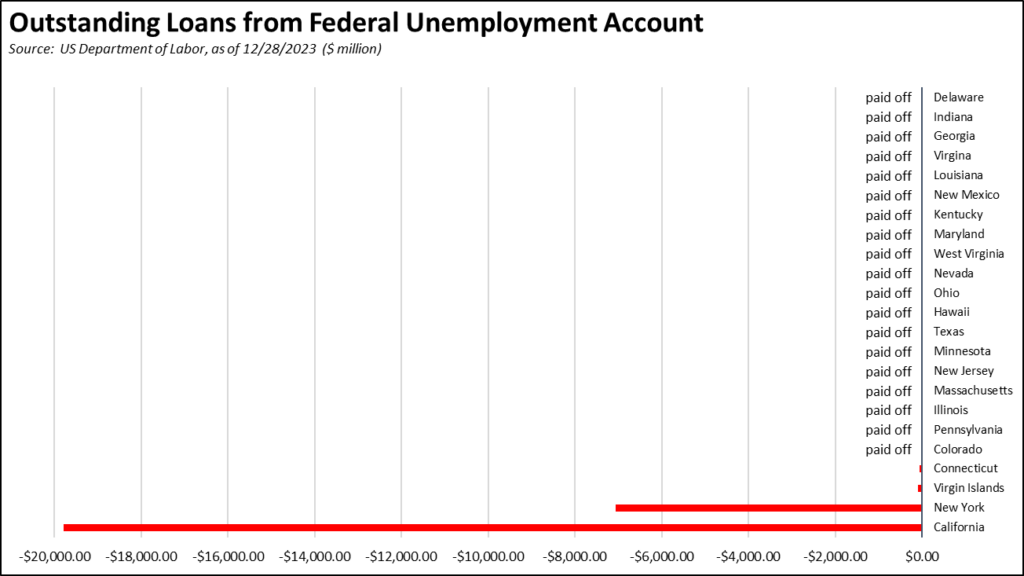
While every other state than New York has paid off their pandemic period UI debt using the federal assistance provided for this purpose and to restore state funds to their previous levels, California in stark contrast continues to add to this debt and increase the required rise in payroll taxes to pay it off. In the most recent accounting of December 28, California owed $19.8 billion. And rather than shrinking, the debt continues to grow even under post-pandemic economic conditions, ending the year $100 million above EDD’s most current projections.
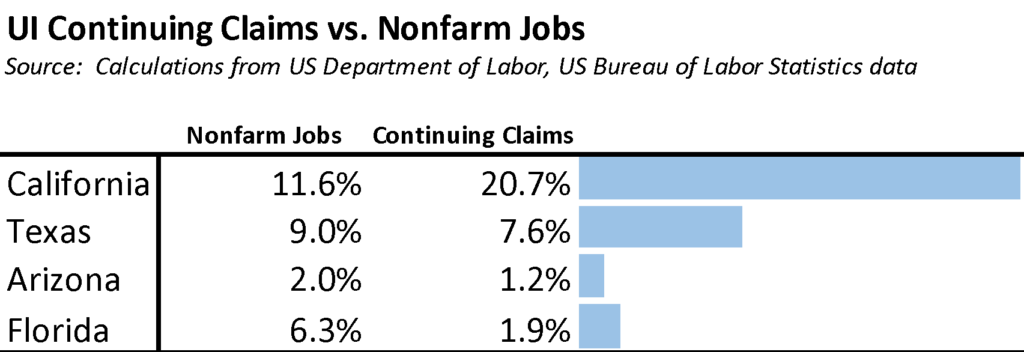
State program operation along with jobs availability produce a quicker return to earned income in the comparison states. In the table, the Nonfarm Job share is based on the most recent November 2023 data. The share of continuing claims is based on a 4-week moving average as of the week ended December 16.
Housing Shortages Persist
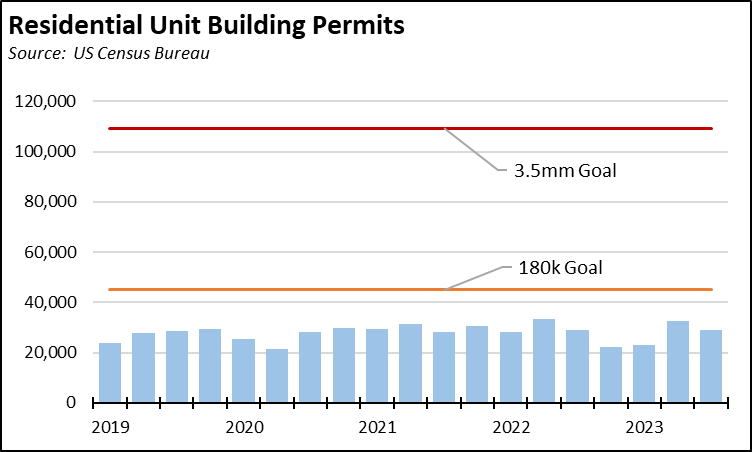
As measured by residential building permits, new housing construction remained below the state housing plan goal of 180,000 new units in both 2022 and 2023. Permit activity remained even further below the goal of 3.5 million new units by 2025 announced by the governor as a candidate in 2017. Even as an aspirational goal this target has failed to move the numbers. New permits totaled 113,094 in 2022, barely above the 111,788 in 2017, while the 2023 numbers are on course to come lower at around 105,000. While the state continues to enact various reform measures in an attempt to accelerate new housing, these often contain additional provisions that reduce or more than fully offset the anticipated cost savings.
Rising interest rates are also having an effect. Fixed mortgage rates have risen to an average of 6.4% since the Fed began its recent rate actions, compared to average rates that were as low as 2.7% in the preceding period. While this level is below the averages of 8.1% that prevailed in the 1990s and 12.7% in the 1980s, these rates are now being applied to housing prices that were already pushing affordability for a shrinking share of the population.
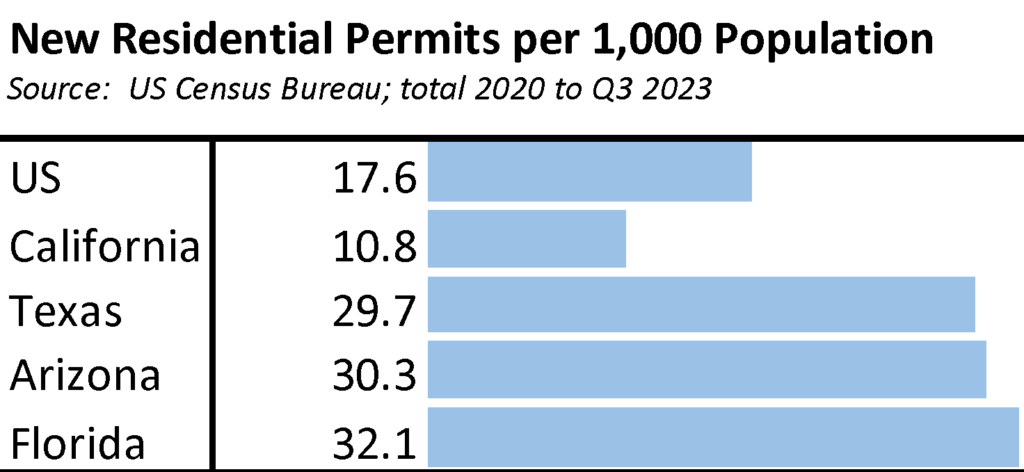
In absolute terms, California had the 3rd highest number of residential permits at 421,639 between 2020 and Q3 2023, behind Texas with 905,975 and Florida with 724,922. Adjusting for population size (new permits per 100,000 population), California came in 39th during this period among the states and DC, which ranged from 35.6 in Utah to only 4.4 in Rhode Island.
With the comparison states building housing nearly three times as fast, California has now shifted to a de facto reliance on domestic migration to help solve its housing problems. Using average household size, the population loss over the past three years freed up about 194,000 housing units, or more than covering the gap between the 180,000 unit annual goal and the actual number of new permits in this period.
Homelessness Rises Again in 2023
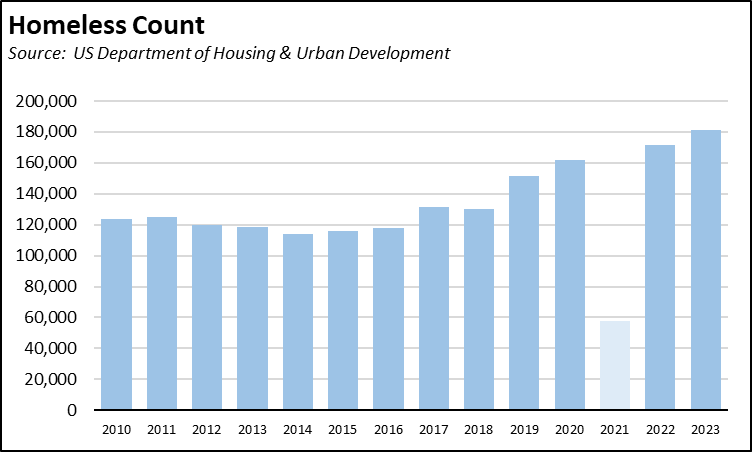
The most recent Point-in-Time Homeless Inventory Report from the US Department of Housing & Urban Development shows the number of homeless in California rising 5.8% to 181,399 in 2023. Note that in the chart, the unsheltered numbers were not included in the final report for 2021 because HUD gave communities an option of whether or not to conduct this portion of the survey due to COVID concerns.
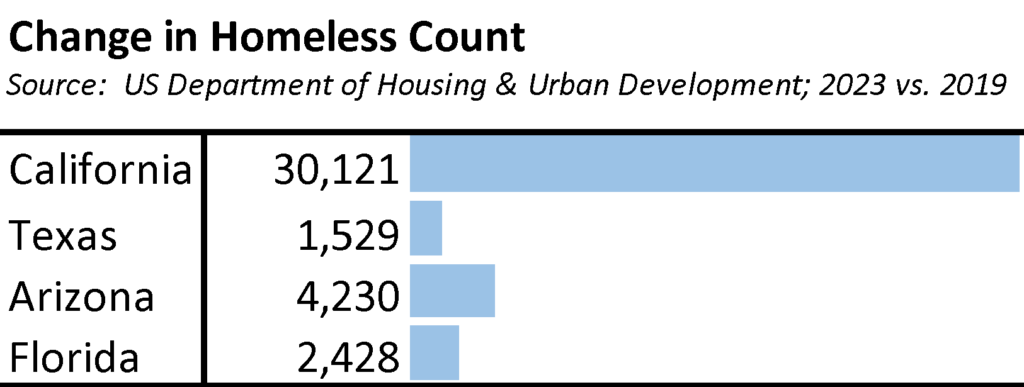
California contained 27.7% of the national homeless population in 2023, up slightly from 26.6% in pre-pandemic 2019. California’s additional homeless population of 30,121 between 2019 and 2023 accounted for 35.3% of the rise across all states in this period.
Bay Area Economic Engine Has Stalled
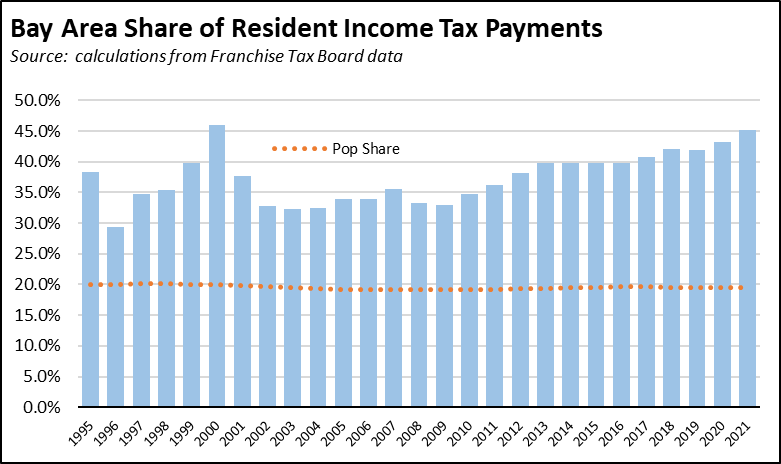
The state budget—and its consequent conditions of surplus or deficit—have become heavily reliant on economic outcomes in the Bay Area and more specifically on the personal economic well-being of only a relative handful of taxpayers. In the latest results for tax year 2021, the Bay Area produced 45.2% of all resident personal income tax (PIT) payments. Only 8,519 taxpayers (0.05%) with adjusted gross income (AGI) of $10 million or more paid 24.4%, and the 0.9% having AGI of $1 million or more paid 49.2%. California produces a budget surplus only so long as these taxpayers continue to pay such outsized shares.
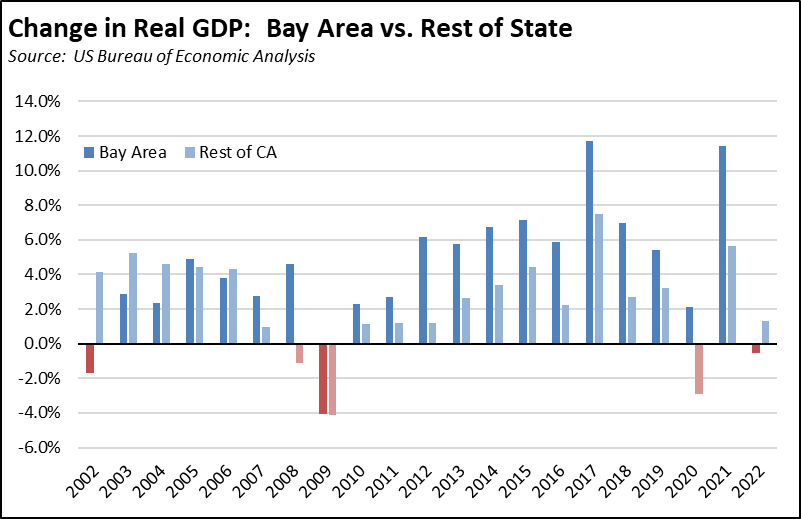
In 2022, the Bay Area economy stalled out as measured by Real GDP. The Bay Area experienced its first drop since 2008, dipping by 0.5%. The rest of the state grew by 1.3%.
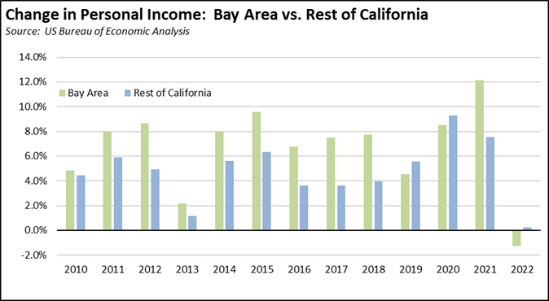
Personal Income—the core tax base on which the state now relies—fell 1.3% for the Bay Area in 2022 after posting the strong gains even through the pandemic that generated the recent record surpluses. Personal Income in the rest of the state showed marginal gains of 0.2%.
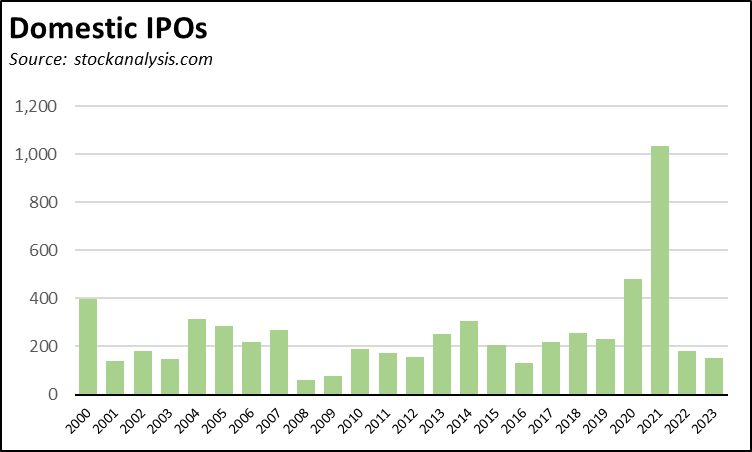
The core weakness in the Bay Area economy has come through its reliance on the tech industry, producing booming jobs and income in good times and taking down the state averages in bad. IPOs generating capital gains income and taxes in 2023 were by one accounting at their lowest level nationally since 2016. Not included in these numbers are SPACs, acquisitions, and other exit actions.
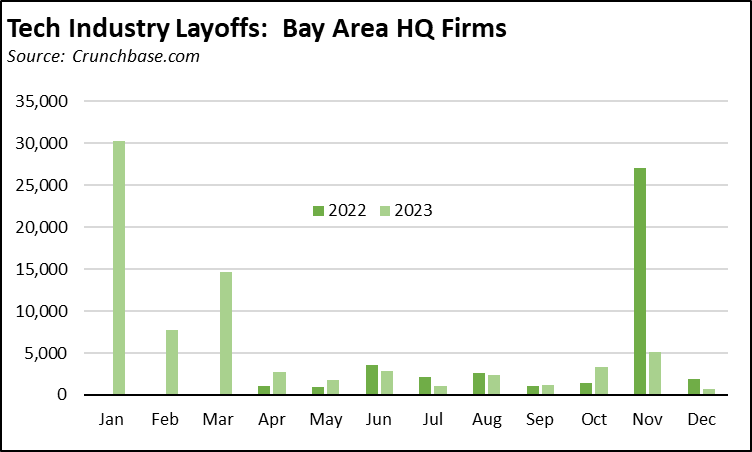
Tech industry layoffs also became news, replacing a previous period of sustained hiring into very high wage jobs. Based on tracking public announcements and news stories, layoff.fyi shows tech companies headquartered in the Bay Area laying off 85,168 in 2022 and 77,870 in 2023. The tracking site cruchbase.com shows 41,829 in 2022 and 73,663 in 2023 (through mid-December). Both sites, however, contain a large number of entries where the affected job numbers are unknown, including for several of the larger companies. Adjusting the Crunchbase numbers for this factor, layoffs in 2023 were likely closer to 114,000. In addition to layoffs, many tech companies have also announced a slowing in their hiring plans, especially as the industry restructures to shift its focus to AI.
Budget Déjà vu
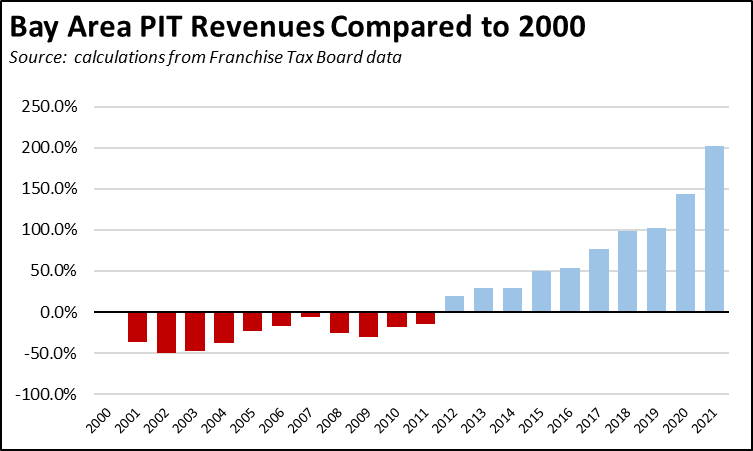
To paraphrase another baseball player not named Shohei Ohtani, the current budget situation is déjà vu all over again. At the beginning of 2000s, the tech industry was booming in the Bay Area, producing large budget surpluses as that region generated 45.9% of state PIT revenues in 2000. Those budget conditions quickly reversed under the force of the Dot.Com recession, with Bay Area PIT revenues plunging 49.9% by 2002 back to their 1998 level. The Bay Area tax contribution did not return to the 2000 peak until 2012, keeping the state budget largely in the doldrums throughout this period. Combined with the higher rates under Props 30 and 55, Bay Area receipts subsequently pushed the budget into repeated surplus conditions even as the Bay Area’s share of state population dropped from 20.0% in 2000 to 19.4% in 2021.
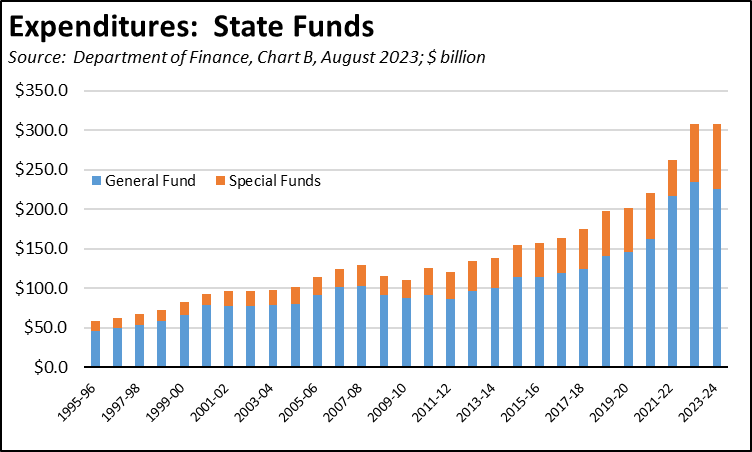
The other side of the deficit equation in 2001 and 2002 was the rapid rise in expenditures. The prevailing attitude prior to the drop was that California was in an “end of history” moment. Revenues had been rising and budgets were passed assuming they would continue to do so from the new plateau forever if not at least in the long term (in political years). Total expenditures (general and special funds) jumped 26.8% in just two years through 2000-01 as spending commitments were made in particular to baseline spending, including areas such as unfunded increases to state worker pensions and to UI benefits. Budget solutions to the deficits required cuts to ongoing programs, spending down dedicated fund balances, and taking on new and growing state debt.
Between 2011-12 when the budget began to receive the tax increases under Prop 30 to 2018-19, total spending (general and special funds) rose at an average annual rate of 7.3%. In the period after through 2022-23 (the 2023-24 amount shown in the chart will be subject to change in the upcoming budget), the annual increase jumped to 11.8%, but as detailed in the LAO report, the nature of those expenditures provides both options and challenges in the upcoming budget cycle. The biggest increase—$46.2 billion (17.6%)—took place in 2021-22. That money is largely spent, but the 2022 revenues came in short of what was needed to pay all the bills. For the other two years in the budget window there are more options. Many—but not all—of the recent spending increases have entailed one-time expenditures and short-term or temporary programs under the governor’s “down payment” approach to several of his prior commitments. As the LAO indicates, these options along with substantial balances in both official reserves and special funds likely will reduce but not necessarily eliminate the need for cuts in baseline programs depending on how the shifts in Prop 98 funding are handled. The tradeoff, however, is that by using them in next year’s budget, fewer options will be left on the table should revenues remain depressed and deficits continue into the following years.
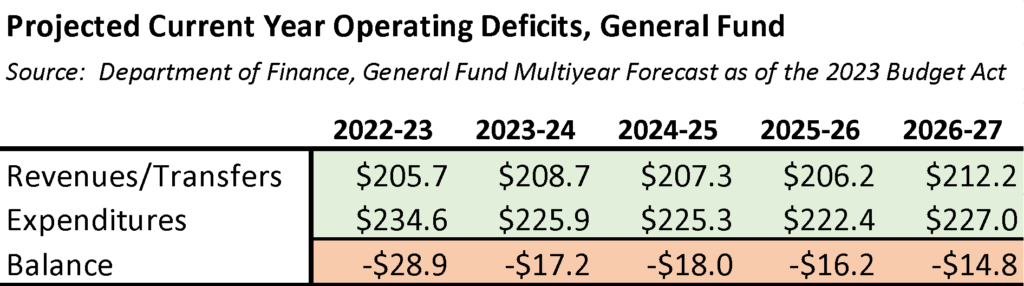
And future deficits were already built into current spending plans, even before the now-expected downturn in revenues. As contained in Department of Finance 5-year projections, the 2023 Budget Bill expected to run deficits totaling $95.1 billion over this period based on current expenditure programming. The budget was passed assuming there was enough left in unspent general fund from prior budgets to cover the first three years. In spite of previous LAO recommendations to hold some of that general fund in additional reserves to cover revenue situations such as what is now taking place, budgets in recent years have continued to spend more than what current tax revenues were expected to provide. Now, the unspent general fund balance expected to cover at least some of the planned deficits is not likely there, and the LAO report estimates that current expenditure programming will push the three outer deficits higher to about $30 billion a year.